Journal List > Endocrinol Metab > v.35(3) > 1516078977

Lee, Han, Kim, Cho, Yoon, and Kim: Predicting the Development of Myocardial Infarction in Middle-Aged Adults with Type 2 Diabetes: A Risk Model Generated from a Nationwide Population-Based Cohort Study in Korea

Abstract

Background

Most of the widely used prediction models for cardiovascular disease are known to overestimate the risk of this disease in Asians. We aimed to generate a risk model for predicting myocardial infarction (MI) in middle-aged Korean subjects with type 2 diabetes.

Methods

A total of 1,272,992 subjects with type 2 diabetes aged 40 to 64 who received health examinations from 2009 to 2012 were recruited from the Korean National Health Insurance database. Seventy percent of the subjects (n=891,095) were sampled to develop the risk prediction model, and the remaining 30% (n=381,897) were used for internal validation. A Cox proportional hazards regression model and Cox coefficients were used to derive a risk scoring system. Twelve risk variables were selected, and a risk nomogram was created to estimate the 5-year risk of MI.

Results

During 7.1 years of follow-up, 24,809 cases of MI (1.9%) were observed. Age, sex, smoking status, regular exercise, body mass index, chronic kidney disease, duration of diabetes, number of anti-diabetic medications, fasting blood glucose, systolic blood pressure, total cholesterol, and atrial fibrillation were significant risk factors for the development of MI and were incorporated into the risk model. The concordance index for MI prediction was 0.682 (95% confidence interval [CI], 0.678 to 0.686) in the development cohort and 0.669 (95% CI, 0.663 to 0.675) in the validation cohort.

Conclusion

A novel risk engine was generated for predicting the development of MI among middle-aged Korean adults with type 2 diabetes. This model may provide useful information for identifying high-risk patients and improving quality of care.

INTRODUCTION

It is well established that diabetes and related metabolic disturbances increase the risk of cardiovascular diseases (CVDs). Despite the observation that the incidence rate of CVD is decreasing, people with diabetes still have a two to three times greater risk of developing ischemic heart disease, myocardial infarction (MI), and cerebrovascular diseases [1,2]. Therefore, efforts to prevent CVD through risk stratification are emphasized in the representative diabetes management guidelines [36].
Various risk factors, including anthropometric indices, lifestyle factors, family history, comorbidities, and blood parameters, contribute to the development of CVD [711]. The usefulness of more direct assessments, such as coronary computed tomography angiography, has been suggested, although its efficacy as a screening modality is unclear [12,13]. For comprehensive risk assessment, numerous risk engines that mathematically combine multiple predictors have been developed and are being utilized. However, the predictive value of the models remains unclear due to methodological shortcomings, and lack of external validation and a lack of model impact studies [14]. Because the risk of CVD is considerably different according to the background comorbidities and ethnicities, the development and validation of tailored risk models would increase the prediction accuracy for specific populations. Therefore, using a large-scale nationwide population-based database, we aimed to develop a new risk model for predicting MI in middle-aged Korean adults with type 2 diabetes.

METHODS

Data source and study subjects

The Korean National Health Insurance Service (NHIS) is a single, government-managed insurer to which all residents in Korea subscribe. Because it has adopted a fee-for-service system to pay healthcare providers, the NHIS obtains various information representing the entire Korean population. The database contains comprehensive healthcare information, including an eligibility database (e.g., age, sex, income rank, disability, type of eligibility), a medical treatment database (general information on specification, consultation statements, diagnosis statements defined by the International Classification of Disease 10th revision [ICD-10], and prescription statements), a health examination database (results of general health examinations and questionnaires on lifestyle and behavior), and a medical care institution database (types of medical care institutions, location, equipment, and number of physicians). Beneficiaries of the NHIS are encouraged to undergo standardized health examinations at least every two years. Hospitals performing health examinations were certified by the NHIS and received regular quality control. Details on the database are described elsewhere [15,16].
A total of 2,706,620 people with type 2 diabetes who received health examinations between 2009 and 2012 were selected. We excluded subjects aged <40 or ≥65 years (n=849,899) because old age itself is undisputedly the strongest risk factor for MI and because we aimed to develop a risk model in middle-aged adults. Those with missing data for one or more variables (n= 572,439) and those with a history of MI before the index year (n=11,290) were also excluded. The final study population consisted of 1,272,992 people. The original database was split into two datasets, the development cohort and the validation cohort. For the development cohort, 70% of the eligible subjects (n= 891,095) were sampled to develop the risk prediction models. The remaining 30% (n=381,897) were extracted according to Harrell’s bootstrap resampling method for internal validation. This study was approved by the Institutional Review Board of Yeouido St. Mary’s Hospital, The Catholic University of Korea (No. SC19ZESE0027). As anonymous and deidentified data were used for analysis, informed consent was waived.

Definitions and follow-up

Type 2 diabetes was diagnosed in the presence of at least one claim per year with ICD-10 codes E11–14 and the prescription of antidiabetic medication, or fasting glucose level ≥126 mg/dL. Subjects with the disease code of insulin-dependent diabetes (E10) or gestational diabetes (O24.4 and O24.9) were not included in this study. MI was defined when ICD-10 codes I21 or I22 were newly recorded during hospitalization. The study population was followed-up by the date of MI, or until 31 December 2017, whichever came first. The mean follow-up period was 7.1±1.2 years.

Predictor variables

We identified potential risk factors for MI in people with type 2 diabetes based on the literature and selected variables that were most likely to have good predictive ability and available from the NHIS database [2,711,17]. Age was divided into three groups (40 to 49, 50 to 59, and 60 to 64 years). Smoking status was identified by a self-reported questionnaire and divided into two groups (current smoker vs. non- or ex-smoker) because the risk of MI was similar between non-smoker and ex-smoker. Individuals performing more than 30 minutes of moderate physical activity at least five times per week or more than 20 minutes of strenuous physical activity at least three times per week were regarded as performing regular exercise. Body mass index (BMI) was calculated as weight in kilograms divided by the square of the height in meters. Individuals were categorized into three BMI groups according to the World Health Organization criterion for Asians: <18.5 kg/m2 (underweight), 18.5 to 22.9 kg/m2 (normal weight), and ≥23.0 kg/m2 (overweight or obese). The estimated glomerular filtration rate (eGFR) was calculated using the abbreviated Modification of Diet in Renal Disease formula: 175×serum Cr (mg/dL)−1.154×age (yr)−0.203×0.742 (if female). Chronic kidney disease (CKD) was defined as an eGFR <60 mL/min/1.73 m2. Because hemoglobin A1c (HbA1c) levels were not available in the NHIS database, we used the duration of diabetes and the number of anti-diabetic medications to account for the severity of diabetes. The duration of diabetes was categorized as <5 and ≥5 years using the date of the first claim for diabetes and the index date. The number of anti-diabetic medications was categorized as 0–1 and ≥2 or the use of insulin. Fasting blood glucose (FBG) levels were categorized into five groups: <100, 100 to 140, 140 to 160, 160 to 180, and ≥180 mg/dL. Systolic blood pressure (SBP) was categorized into five groups: <130, 130 to 140, 140 to 150, 150 to 160, and ≥160 mm Hg. Total cholesterol (TC) levels were categorized into four groups: <160, 160 to 200, 200 to 240, and ≥240 mg/dL. Diagnosis of atrial fibrillation (AF) was based on the recording of ICD-10 codes I48.

Statistical analysis

Baseline characteristics are presented as numbers and frequencies as percentages, and the chi-square test was used to identify differences in categorical variables. Incidence rates are expressed as events per 1,000 person-years. Cox proportional hazards regression analysis was used to estimate the hazard ratio (HR) and 95% confidence interval (CI) values for MI according to the risk group. Variable selection to build the risk prediction model was conducted using the multivariate model. We assigned risk scores based on the HR for each risk factor in the final Cox proportional hazards regression model. Each of the 12 variables, including age, sex, smoking status, regular exercise, BMI, CKD, duration of diabetes, number of anti-diabetic medications, FBG, SBP, TC, and AF, was applied with scores of 0–100. The risk prediction model for MI was translated into a risk score nomogram, and each variable was made to correspond to a specific point by drawing a line straight up the score axis. C-statistics were used to assess discriminative power. Predicted and observed 5-year risks of MI in the development and validation cohorts were compared by ranking participants into decile groups of total risk score. All statistical analyses were performed using SAS version 9.4 (SAS Institute Inc., Cary, NC, USA). A P<0.05 was considered to be statistically significant.

RESULTS

Baseline characteristics of the study population

The mean ages of the study subjects without or with incident MI were 53.5±6.8 and 55.4±6.4 years, respectively. During follow-up, 24,809 cases of MI (1.9%) developed. In both the development and validation cohorts, subjects with incident MI were older, more likely to be male and current smokers, engage in less regular exercise, have a longer duration of diabetes, and take more anti-diabetic medications or insulin compared with subjects without MI. They were also likely to have higher levels of SBP, and TC, and higher prevalence of CKD and AF. Underweight people were more frequent in the group with incident MI (Table 1).

Risk variables for incident MI

The age- and sex-adjusted HRs (model 1) and all 12 variable-adjusted HRs (model 2) for incident MI are presented in Table 2. The results were obtained using the development cohort. The HRs (95% CI) in the groups aged 50 to 59 and 60 to 64 years were 1.50 (95% CI, 1.44 to 1.56) and 1.98 (95% CI, 1.89 to 2.07), respectively. Females had a significantly lower risk of MI than males. Current smoking and the presence of CKD or AF were associated with a more than 60% increased risk of MI, whereas engaging in regular exercise had a protective effect against MI. Subjects with normal weight and overweight or obesity had a 25% lower risk of MI compared to underweight people. Subjects with a diabetes duration of more than 5 years and who were taking more than two anti-diabetic medications or insulin had an approximately 30% higher risk of MI. There was a J-shaped association between FBG and the risk of MI. Subjects with FBG levels of <100 or ≥160 mg/dL were at higher risk compared with people with FBG levels between 100 and 140 mg/dL. The associations between FBG and the risk of MI were consistent in subjects with or without use of anti-diabetic medications (P for interaction =0.17). There was a graded association between SBP or TC levels and the risk of MI.

Development of the MI risk engine

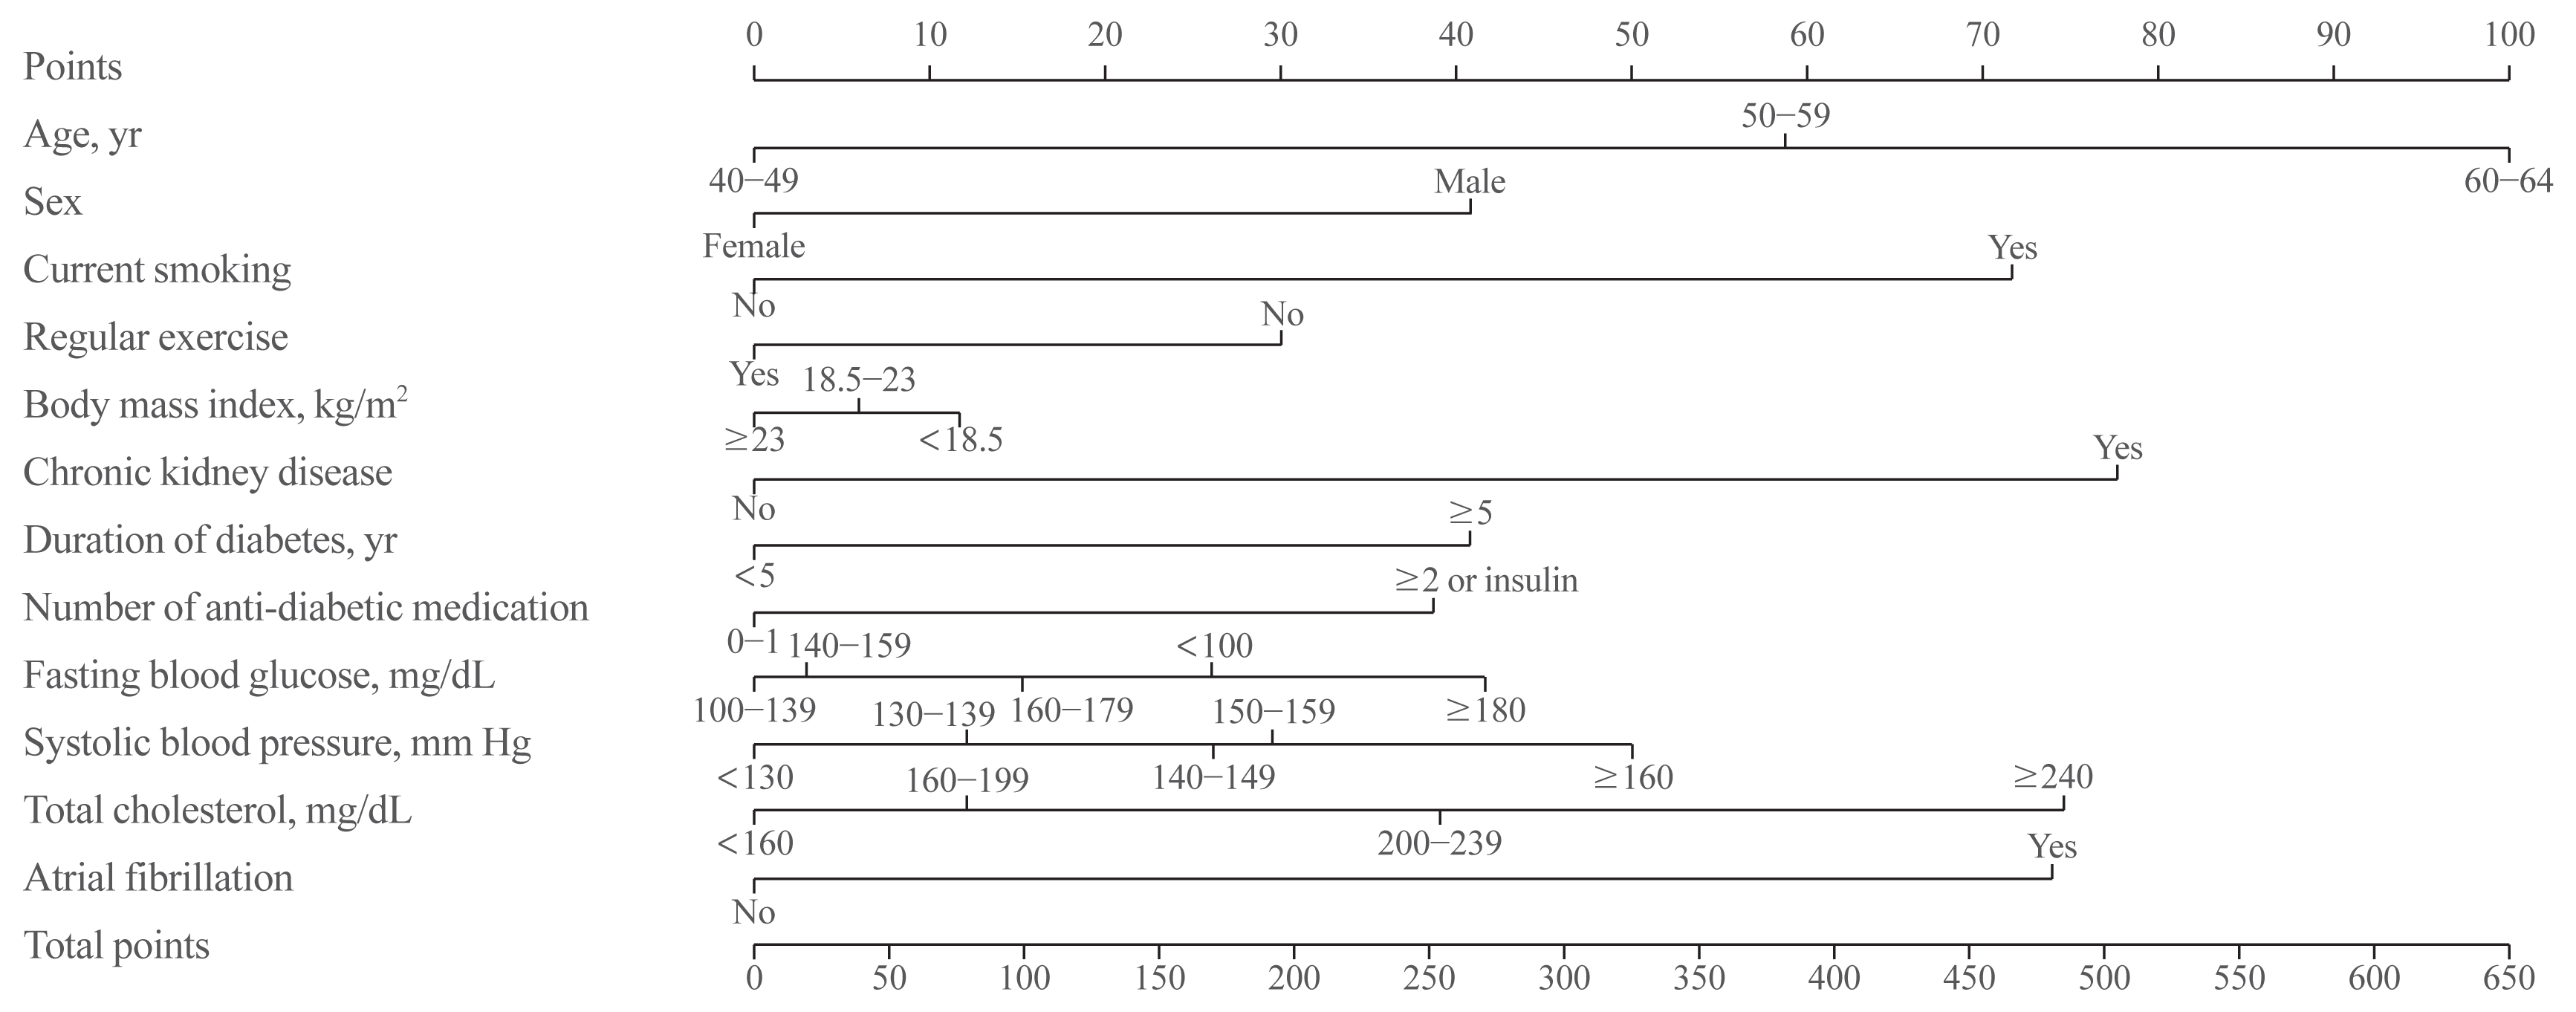
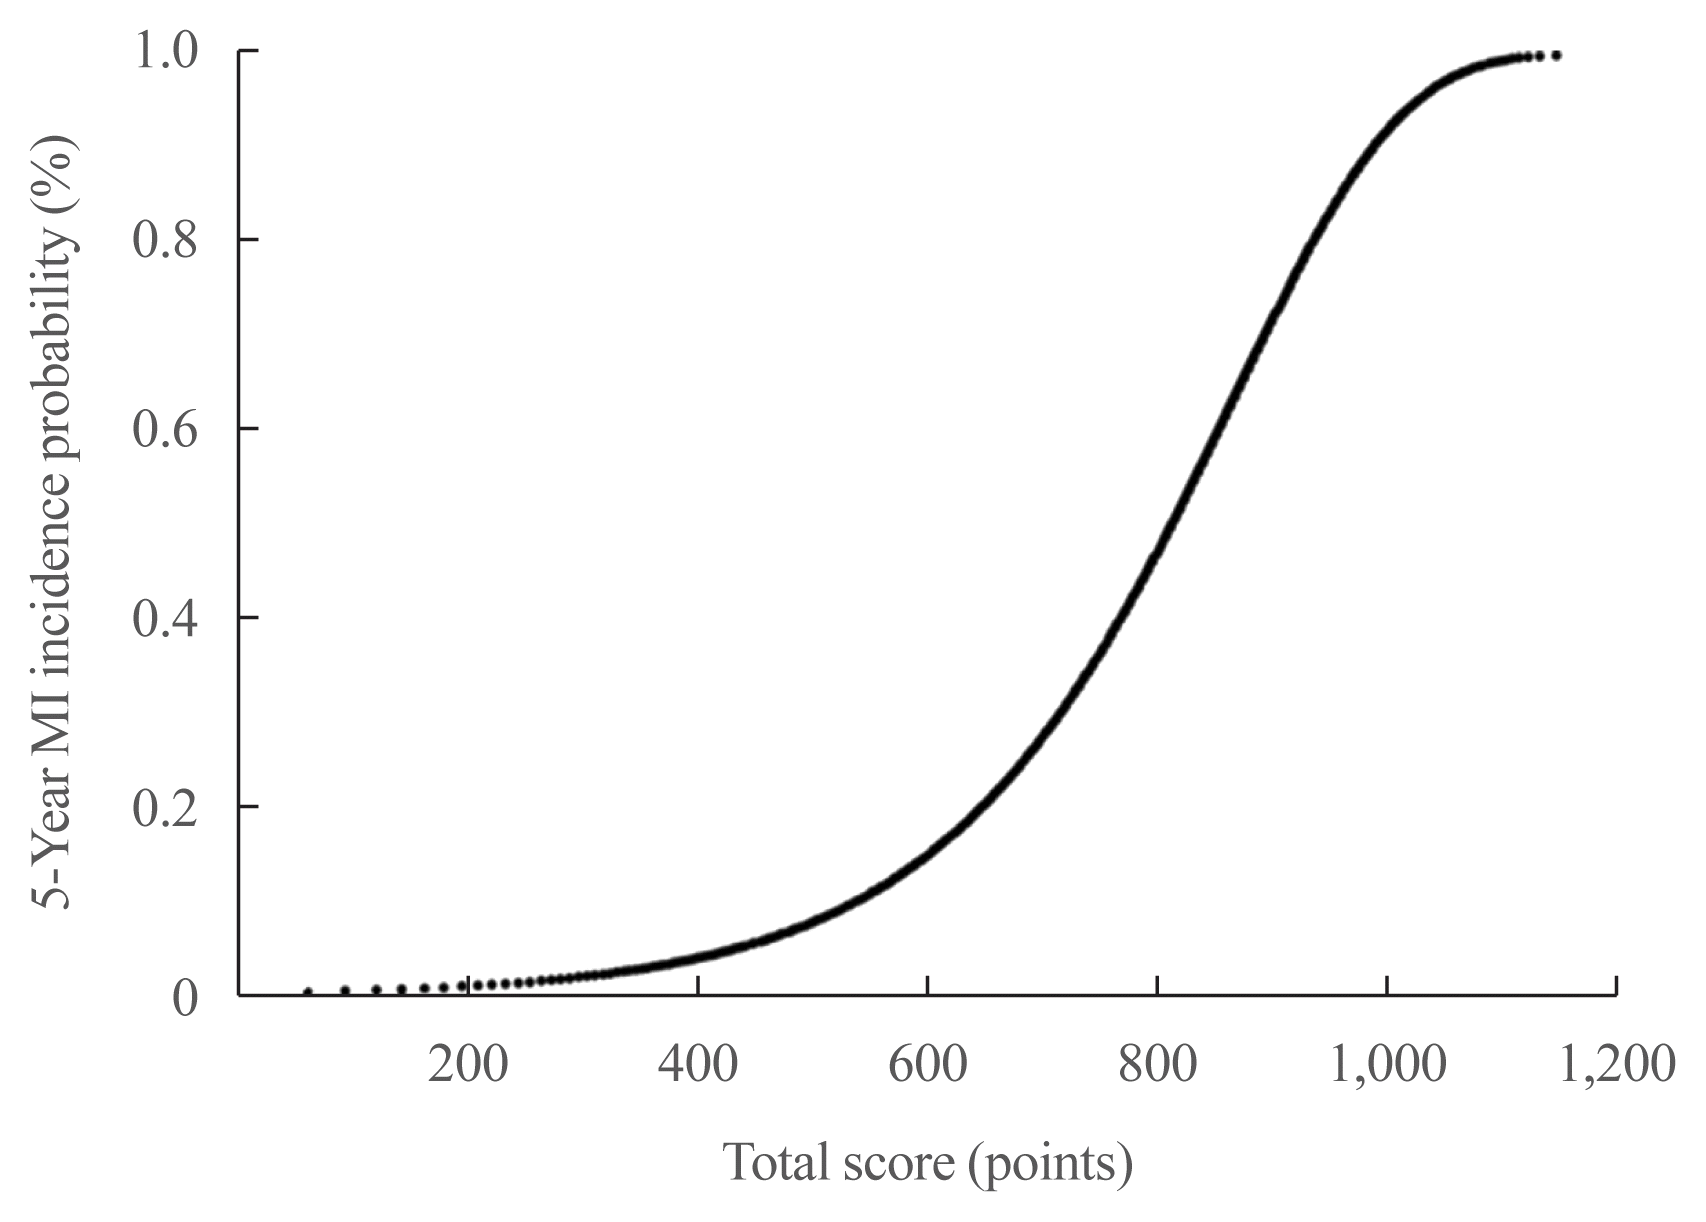
A risk nomogram based on the risk prediction model was created to estimate the 5-year risk of MI (Fig. 1). The total risk score, which is the sum of the scores for 12 variables, ranged from 0 to 654 (Table 3). Among the variables, old age, current smoking, presence of CKD or AF, and high levels of SBP or TC were the main contributors increasing the risk of MI. For example, a 61-year-old (100 points) man (41 points) with type 2 diabetes who is a current smoker (72 points), did not engage in regular exercise (30 points), had a BMI of 24.8 kg/m2 (0 points), had diabetes for 8 years (41 points), was on insulin treatment (39 points), had an FBG level of 145 mg/dL (3 points), had an SBP of 142 mm Hg (26 points), had a TC of 228 mg/dL (39 points), and did not have CKD (0 points) or AF (0 points) had a total risk score of 391. This score corresponds to a 3.8% 5-year incidence probability of MI (Fig. 2). If this man quits smoking and performs regular exercise, the total risk score will become 289, and the 5-year incidence probability of MI will be decreased to 1.9%. When the total risk score is 540 points, the 5-year incidence probability of MI is estimated to be >10%. The concordance index for MI prediction was 0.682 (95% CI, 0.678 to 0.686) in the development cohort. An interactive web-based platform (http://md.koobian.com/mi) that automatically calculates the risk of MI is available for easier clinical application.

Validation of the MI risk engine

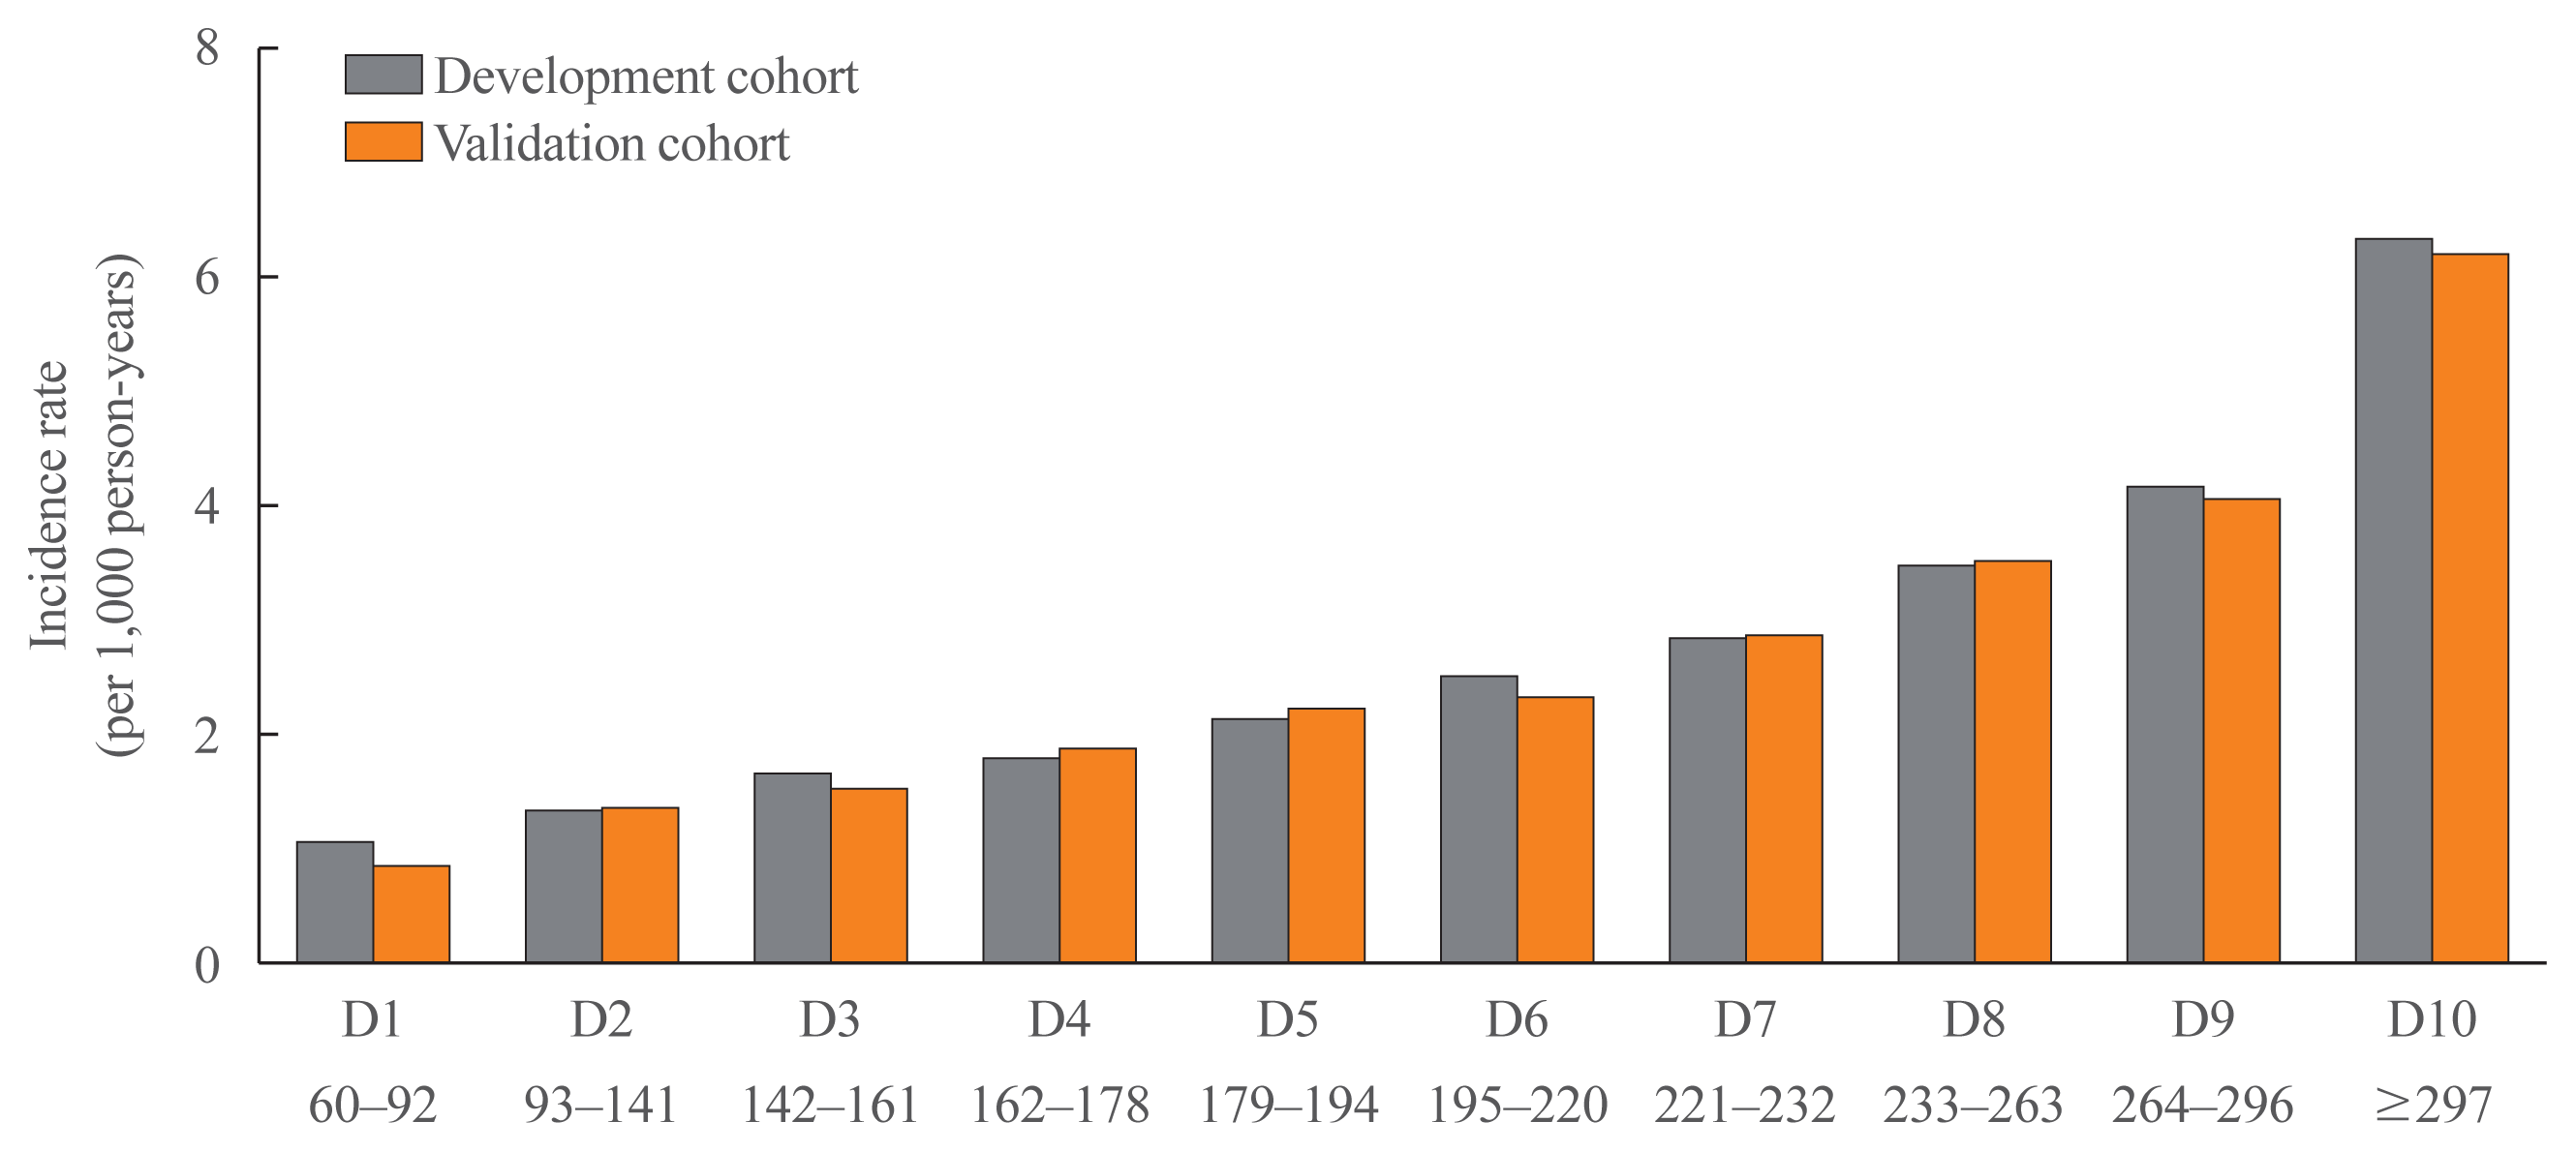
The clinical characteristics of the validation cohort were similar to those of the development cohort, and none of the potential predictors differed significantly between the two groups (Table 1). The concordance index for MI prediction was 0.669 (95% CI, 0.663 to 0.675) in the validation cohort. For the internal validation of the developed risk model, we compared the incidence rate of MI according to the decile groups of the total risk score. The actual incidence rates of MI in the validation cohort were similar to those predicted by the MI risk model (Fig. 3).

DISCUSSION

Using a nationwide population-based cohort database, we generated a novel risk model for predicting the development of MI that can be specifically used in middle-aged Korean adults with type 2 diabetes. Twelve risk variables were identified, and scores for each risk category were determined. All the variables can be easily collected in routine clinical practice, and a web-based calculator was developed for easy application.
Risk stratified interventions based on comprehensive assessment of multiple risk variables are recommended for the prevention of CVD, and there is an abundance of prediction models in the general population [14]. Several well-known models, such as the Framingham risk score [18], Systematic COronary Risk Evaluation (SCORE) [19], and American College of Cardiology (ACC)/American Heart Association (AHA) Pooled Cohort Equations [20], have been widely used, validated, and implemented in guidelines. However, risk models derived from certain populations may not be applicable to other populations that have different characteristics and incidence rates of the event of interest. For example, when the Framingham risk score was applied to the Chinese population, the risk of coronary heart disease (CHD) was overestimated in all decile risk groups. In the 10th risk decile in men, the predicted CHD death rate was 20%, whereas the actual rate was 3% [21]. The Framingham risk score also overestimated the risk of CHD by 3 to 6-fold in the Korean population [22]. The ACC/AHA equations overestimated the risk of atherosclerotic CVD by more than 50% in Korean men [23]. The U.K. Prospective Diabetes Study (UKPDS) risk engine is another popular risk model for CHD in subjects with type 2 diabetes [24]. However, a recent external validation study in United Kingdom patients with newly diagnosed type 2 diabetes suggested that the risk equation needs to be revised due to significant overestimation of CHD and fatal CHD [25]. In Japanese and Chinese populations, the UKPDS risk engine overestimated the risk of CHD with suboptimal discrimination [26,27]. These observations indicate that there are unmet needs for CVD risk prediction, and the development of population-, disease-, and outcome-specific models is required.
Our goal was to use routinely obtained clinical and biochemical variables to generate a risk model for predicting MI in Korean people with type 2 diabetes. Previously, a 10-year CHD risk model from Koreans (Korean Heart Study) was reported [22]. The basic model included age, blood pressure, TC, smoking status and diabetes as risk variables, and the optimal model was created by adding other lipid parameters. The addition of high-density lipoprotein cholesterol (HDL-C; area under the curve= 0.764) or triglyceride (area under the curve=0.815) levels produced the best discriminating model in men and women, respectively. Although this model had high predictive power, less than 10% of the study population had diabetes, suggesting that it might not be appropriate for people with diabetes. In addition, because people who underwent private health examinations comprised the cohort, it may not represent the general population. Another risk model using age, sex, BMI, HbA1c, blood pressure, HDL-C, albuminuria, creatinine, family history of CHD, and 2-way interaction terms between sex and other predictors was developed in Korean subjects with type 2 diabetes [28]. This equation showed superior predictability for CHD risk compared to the UKPDS risk engine. However, it is limited because only 732 participants from one hospital were used for model generation. Our model is a risk engine optimized for people with type 2 diabetes and is generated based on the nationally representative database including more than one million Korean participants. The concordance index of this model was 0.682, with substantial discriminating power.
Interestingly, underweight people had a higher risk of MI than normal and overweight or obese people. The association between BMI and the risk of MI is inconclusive and might be affected by interactions with other factors. Although it is generally thought that a graded relationship exists between BMI and the risk of MI, a large case-control study from 52 countries showed that this association became nonsignificant after adjustment for multiple risk factors. Of note, the degree of association differed among ethnicities, with no significant relation in south Asians, Arabs, and mixed-race Africans [29]. A Norwegian study showed a sex-specific association, with obese men having an increased risk of MI and overweight women having a decreased risk compared with normal weight subjects [30]. Some other studies support evidence that underweight people are at higher risk of CVD or CVD mortality compared with normal weight people [31,32]. A study encompassing nearly 0.5 million United States adults concluded that the relative risk for CVD was elevated by 34% in the underweight population, whereas the obese group had a 15% elevated risk and was even insignificant in the overweight group [32]. Because BMI reflects total adiposity more than central adiposity and does not differentiate lean mass and fat mass, lower BMI may indicate less amount of beneficial fat or sarcopenia. In addition, a problem of poor nutritional status in underweight individuals can be another possible explanation for this unexpected finding.
Our study showed a J-shaped association between FBG and the risk of MI. There are several studies showing the J-shaped relationship between FBG and CVD or mortality, independent of diabetes status [33,34]. A Chinese population-based prospective cohort study demonstrated that this association was evident in participants including untreated diabetes [34]. We also found a similar pattern in subjects with or without use of anti-diabetic medications. Although the mechanistic explanation of this phenomenon needs further clarification, it is suggested that hypoglycemia leads to sympatho-adrenal activation and counter-regulatory hormone secretion. This condition can trigger vasoconstriction, platelet aggregation, vascular inflammation, and cardiac arrhythmia which might increase the risk for CVD [35].
AF was another significant contributing factor for increased risk of MI. MI and AF are closely related, and AF may precede or complicate the clinical course of MI [36]. At least three mechanisms may account for the association between AF and MI: (1) atherosclerosis and its associated inflammatory process, yielding a pro-thrombotic state; (2) direct coronary thromboembolism from the left atrial appendage; and (3) tachyarrhythmia episodes resulting in supply-demand mismatch [37]. Asians have a higher prevalence of diabetic kidney disease than Caucasians, accounting for 40% to 55% of those on dialysis, compared with less than 30% of those in Western countries [38]. Asian people with a low baseline eGFR have a higher risk of future stroke [39]. Both the MI and stroke risk equations, which included eGFR as a predictor, derived from the Hong Kong Diabetes Registry performed better among Chinese patients with type 2 DM than the respective UKPDS risk engines, which did not include eGFR as a predictor; this difference suggests that renal dysfunction is an important risk factor for CVD, especially in Asian populations [26,38,39].
There are some limitations in this study. First, we did not have information on HbA1c levels or urine albumin-creatinine ratio, which were used as risk variables in other models. Instead of these variables, we used the duration of diabetes and the number of anti-diabetic medications to account for the severity of diabetes and the presence of CKD to account for the renal effect on CVD. Second, direct comparison of the performance with previous models was not possible due to the different risk variables used. However, we performed internal validation and showed that the actual incidence rate was similar to the predicted value. Third, because CKD was defined based on one measurement of eGFR, possibility of misclassification due to acute kidney injury remains. Fourth, the use of anti-hypertensive agents or lipid-lowering agents was not considered, which might have influence on the risk of MI. Lastly, because this is a Korean-specific model, its usefulness in other countries or ethnicities needs further investigation.
In conclusion, we expect that our risk model will be a useful tool for identifying individuals at a high risk of developing MI. Because 12 components of the risk model can be easily collected in routine clinical practice, this approach of risk assessment and intervention would improve the quality of care for patients with diabetes.

Notes

CONFLICTS OF INTEREST

No potential conflict of interest relevant to this article was reported.

AUTHOR CONTRIBUTIONS

Conception or design: S.H.L., K.H., M.K.K. Acquisition, analysis, or interpretation of data: S.H.L., K.H., H.S.K., J.H.C., K.H.Y., M.K.K. Drafting the work or revising: S.H.L., M.K.K. Final approval of the manuscript: S.H.L., K.H., H.S.K., J.H.C., K.H.Y., M.K.K.

ACKNOWLEDGMENTS

This study was performed using the database from the National Health Insurance System, and the results do not necessarily represent the opinion of the National Health Insurance Corporation. This work was supported by EnM Research Award 2018 of the Korean Endocrine Society.

REFERENCES

1. Ko SH, Han K, Lee YH, Noh J, Park CY, Kim DJ, et al. Past and current status of adult type 2 diabetes mellitus management in Korea: a National Health Insurance Service database analysis. Diabetes Metab J. 2018; 42:93–100.
crossref
2. Emerging Risk Factors Collaboration. Sarwar N, Gao P, Seshasai SR, Gobin R, Kaptoge S, et al. Diabetes mellitus, fasting blood glucose concentration, and risk of vascular disease: a collaborative meta-analysis of 102 prospective studies. Lancet. 2010; 375:2215–22.
crossref
3. American Diabetes Association. 10. Cardiovascular disease and risk management: standards of medical care in diabetes-2020. Diabetes Care. 2020; 43(Suppl 1):S111–34.
4. Arnett DK, Blumenthal RS, Albert MA, Buroker AB, Goldberger ZD, Hahn EJ, et al. 2019 ACC/AHA guideline on the primary prevention of cardiovascular disease: executive summary: a report of the American College of Cardiology/American Heart Association task force on clinical practice guidelines. Circulation. 2019; 140:e563–95.
crossref
5. Kim MK, Ko SH, Kim BY, Kang ES, Noh J, Kim SK, et al. 2019 Clinical practice guidelines for type 2 diabetes mellitus in Korea. Diabetes Metab J. 2019; 43:398–406.
crossref
6. Cosentino F, Grant PJ, Aboyans V, Bailey CJ, Ceriello A, Delgado V, et al. 2019 ESC guidelines on diabetes, pre-diabetes, and cardiovascular diseases developed in collaboration with the EASD. Eur Heart J. 2020; 41:255–323.
7. Cho JH, Rhee EJ, Park SE, Kwon H, Jung JH, Han KD, et al. The risk of myocardial infarction and ischemic stroke according to waist circumference in 21,749,261 Korean adults: a nationwide population-based study. Diabetes Metab J. 2019; 43:206–21.
crossref
8. Rapsomaniki E, Timmis A, George J, Pujades-Rodriguez M, Shah AD, Denaxas S, et al. Blood pressure and incidence of twelve cardiovascular diseases: lifetime risks, healthy life-years lost, and age-specific associations in 1·25 million people. Lancet. 2014; 383:1899–911.
crossref
9. Wilson PW, D’Agostino RB, Parise H, Sullivan L, Meigs JB. Metabolic syndrome as a precursor of cardiovascular disease and type 2 diabetes mellitus. Circulation. 2005; 112:3066–72.
crossref
10. Rawshani A, Rawshani A, Franzen S, Sattar N, Eliasson B, Svensson AM, et al. Risk factors, mortality, and cardiovascular outcomes in patients with type 2 diabetes. N Engl J Med. 2018; 379:633–44.
crossref
11. Liu G, Li Y, Hu Y, Zong G, Li S, Rimm EB, et al. Influence of lifestyle on incident cardiovascular disease and mortality in patients with diabetes mellitus. J Am Coll Cardiol. 2018; 71:2867–76.
12. Muhlestein JB, Lappe DL, Lima JA, Rosen BD, May HT, Knight S, et al. Effect of screening for coronary artery disease using CT angiography on mortality and cardiac events in high-risk patients with diabetes: the FACTOR-64 randomized clinical trial. JAMA. 2014; 312:2234–43.
crossref
13. Lee KY, Hwang BH, Kim TH, Kim CJ, Kim JJ, Choo EH, et al. Computed tomography angiography images of coronary artery stenosis provide a better prediction of risk than traditional risk factors in asymptomatic individuals with type 2 diabetes: a long-term study of clinical outcomes. Diabetes Care. 2017; 40:1241–8.
crossref
14. Damen JA, Hooft L, Schuit E, Debray TP, Collins GS, Tzoulaki I, et al. Prediction models for cardiovascular disease risk in the general population: systematic review. BMJ. 2016; 353:i2416.
crossref
15. Lee YH, Han K, Ko SH, Ko KS, Lee KU; Taskforce Team of Diabetes Fact Sheet of the Korean Diabetes Association. Data analytic process of a nationwide population-based study using national health information database established by National Health Insurance Service. Diabetes Metab J. 2016; 40:79–82.
crossref
16. Han K, Yun JS, Park YM, Ahn YB, Cho JH, Cha SA, et al. Development and validation of a risk prediction model for severe hypoglycemia in adult patients with type 2 diabetes: a nationwide population-based cohort study. Clin Epidemiol. 2018; 10:1545–59.
crossref
17. Odutayo A, Wong CX, Hsiao AJ, Hopewell S, Altman DG, Emdin CA. Atrial fibrillation and risks of cardiovascular disease, renal disease, and death: systematic review and meta-analysis. BMJ. 2016; 354:i4482.
crossref
18. D’Agostino RB Sr, Vasan RS, Pencina MJ, Wolf PA, Cobain M, Massaro JM, et al. General cardiovascular risk profile for use in primary care: the Framingham Heart Study. Circulation. 2008; 117:743–53.
crossref
19. Conroy RM, Pyorala K, Fitzgerald AP, Sans S, Menotti A, De Backer G, et al. Estimation of ten-year risk of fatal cardiovascular disease in Europe: the SCORE project. Eur Heart J. 2003; 24:987–1003.
crossref
20. Goff DC Jr, Lloyd-Jones DM, Bennett G, Coady S, D’Agostino RB, Gibbons R, et al. 2013 ACC/AHA guideline on the assessment of cardiovascular risk: a report of the American College of Cardiology/American Heart Association task force on practice guidelines. Circulation. 2014; 129(25 Suppl 2):S49–73.
21. Liu J, Hong Y, D’Agostino RB Sr, Wu Z, Wang W, Sun J, et al. Predictive value for the Chinese population of the Framingham CHD risk assessment tool compared with the Chinese Multi-Provincial Cohort Study. JAMA. 2004; 291:2591–9.
crossref
22. Jee SH, Jang Y, Oh DJ, Oh BH, Lee SH, Park SW, et al. A coronary heart disease prediction model: the Korean Heart Study. BMJ Open. 2014; 4:e005025.
crossref
23. Jung KJ, Jang Y, Oh DJ, Oh BH, Lee SH, Park SW, et al. The ACC/AHA 2013 pooled cohort equations compared to a Korean Risk Prediction Model for atherosclerotic cardiovascular disease. Atherosclerosis. 2015; 242:367–75.
crossref
24. Stevens RJ, Kothari V, Adler AI, Stratton IM; United Kingdom Prospective Diabetes Study (UKPDS) Group. The UKPDS risk engine: a model for the risk of coronary heart disease in type II diabetes (UKPDS 56). Clin Sci (Lond). 2001; 101:671–9.
crossref
25. Bannister CA, Poole CD, Jenkins-Jones S, Morgan CL, Elwyn G, Spasic I, et al. External validation of the UKPDS risk engine in incident type 2 diabetes: a need for new type 2 diabetes-specific risk equations. Diabetes Care. 2014; 37:537–45.
crossref
26. Yang X, So WY, Kong AP, Ma RC, Ko GT, Ho CS, et al. Development and validation of a total coronary heart disease risk score in type 2 diabetes mellitus. Am J Cardiol. 2008; 101:596–601.
crossref
27. Tanaka S, Tanaka S, Iimuro S, Yamashita H, Katayama S, Akanuma Y, et al. Predicting macro- and microvascular complications in type 2 diabetes: the Japan Diabetes Complications Study/the Japanese Elderly Diabetes Intervention Trial risk engine. Diabetes Care. 2013; 36:1193–9.
28. Koo BK, Oh S, Kim YJ, Moon MK. Prediction of coronary heart disease risk in Korean patients with diabetes mellitus. J Lipid Atheroscler. 2018; 7:110–121.
crossref
29. Yusuf S, Hawken S, Ounpuu S, Bautista L, Franzosi MG, Commerford P, et al. Obesity and the risk of myocardial infarction in 27,000 participants from 52 countries: a case-control study. Lancet. 2005; 366:1640–9.
crossref
30. Borgeraas H, Hertel JK, Svingen GF, Seifert R, Pedersen EK, Schartum-Hansen H, et al. Association of body mass index with risk of acute myocardial infarction and mortality in Norwegian male and female patients with suspected stable angina pectoris: a prospective cohort study. BMC Cardiovasc Disord. 2014; 14:68.
crossref
31. Hansel B, Roussel R, Elbez Y, Marre M, Krempf M, Ikeda Y, et al. Cardiovascular risk in relation to body mass index and use of evidence-based preventive medications in patients with or at risk of atherothrombosis. Eur Heart J. 2015; 36:2716–28.
crossref
32. Park D, Lee JH, Han S. Underweight: another risk factor for cardiovascular disease?: A cross-sectional 2013 Behavioral Risk Factor Surveillance System (BRFSS) study of 491,773 individuals in the USA. Medicine (Baltimore). 2017; 96:e8769.
33. Lee JH, Han K, Huh JH. The sweet spot: fasting glucose, cardiovascular disease, and mortality in older adults with diabetes: a nationwide population-based study. Cardiovasc Diabetol. 2020; 19:44.
crossref
34. Lu J, He J, Li M, Tang X, Hu R, Shi L, et al. Predictive value of fasting glucose, postload glucose, and hemoglobin A1c on risk of diabetes and complications in Chinese adults. Diabetes Care. 2019; 42:1539–48.
crossref
35. Wright RJ, Frier BM. Vascular disease and diabetes: is hypoglycaemia an aggravating factor? Diabetes Metab Res Rev. 2008; 24:353–63.
crossref
36. Park GM, Han S, Kim SH, Jo MW, Her SH, Lee JB, et al. Model for assessing cardiovascular risk in a Korean population. Circ Cardiovasc Qual Outcomes. 2014; 7:944–51.
crossref
37. Violi F, Soliman EZ, Pignatelli P, Pastori D. Atrial fibrillation and myocardial infarction: a systematic review and appraisal of pathophysiologic mechanisms. J Am Heart Assoc. 2016; 5:e003347.
crossref
38. Ng IHY, Cheung KKT, Yau TTL, Chow E, Ozaki R, Chan JCN. Evolution of diabetes care in Hong Kong: from the Hong Kong Diabetes Register to JADE-PEARL program to RAMP and PEP program. Endocrinol Metab (Seoul). 2018; 33:17–32.
crossref
39. Yang X, So WY, Kong AP, Ho CS, Lam CW, Stevens RJ, et al. Development and validation of stroke risk equation for Hong Kong Chinese patients with type 2 diabetes: the Hong Kong Diabetes Registry. Diabetes Care. 2007; 30:65–70.
crossref

Fig. 1
A nomogram for the prediction of the 5-year probability of myocardial infarction. Each of the 12 variables was applied with scores from 0 to 100. Each variable corresponds to a specific point by drawing a line straight up to the score axis. The total score, which is the sum of the scores for each of the 12 variables at the bottom of the nomogram, ranges from 0 to 654.
enm-2020-704f1.gif
Fig. 2
The 5-year incidence probability of myocardial infarction (MI) according to the total risk score.
enm-2020-704f2.gif
Fig. 3
Incidence rate (per 1,000 person-years) based on the decile groups of total risk score in the development and validation cohorts. The numbers on the x-axis represent the range of the total risk score according to each decile group.
enm-2020-704f3.gif
Table 1
Baseline Characteristics of the Study Participants According to Incident MI in the Development and Validation Cohorts
Characteristic Development cohort (n=891,095) Validation cohort (n=381,897)


MI (−) MI (+) P value MI (−) MI (+) P value
Number 873,635 17,460 374,548 7,349

Age, yr <0.0001 <0.0001
 40–49 248,957 (28.5) 3,292 (18.9) 106,452 (28.4) 1,359 (18.5)
 50–59 407,974 (46.7) 8,179 (46.8) 175,093 (46.8) 3,519 (47.9)
 60–64 216,704 (24.8) 5,989 (34.3) 93,003 (24.8) 2,471 (33.6)

Sex <0.0001 <0.0001
 Male 558,919 (64.0) 12,300 (70.5) 239,500 (63.9) 5,324 (72.5)
 Female 314,716 (36.0) 5,160 (29.5) 135,048 (36.1) 2,025 (27.5)

Smoking status <0.0001 <0.0001
 Current 251,445 (28.8) 6,811 (39.0) 107,852 (28.8) 2,866 (39.0)

Regular exercise <0.0001 <0.0001
 Yes 462,446 (52.9) 8,236 (47.2) 197,412 (52.7) 3,505 (47.7)

BMI, kg/m2 <0.0001 0.0008
 <18.5 9,559 (1.1) 272 (1.6) 4,174 (1.1) 116 (1.6)
 18.5–23 204,207 (23.4) 4,235 (24.3) 87,438 (23.3) 1,689 (23.0)
 ≥23 659,869 (75.5) 12,953 (74.2) 282,936 (75.5) 5,544 (75.4)

Chronic kidney disease <0.0001 <0.0001
 Yes 57,407 (6.6) 2,171 (12.4) 24,636 (6.6) 895 (12.2)

Duration of diabetes, yr <0.0001 <0.0001
 ≥5 261,606 (29.9) 7,332 (42.0) 112,894 (30.1) 3,123 (42.5)

No. of anti-diabetic medication <0.0001 <0.0001
 ≥2 or insulin 401,728 (46.0) 10,127 (58.0) 172,378 (46.0) 4,274 (58.2)

FBG, mg/dL <0.0001 <0.0001
 <100 70,407 (8.1) 1,701 (9.7) 30,108 (8.0) 765 (10.4)
 100–140 415,280 (47.5) 7,074 (40.5) 178,335 (47.6) 3,004 (40.9)
 140–160 164,414 (18.8) 2,990 (17.1) 70,556 (18.8) 1,220 (16.6)
 160–180 79,768 (9.1) 1,722 (9.9) 34,087 (9.1) 706 (9.6)
 ≥180 143,766 (16.5) 3,973 (22.8) 61,462 (16.4) 1,654 (22.5)

SBP, mm Hg <0.0001 <0.0001
 <130 437,693 (50.1) 7,942 (45.5) 188,024 (50.2) 3,340 (45.5)
 130–140 259,144 (29.7) 5,229 (30.0) 110,947 (29.6) 2,184 (29.7)
 140–150 90,379 (10.4) 2,064 (11.8) 38,401 (10.3) 857 (11.7)
 150–160 51,886 (5.9) 1,241 (7.1) 22,365 (6.0) 547 (7.4)
 ≥160 34,533 (4.0) 984 (5.6) 14,811 (4.0) 421 (5.7)

Total cholesterol, mg/dL <.0001 <0.0001
 <160 156,649 (17.9) 2,866 (16.4) 67,804 (18.1) 1,210 (16.5)
 160–200 323,364 (37.0) 5,900 (33.8) 138,613 (37.0) 2,507 (34.1)
 200–240 263,924 (30.2) 5,425 (31.1) 112,479 (30.0) 2,203 (30.0)
 ≥240 129,698 (14.9) 3,269 (18.7) 55,652 (14.9) 1,429 (19.4)

Atrial fibrillation <0.0001 <0.0001
 Yes 5,263 (0.6) 196 (1.1) 2,359 (0.6) 100 (1.4)

Values are expressed as number (%).

MI, myocardial infarction; BMI, body mass index; FBG, fasting blood glucose; SBP, systolic blood pressure.

Table 2
Hazard Ratios (95% Confidence Intervals) for Incident Myocardial Infarction According to Risk Categories
Variable Number No. of events Incidence rate,/1,000 person-yr Model 1 Model 2
Age, yr
 40–49 252,249 3,292 1.86 1 (reference) 1 (reference)
 50–59 416,153 8,179 2.75 1.52 (1.46–1.59) 1.50 (1.44–1.56)
 60–64 222,693 5,989 3.71 2.11 (2.02–2.20) 1.98 (1.89–2.07)

Sex
 Male 571,219 12,300 3.03 1 (reference) 1 (reference)
 Female 319,876 5,160 2.24 0.68 (0.66–0.70) 0.76 (0.73–0.78)

Smoking status
 Non/Ex 632,839 10,649 2.35 1 (reference) 1 (reference)
 Current 258,256 6,811 3.75 1.69 (1.63–1.75) 1.65 (1.59–1.71)

Regular exercise
 No 420,413 9,224 3.08 1 (reference) 1 (reference)
 Yes 470,682 8,236 2.45 0.78 (0.76–0.81) 0.82 (0.80–0.84)

BMI, kg/m2
 <18.5 9,831 272 3.94 1 (reference) 1 (reference)
 18.5–23 208,442 4,235 2.84 0.72 (0.64–0.81) 0.75 (0.67–0.85)
 ≥23 672,822 12,953 2.70 0.69 (0.61–0.78) 0.75 (0.66–0.84)

Chronic kidney disease
 No 831,517 15,289 2.58 1 (reference) 1 (reference)
 Yes 59,578 2,171 5.02 1.77 (1.69–1.85) 1.68 (1.61–1.76)

Duration of diabetes, yr
 <5 622,157 10,128 2.30 1 (reference) 1 (reference)
 ≥5 268,938 7,332 3.75 1.49 (1.45–1.54) 1.31 (1.26–1.36)

No. of anti-diabetic medication
 0, 1 479,240 7,333 2.19 1 (reference) 1 (reference)
 ≥2 or insulin 411,855 10,127 3.37 1.46 (1.42–1.51) 1.30 (1.26–1.35)

FBG, mg/dL
 <100 72,108 1,701 3.24 1.30 (1.23–1.37) 1.19 (1.13–1.25)
 100–140 422,354 7,074 2.36 1 (reference) 1 (reference)
 140–160 167,404 2,990 2.51 1.08 (1.03–1.12) 1.03 (0.98–1.07)
 160–180 81,490 1,722 2.94 1.26 (1.20–1.33) 1.12 (1.06–1.18)
 ≥180 147,739 3,973 3.75 1.66 (1.60–1.73) 1.34 (1.29–1.40)

SBP, mm Hg
 <130 445,635 7,942 2.50 1 (reference) 1 (reference)
 130–139 264,373 5,229 2.77 1.06 (1.03–1.10) 1.08 (1.04–1.12)
 140–149 92,443 2,064 3.13 1.17 (1.12–1.23) 1.19 (1.13–1.25)
 150–159 53,127 1,241 3.27 1.21 (1.14–1.29) 1.21 (1.14–1.29)
 ≥160 35,517 984 3.87 1.44 (1.35–1.54) 1.39 (1.30–1.49)

Total cholesterol, mg/dL
 <160 159,515 2,866 2.51 1 (reference) 1 (reference)
 160–200 329,264 5,900 2.50 1.04 (0.99–1.08) 1.09 (1.04–1.14)
 200–240 269,349 5,425 2.83 1.22 (1.17–1.28) 1.31 (1.25–1.38)
 ≥240 132,967 3,269 3.48 1.58 (1.50–1.66) 1.68 (1.59–1.77)

Atrial fibrillation
 No 885,636 17,264 2.73 1 (reference) 1 (reference)
 Yes 5,459 196 5.06 1.60 (1.39–1.84) 1.64 (1.42–1.89)

Model 1: Adjusted for age and sex; Model 2: Adjusted for age, sex, smoking, regular exercise, body mass index, chronic kidney disease, duration of diabetes, numbers of anti-diabetic medication, fasting blood glucose, systolic blood pressure, total cholesterol, and atrial fibrillation.

BMI, body mass index; FBG, fasting blood glucose; SBP, systolic blood pressure.

Table 3
Scoring for Each Risk Factor Category
Variable Value
Age, yr
 40–49 0
 50–59 59
 60–64 100

Sex
 Male 41
 Female 0

Current smoking
 No 0
 Yes 72

Regular exercise
 No 30
 Yes 0

Body mass index, kg/m2
 <18.5 12
 18.5–23 6
 ≥23.0 0

Chronic kidney disease
 No 0
 Yes 78

Duration of diabetes
 <5 0
 ≥5 41

No. of anti-diabetic medication
 0–1 0
 ≥2 or insulin 39

Fasting blood glucose, mg/dL
 <100 26
 100–139 0
 140–159 3
 160–179 15
 ≥180 42

Systolic blood pressure, mm Hg
 <130 0
 130–139 12
 140–149 26
 150–159 29
 ≥160 50

Total cholesterol, mg/dL
 <160 0
 160–199 12
 200–239 39
 ≥240 75

Atrial fibrillation
 No 0
 Yes 74
TOOLS
Similar articles