INTRODUCTION
METHODS
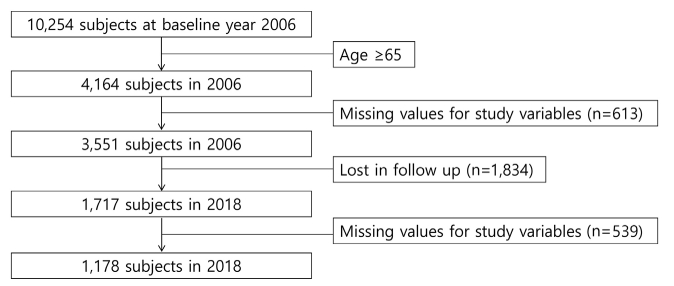
1. Sample and study design
2. Definition of SA
1) No major disease
2) Freedom from disability
3) No depressive symptoms
4) Active social engagement
5) Maintenance of cognitive function
6) Maintenance of physical function
3. Self-rated health and life satisfaction
4. Covariates
5. Statistical analysis
RESULTS
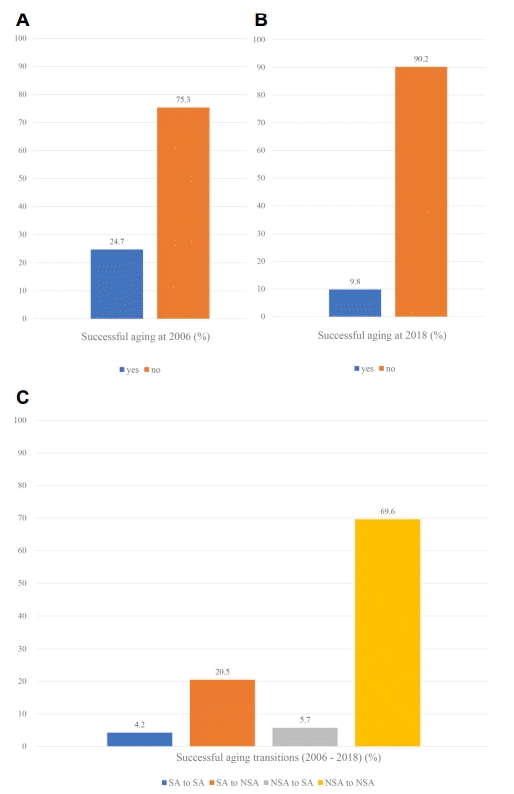
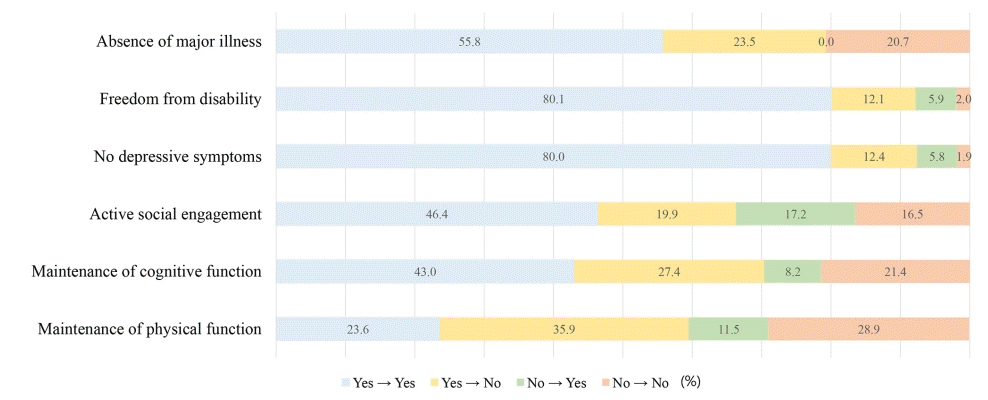
1. Distribution of SA and its transition
2. General characteristics and health related behaviors of study participants
Table 1.
| SA→SA (n=49) | SA→NSA (n=242) | NSA→SA (n=67) | NSA→NSA (n=820) | P | |
|---|---|---|---|---|---|
| Sex | 0.000 | ||||
| Male | 33 (67.3) | 122 (50.4) | 23 (34.3) | 344 (42.0) | |
| Female | 16 (32.7) | 120 (49.6) | 44 (65.7) | 476 (58.0) | |
| Age, y | 0.000 | ||||
| 65-69 | 35 (71.4) | 165 (68.2) | 51 (76.1) | 409 (49.9) | |
| 70-74 | 9 (18.4) | 52 (21.5) | 10 (14.9) | 274 (33.4) | |
| ≥75 | 5 (10.2) | 25 (14.5) | 6 (9.0) | 137 (16.7) | |
| Education | 0.000 | ||||
| Elementary or less | 17 (34.7) | 128 (53.1) | 44 (65.7) | 611 (74.5) | |
| Middle school | 7 (14.3) | 38 (15.8) | 10 (14.9) | 84 (10.2) | |
| High school or above | 25 (51.0) | 75 (31.1) | 13 (19.4) | 125 (15.2) | |
| Income | 0.192 | ||||
| Low | 22 (44.9) | 102 (42.1) | 31 (46.3) | 409 (49.9) | |
| High | 27 (55.1) | 140 (57.9) | 36 (53.7) | 411 (50.1) | |
| Marriage | 0.008 | ||||
| Married | 40 (81.6) | 195 (80.6) | 50 (74.6) | 577 (70.4) | |
| Single | 9 (18.4) | 47 (19.4) | 17 (25.4) | 243 (29.6) | |
| Region | 0.036 | ||||
| Urban | 37 (75.5) | 177 (73.1) | 41 (61.2) | 531 (64.8) | |
| Rural | 12 (24.5) | 65 (26.9) | 26 (38.8) | 289 (35.2) | |
| BMI | 0.064 | ||||
| Underweight | 0 (0.0) | 5 (2.1) | 1 (1.5) | 37 (4.9) | |
| Normal | 22 (44.9) | 94 (40.3) | 26 (39.4) | 350 (46.1) | |
| Overweight | 15 (30.6) | 73 (31.1) | 28 (42.4) | 210 (27.6) | |
| Obesity | 12 (24.5) | 61 (26.0) | 11 (16.7) | 162 (21.3) | 0.000 |
| Number of chronic diseasesa | |||||
| 0 | 30 (61.2) | 128 (52.9) | 39 (58.2) | 267 (32.6) | |
| 1-2 | 19 (38.8) | 109 (45.0) | 28 (41.8) | 482 (58.8) | |
| ≥3 | 0 (0.0) | 5 (2.1) | 0 (0.0) | 71 (8.7) | 0.001 |
| Diagnosis of chronic diseases after 2006b | |||||
| No | 29 (59.2) | 77 (31.8) | 32 (47.8) | 320 (39.0) | |
| Yes | 20 (40.8) | 165 (68.2) | 35 (52.2) | 500 (61.0) |
Values are presented as weighted percent (%).
P-value was calculated by chi-square test.
Abbreviations: BMI, body mass index; NSA, non-successful aging; SA, successful aging.
Table 2.
3. The relationship between SA transition with self-rated health and life satisfaction
Table 3.
| Unadjusted model | Adjusted model | |
|---|---|---|
| Positive self-rated health | ||
| SA transition | ||
| SA→SA | 7.53 (2.95-19.17)a | 4.30 (1.64-11.31)a |
| SA→NSA | 2.10 (1.54-2.87)a | 1.79 (1.28-2.50)a |
| NSA→SA | 4.88 (2.46-9.68)a | 3.92 (1.94-7.95)a |
| NSA→NSA | Reference | Reference |
| High life satisfaction | ||
| SA transition | ||
| SA→SA | 2.64 (1.30-5.36)a | 2.42 (1.19-4.94)a |
| SA→NSA | 1.37 (1.01-1.85)a | 1.28 (0.94-1.74) |
| NSA→SA | 2.56 (1.40-4.69)a | 2.50 (1.36-4.59)a |
| NSA→NSA | Reference | Reference |
Values are presented as odds ratio (95% confidence interval).
Self-rated health and life satisfaction were measured at 2018. The odds ratio with their 95% confidence intervals were estimated by logistic regression. In adjusted model, sex, age, education, marriage, region, number of chronic diseases, diagnosis of chronic diseases after 2006, alcohol drinking, and regular exercise were adjusted.
Abbreviations: NSA, non-successful aging; SA, successful aging.
Table 4.
| Positive self-rated health | High life satisfaction | |
|---|---|---|
| Absence of major illness | ||
| Yes→yes | 1.35 (0.93-1.95) | 0.94 (0.65-1.35) |
| Yes→no | 0.77 (0.51-1.16) | 0.90 (0.60-1.34) |
| No→no | Reference | Reference |
| Freedom from disability | ||
| Yes→yes | 5.50 (1.90-15.90)a | 2.62 (1.12-6.15)a |
| Yes→no | 1.56 (0.51-4.75) | 1.23 (0.52-3.19) |
| No→yes | 4.53 (1.41-14.49)a | 3.25 (1.21-8.71)a |
| No→no | Reference | Reference |
| No depressive symptoms | ||
| Yes→yes | 6.83 (2.22-21.04)a | 5.40 (2.07-14.07)a |
| Yes→no | 1.73 (0.53-5.59) | 0.93 (0.34-2.56) |
| No→yes | 4.04 (1.19-13.69)a | 2.78 (0.97-8.00) |
| No→no | Reference | Reference |
| Active social engagement | ||
| Yes→yes | 2.60 (1.81-3.74)a | 1.91 (1.35-2.68)a |
| Yes→no | 0.95 (0.64-1.43) | 1.32 (0.89-1.94) |
| No→yes | 2.46 (1.60-3.77)a | 1.29 (0.86-1.92) |
| No→no | Reference | Reference |
| Maintenance of cognitive function | ||
| Yes→yes | 3.07 (2.14-4.40)a | 2.63 (1.90-3.62)a |
| Yes→no | 1.65 (1.16-2.34)a | 1.19 (0.85-1.66) |
| No→yes | 3.07 (1.82-5.17)a | 3.14 (1.86-5.30)a |
| No→no | Reference | Reference |
| Maintenance of physical function | ||
| Yes→yes | 1.76 (1.23-2.52)a | 1.44 (1.02-2.02)a |
| Yes→no | 1.32 (0.97-1.80) | 0.94 (0.70-1.26) |
| No→yes | 1.90 (1.22-2.95)a | 1.43 (0.94-2.20) |
| No→no | Reference | Reference |
Values are presented as odds ratio (95% confidence interval).
Self-rated health and life satisfaction were measured at 2018. The odds ratio with their 95% confidence intervals were estimated by logistic regression. In adjusted model, sex, age, education, marriage, region, number of chronic diseases, diagnosis of chronic diseases after 2006, alcohol drinking, and regular exercise were adjusted.


 PDF
PDF Citation
 Print
Print


 XML Download