

 PDF
PDF Citation
 Print
Print


INTRODUCTION
The stress response has been shaped by natural selection to increase the ability of organisms to cope with situations that require action or defense. Stress is part of our lives as humans. Stress occurs when there is a divergence between our needs and our ability to meet them.1 Whether stress is beneficial or harmful would depend on the timing, duration, and degree of stress, as well as individual ability to cope. Intrauterine growth restriction (IUGR) may be a sign of fetal stress that is associated with increased perinatal and neonatal morbidity and mortality in preterm and term neonates.23 However, it would also be dependent on the type, onset, duration, and severity of fetal stress. Fetal stress occurs due to maternal or placental problems as well as the fetus itself during fetal development. It is well established that prenatal stress is associated with low birthweight.4
During the fetal period, maternal and nutritional stress may alter fetal glucocorticoid exposure. Some studies showed that when the availability of nutrients to the fetus is restricted, catabolic hormone, like cortisol, levels are elevated.5678 Cortisol is well known as the main stress hormone. Although, glucocorticoids are crucial for normal growth and development, appropriately balanced fetal glucocorticoid exposure is required. Overexposure to glucocorticoids is linked with fetal growth restriction9 and increased risk of adult diseases of fetal origin later in life by life-long activation of the hypothalamic pituitary adrenal axis.510
IUGR and fetal growth restriction are used interchangeably as both refer to a diagnosis of growth restriction prior to delivery. In addition, both IUGR and fetal growth restriction are often used interchangeably with small for gestational age (SGA), usually defined as birthweight less than 10th percentile or − 2 standard deviation for the gestational age (GA).11 However, IUGR is not equivalent to SGA, therefore, IUGR does not necessarily result in SGA.
Birthweight alone without information of body proportion is an insufficient indicator of fetal growth. Even though most authors define IUGR as being equal to SGA, low birthweight by itself is insufficient to characterize growth restriction.12 Ponderal index (PI) as a ratio of body weight to length has been used for assessing fetal growth. In infants with IUGR, the deposition of adipose tissue and muscle bulk is decreased leading to a reduction in PI.13 The addition of birth length to birthweight allows differentiation between underweight and long babies (low PI) and overweight and short babies (high PI [HPI]). Underweight, stunted growth, and small trunk reflect differing fetal adaptations to undernutrition, hypoxia, and other factors. PI is regarded as a better measure of IUGR and complication-related factors than SGA.141516 Several definitions and terminology have been used in the literature to define IUGR, we defined IUGR as PI less than the 10th percentile in the fetus or at birth.171819 Severe wasting is defined as PI less than the 3rd percentile.20
Extremely premature infants usually have high mortality and morbidity rates because of the extremely underdeveloped organs. Thus, routine antenatal corticosteroid therapy for promoting fetal maturation is critical in cases at risk of preterm birth. Glucocorticoids are a two-edged sword for the fetus; they promote maturation of organs required for extrauterine survival while they can exert deleterious effects on fetal growth and postnatal development.21 Undernutrition leads to a fall in the concentrations of hormones that control fetal growth, it also leads to a rise in cortisol, whose main effects are on cell differentiation.22 And there is a study showing that cortisol level increases during fetal stress.23 So we speculated that the effects of fetal IUGR, as fetal stress, on neonatal mortality and morbidity would be different depending on the severity of IUGR, and that mild IUGR would show better neonatal outcomes in extremely premature infants like antenatal steroid effects.
We hypothesized that extremely premature infants with mildly-low PI (MPI), as mild IUGR, would have lower mortality and morbidity rates than not only those with severely-low PI (SPI) and HPI, but even those with adequate PI (API).
METHODS
This study was a prospective cohort study using web-based data of approximately 100 preformatted variables per patient from the Korean Neonatal Network (KNN; http://www.knn.or.kr/index.jsp), a nationwide registry system of very low birth weight infants (VLBWIs) weighing less than 1,500 g at birth admitted to 60 neonatal intensive care units (NICUs) in Korea (http://icreat.nih.go.kr). The system contains an automatic query and site visit data monitoring and management team accompanied by a biostatistician.24
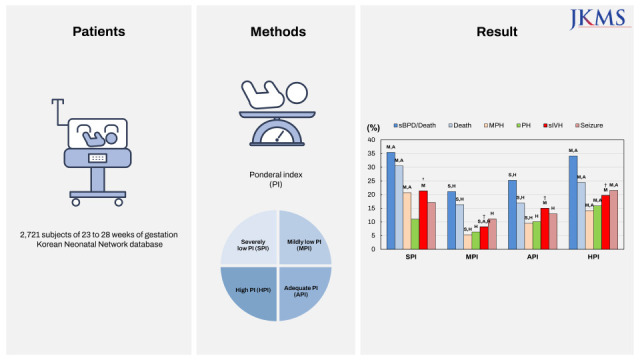
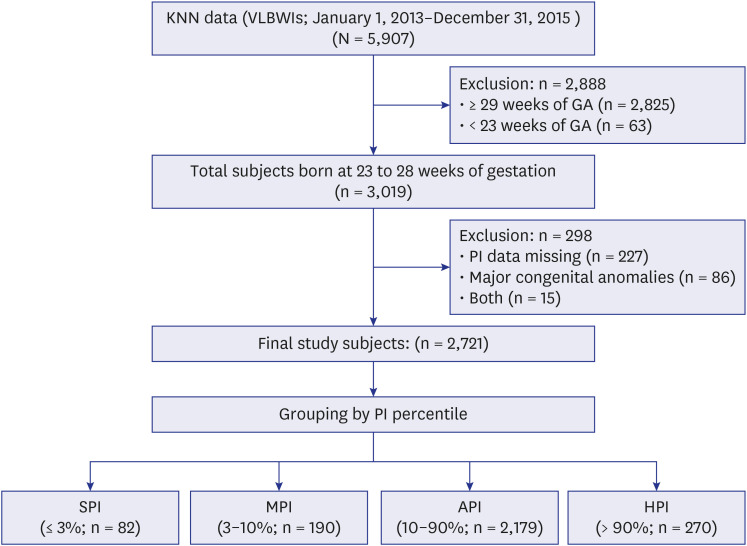
There were 5,907 VLBWIs from January 1, 2013 to December 31, 2015. We selected 3,019 VLBWIs born at 23–28 weeks of gestation. We excluded 86 cases with major congenital anomalies and 227 cases with missing birth length data. There were 15 cases with both major congenital anomalies and missing birth length data. Data on 2,721 of 3,019 subjects were used for the final analyses (90.1%, Fig. 1).
Fig. 1
Study subjects. The proportion of finally enrolled subjects (n = 2,721) among 3,019 subjects between 23 and 28 weeks of gestation was 90.1%.
KNN = Korean Neonatal Network, VLBWI = very low birthweight infant, GA = gestational age, SPI = severely-low ponderal index, MPI = mildly-low ponderal index, API = adequate ponderal index, HPI = high ponderal index.
Groups
PI was calculated using the formula birthweight (g) × 100/{birth length (cm)}3 in all the study subjects.25 PI of less than 10 percentile reflects fetal malnutrition; PI of less than 3 percentile indicates severe fetal wasting.20 We divided into four groups based on PI percentile: PI ≤ 3rd as SPI, 3rd < PI ≤ 10th as MPI, 10th < PI ≤ 90th as API, and PI > 90th as HPI. API was considered as normal growth, MPI as mild IUGR, SPI as severe IUGR, and HPI as overweight (Fig. 1).
Variables
Primary outcomes were mortality and morbidities, such as respiratory distress syndrome (RDS); massive pulmonary hemorrhage (MPH) with cardiorespiratory collapse or acute respiratory failure; pulmonary hypertension (PH) requiring medical treatment such as nitric oxide, sildenafil, iloprost, or bosentan; patent ductus arteriosus requiring ligation; hypotension requiring inotropic treatment such as dopamine, dobutamine or epinephrine; severe intraventricular hemorrhage (IVH) ≥ grade 326; cystic periventricular leukomalacia; neonatal seizure requiring anticonvulsants; necrotizing enterocolitis (NEC) ≥ stage 227; retinopathy of prematurity ≥ stage 328 or requiring operation; idiopathic gastrointestinal perforation; severe bronchopulmonary dysplasia (BPD) with ≥ 30% of FiO2 at postmenstrual age of 36 weeks29; and failed hearing screening. The mortality was defined as death on discharge from NICU.
Maternal and neonatal demographic and clinical characteristics, such as marital status, parity, multiple gestation, maternal diabetes, maternal hypertension, assisted reproductive therapy, antenatal steroid therapy, histologic chorioamnionitis, and prolonged rupture of membrane, were analyzed. In addition, GA, sex, birthweight, height, head circumference, SGA, appropriate for gestational age (AGA), large for gestational age (LGA), neonatal resuscitation with chest compression or epinephrine therapy at birth, 1- and 5-minute Apgar scores ≤ 3, pH < 7.10 within 1 hour of life, and initial hypothermia ≤ 35.5°C within 1 hour of life were included. SGA, AGA, and LGA were defined as less than the 10th percentile, 10th to 90th percentile, and more than the 90th percentile of birthweight according to GA and sex based on the Korean neonatal growth chart.30
Statistical analyses
Pearson correlation analysis was used to test the correlation between PI and GA from 23 to 28 weeks. Chi-square test and analysis of variance with Bonferroni test were used for comparisons of demographic and clinical characteristics, mortality, and morbidities among the 4 PI groups. P < 0.05 was considered significant for all the statistical analyses. The statistical analyses were performed using SPSS, version 24.0 (IBM, Armonk, NY, USA).
Ethics statement
This study was approved by the Institutional Review Board at a Hanyang University Guri Hospital (2014-01-013). The KNN registry was approved by the Samsung Medical Center Institutional Review Board (2013-03-002) and the Institutional Review Boards of all 70 hospitals participating in the KNN. Written consent was obtained from the parents of the infants during enrollment in the KNN. All protocols and methods in this study were carried out in accordance to Declaration of Helsinki.
RESULTS
Study population
Data from 2,721 of 3,019 subjects (90.1%) between 23 to 28 weeks of gestation were selected for the final analyses among the total 5,907 VLBWIs (Fig. 1). They were divided into four groups based on PI percentile: PI ≤ 3rd as SPI (n = 82), 3rd < PI ≤ 10th as MPI (n = 190), 10th < PI ≤ 90th as API (n = 2,179), and PI > 90th as HPI (n = 270) (Fig. 1).
Among the 2,721 subjects, 1,290 (47%) were female and 1,431 (53%) were male. The mean GA was 26.7 ± 1.5 weeks; birthweight, 928 ± 234 g; birth length, 34.5 ± 3.2 cm; and head circumference 24.3 ± 2.1 cm. Among all subjects, AGA was 80.7% (n = 2,195); SGA, 11.5% (n = 313); and LGA, 7.8% (n = 213).
PI distribution
The mean PI value was 2.25 ± 0.41 (0.86–7.50). The cut-off of PI percentile of 3rd, 10th, and 90th was 1.71, 1.89, and 2.62, respectively. There was no correlation between PI and GA from 23 to 28 weeks (r = 0.009, P = 0.626). The sample numbers of SPI, MPI, API, and HPI groups were 82, 190, 2,179, and 270, respectively. In terms of sex, PI was higher in boys than in girls (2.27 ± 0.46 vs. 2.22 ± 0.34; P = 0.003), but no difference was noted in GA (26.7 ± 1.6 vs. 26.7 ± 1.5; P = 0.563).
Maternal and obstetric characteristics
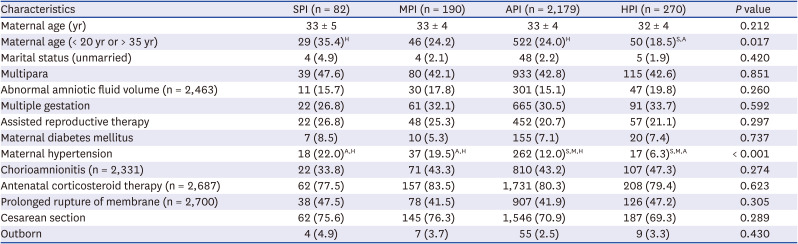
Table 1 shows maternal and obstetric characteristics among the 4 PI groups. The rate of high-risk age of mothers (< 20 years or > 35 years) in the HPI group was significantly lower than that in the SPI and API groups (P = 0.017). The rate of maternal hypertension was significantly higher in the SPI and MPI groups than in the API and HPI groups and that in the API group was higher than that in the HPI group (P < 0.001).
Table 1
Maternal and obstetric characteristics
Neonatal demographic findings
Table 2 shows neonatal demographic findings. The mean GA in the SPI group was 26.2 ± 1.5 weeks, which was lower than that in the other groups (P = 0.030). The HPI group had significantly more male neonates than did the SPI and API groups (P = 0.017). The PI and birthweight of all groups were significantly different (both PI and birthweight, P < 0.001), and an increase was seen from the SPI to the HPI group. The length in the HPI group was significantly shorter than that in all other groups and that in SPI and MPI groups was significantly longer than that in the API and HPI groups (P < 0.001). The head circumference in the SPI group was significantly smaller than that in the other groups (P = 0.002). The incidence of SGA was significantly different among all groups (P < 0.001); it decreased from the SPI to the HPI group. The incidence of 1-minute Apgar score ≤ 3 was significantly higher in the SPI group than in the MPI and API groups (P = 0.025). The incidences of 5-minute Apgar score ≤ 3, initial pH < 7.10, and neonatal resuscitation at birth were significantly higher in the SPI group than in the other groups (P = 0.001, P = 0.003, and P < 0.001, respectively).
Table 2
Neonatal demographic findings
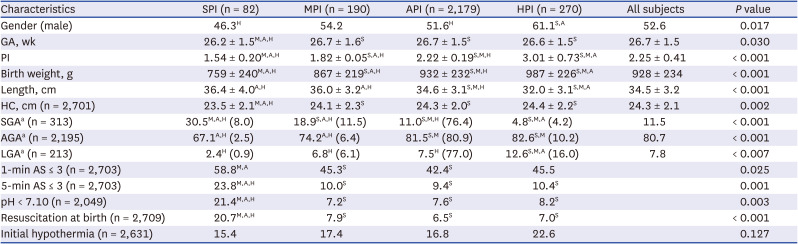
Values are presented as mean ± standard deviation or number (percentage in each SGA, AGA and LGA groups, respectively).
AGA = appropriate for gestational age, API = adequate ponderal index, AS = Apgar score, GA = gestational age, HC = head circumference, HPI = high ponderal index, LGA = large for gestational age, MPI = mildly-low ponderal index, SGA = small for gestational age, SPI = severely-low ponderal index, PI = ponderal index.
The alphabets in superscript are expressed in P < 0.05; S, vs. SPI; M, vs. MPI; A, vs. API; H, vs. HPI.
aBased on Korean Statistical Information Service (2008–2012; Singleton, n = 2,249,804).31
Neonatal outcomes: mortality and morbidities
Table 3 shows neonatal outcomes. The total mortality was 18.0%; The mortality in MPI and API groups was comparable (16.3% vs. 16.9%). It was significantly lower than that in the SPI and HPI groups (30.5% and 24.9%, respectively; P = 0.001).
Table 3
Neonatal outcomes: mortality & morbidities
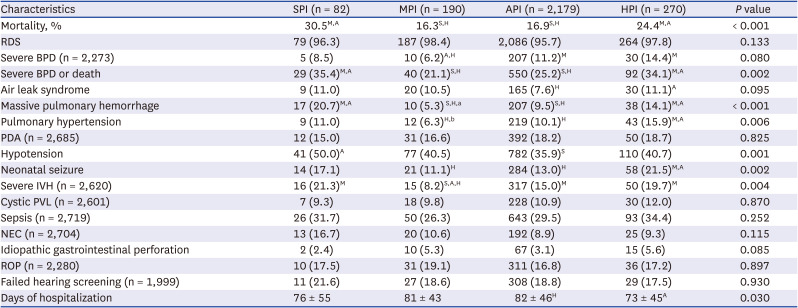
Values are presented as number (%) or mean ± standard deviation.
API = adequate ponderal index, BPD = bronchopulmonary dysplasia, HPI = high ponderal index, IVH = intraventricular hemorrhage, MPI = mildly-low ponderal index, NEC = necrotizing enterocolitis, PDA = patent ductus arteriosus, PVL = periventricular leukomalacia, RDS = respiratory distress syndrome, ROP = retinopathy of prematurity, SPI = severely-low ponderal index.
The alphabets in superscript are expressed in P < 0.05; S, vs. SPI; M, vs. MPI; A, vs. API; H, vs. HPI.
aP = 0.052 vs. API; bP = 0.096 vs. API.
The incidences of severe BPD or death and MPH in the MPI and API groups were significantly lower than those in the SPI and HPI groups (P = 0.002, and P < 0.001, respectively). The incidence of PH and neonatal seizure in the MPI and API groups was significantly lower than that in the HPI group (P = 0.006, and P = 0.002, respectively). The incidence of hypotension in API group had lower than that in the SPI group (P = 0.006). Hospitalization days in HPI group were shorter than that in the API group (P = 0.030). Furthermore, the incidence of severe IVH in the MPI group (8.2%) was lower than all the other groups (SPI, 21.3%; API, 15.0%; HPI, 19.7%, respectively; P = 0.004). The MPI group tended to have lower incidence of severe BPD than the API and HPI groups (P = 0.080).
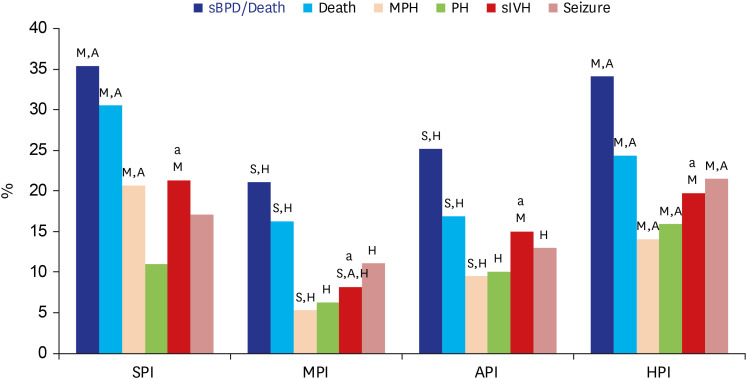
Based on the analyses of MPI and API groups only, the MPI group had higher rates of maternal hypertension (P = 0.003) and SGA (P = 0.004), lower rates of severe IVH (P = 0.012) and severe BPD (P = 0.047), and trends of decreased incidences of pulmonary hemorrhage (P = 0.052), and PH (P = 0.096) than did the API group. In general, MPI group had a trend of a bottom in mortality and morbidities, such as severe IVH, severe BPD or death, MPH, PH, neonatal seizure, and severe BPD (Fig. 2).
Fig. 2
Summary of Significant Variables for Neonatal Outcomes in the Four PI Groups.
The significant variables for neonatal outcomes among 4 PI groups were sBPD or death, Death, MPH, PH, sIVH and neonatal seizure. MPI had a trend of a bottom in mortality and morbidities.
asIVH in the MPI (8.2%) group was lower than all the other groups (SPI, 21.3%; API, 15.0%; HPI, 19.7%, respectively; P = 0.004).
The alphabets on the bars mean P < 0.05; S, vs SPI; M, vs MPI; A, vs API; H, vs HPI.
PI = ponderal index, SPI = severely-low ponderal index, MPI = mildly-low ponderal index, API = adequate ponderal index, HPI = high ponderal index, sBPD = severe bronchopulmonary dysplasia, MPH = massive pulmonary hemorrhage, PH = pulmonary hypertension, sIVH = severe intraventricular hemorrhage.
DISCUSSION
This prospective cohort study used a web-based preformatted data of around 100 variables per subject. Ninety-point one percent of all subjects between 23 and 28 weeks of GA were enrolled. This study showed that 1) the MPI and API groups had lower mortality and rates of severe BPD or death, MPH, PH, and neonatal seizure than the SPI and/or HPI groups, 2) the MPI group had lower rate of severe IVH than other groups, 3) based on the analyses of MPI and API groups only, even if the MPI group had higher rates of maternal hypertension and SGA, it had lower incidences of severe IVH and severe BPD, and tended to have lower incidences of MPH and PH than the API group. There was a report that umbilical artery and vein cortisol level increased during fetal distress.23 Our study demonstrated that MPI group as mild IUGR would result in better neonatal outcomes in extremely premature infants, similar to the effects of antenatal corticosteroid therapy for fetal maturation in preterm birth. So, our results suggest that extremely premature infants with MPI group as mild fetal stress would have accelerated cardiopulmonary and neurological maturation.
IUGR is defined as a rate of fetal growth that is less than normal for the growth potential of a specific infant as per the race and gender of the fetus.1819 Birth weight is important,31 but evaluating IUGR with birth weight alone can be misleading.32 Some SGA infants look small but balanced overall.33 In addition, cases in which the GA was overestimated can also be evaluated as an SGA. Therefore, it is more accurate to evaluate the fetal nutritional status by comparing body weight and height ratio than by weight alone.3435 If the IUGR starting from the beginning of pregnancy to full term, the birth weight and height cannot grow together and the PI can go into the normal range. However, symmetric IUGR is uncommon in this study because it is a premature infant of 23–28 weeks of age.3637
Perinatal morbidity and mortality rates show a U-shaped pattern at most gestational weeks, when the fetal size moves farther away from the optimal size.38 Mortality is very high when the low birthweight falls to a minimum within the range of the most frequent birthweight, or rises again to the heaviest birthweight.34 Therefore, we could expect that neonates with a normal range (10th–90th percentile) of PI would have lower neonatal mortality and morbidities than those with below 10th or above 90th percentile of PI. However, our study showed that even if there is a U-shaped relationship between PI and neonatal mortality and morbidities, such as severe IVH, severe BPD and death, MPH, PH, and severe BPD, the bottom of the curve tended to be at MPI group rather than API group.
In our study, mean PI value was 2.25 ± 0.41 (0.86–7.50). The cut-off of PI of 3%, 10%, and 90% was 1.71, 1.89, and 2.62, respectively. There was no significant correlation between PI and GA from 23 to 28 weeks of gestation. There were few studies about PI chart before 26 weeks, but after 30 weeks, as GA increased, PI also showed a tendency to gradually increase. PI range seems to be similar to other studies.253940
Neonatal mortality and morbidity among term infants were significantly higher at or below the 3rd percentile of weight for their GA, but there was no specific birthweight threshold for neonatal mortality or morbidity among preterm infants.31 This previous study was based on birthweight percentiles and they analyzed neonatal outcomes in preterm infants born at > 27 weeks of gestation. When we applied PI, the ratio of birthweight to birth length, among extremely premature infants born at 23 to 28 weeks of gestation, the neonatal mortality and morbidity were the worst in the SPI group defined as ≤ 3rd percentile of PI.
Term infants with PI < 3rd percentile were more frequently affected by asphyxia, hypoglycemia, hypothermia, and hyperviscosity than those with proportional growth.41 Our study in extremely premature infants showed similar findings that SPI showed higher rates of 5-minute Apgar scores ≤ 3, severe acidosis (pH < 7.10), and resuscitation at birth than the other 3 groups and higher rates of 1-minute Apgar score ≤ 3 than the MPI and API groups. An only birthweight-based study in VLBWIs showed that IUGR defined as the 10th percentile of birthweight for GA within the range of 501 to 1,500 g of birthweight was associated with increased risks of neonatal death, NEC, and RDS.42 They defined IUGR as SGA. Similar result was observed in our study wherein—SGA showed higher mortality (32.9%) than AGA (16.5%) and LGA (11.7%) (P < 0.001, data not shown).
The most significant finding of this study is that infants with MPI showed the lowest incidence of severe IVH, which was significantly lower than its incidence of SPI and HPI groups as well as that of API group. This finding could be a result of brain-sparing effect of mild IUGR, not of severe IUGR, which might be related to reduction of severe IVH due to antenatal corticosteroid therapy administered for preterm birth.43 Placental insufficiency is the principal cause of fetal growth restriction, resulting in chronic hypoxia. This hypoxia induces a fetal adaptive response of cardiac output redistribution in favor of vital organs, including the brain, heart, and adrenal glands, which is consequently brain sparing.44 There was a similar finding in a birthweight-based study showing that the AGA group had a higher incidence of peri-IVH than SGA babies in VLBWIs (36.8% vs. 18.5%, respectively).45
Regarding BPD, a preterm (< 32 weeks) study showed that IUGR-SGA defined as IUGR in utero based on antenatal ultrasound scans and SGA was a major risk factor for BPD.46 Another study on preterm (< 32 weeks) infants from KNN showed that birth length was inversely associated with an increased risk of BPD or death in VLBWIs.47 Although both studies did not investigate PI, the latter study suggested that lower PI related to higher birth length would be related to higher BPD or death. Our study found that not only SPI group with lower weight and higher length but also HPI group with heavier weight and shorter length were associated with a higher incidence of severe BPD or death than MPI and API groups.
Based on the analyses of MPI and API groups only, even if MPI group had higher rates of maternal hypertension and SGA, MPI group was related to lower incidences of severe IVH (P = 0.012) and severe BPD (P = 0.047) and a trend of lower incidences of MPH and PH compared with API group. It could be related to accelerated maturation of cardiopulmonary and neurologic systems in extremely premature infants with MPI group.
Although there was no statistical significance, it is interesting that chorioamnionitis was higher in HPI group and lower in SPI group. According to the electronic registry form we used, chorioamnionitis is defined by only histologic findings. So there was possibility to miss not only missing data but also clinical chorioamnionitis without histologic findings.
There are some limitations to this study. Firstly, we might have overlooked the possibility of impact from 227 subjects (7.5%) with missing PI among 3,019 subjects who also had no birth length data. Their reasons could be not only incidentally missing measurement of height, but also no time to measure height because of their critical and urgent conditions soon after birth. The accuracy of clinical growth measurements in this study may present a limitation. The birth weight measurements are considered reliable because body weights were measured automatically by electronic scales. But, length is more difficult to measure precisely with a tape measure. Secondly, SGA by itself might have poor neonatal outcomes regardless of PI groups. Since 80% of our study subjects were AGA, our findings could be mostly affected by AGA groups and heterogeneity of IUGR. Therefore, the postnatal beneficial effects in mild IUGR as mild fetal stress might be observed only in the AGA group rather than the SGA or LGA groups. Higher neonatal morbidity (low 1- and 5-minute Apgar scores, aspiration syndrome, hypoglycemia, and perinatal asphyxia) is observed among term infants with normal birth weights but with low PI group (< 10 percentile) than the API group (25–90 percentile). These data provide further evidence of the heterogeneity of the IUGR syndrome and of the independent effect of body disproportion on neonatal morbidity, even among infants with normal birth weights.48 Thirdly, although there was no correlation between PI and GA between 23 and 28 weeks of gestation, the PI in boys was higher than that in girls. However, when we adjusted to the mortalities and morbidities with gender by logistic regression analyses, it turned out same results in the mortality and morbidities of severe IVH, severe BPD or death, pulmonary hemorrhage, and PH (data are not shown). Fourthly, to see an overview of neonatal outcomes in this study, we did not analyze perinatal and neonatal risk factors for neonatal mortality and morbidities, such as high-risk maternal age, maternal hypertension, GA, sex, SGA, 1- and 5-minute Apgar scores ≤ 3, pH < 7.10, and neonatal resuscitation at birth. Fifthly, there was limitation of the preformatted dataset of approximately 100 variables.24 We could not collect data on more confounding factors that affect PI. Finally we need further studies to see long term outcomes in the same PI groups.
In conclusion, the MPI and API groups had lower mortality, MPH, severe BPD or death, PH and neonatal seizure rates than the SPI and/or HPI groups, while the MPI group showed a lower incidence of severe IVH than the other groups. In comparisons between the API and MPI groups only, the MPI group had lower incidences of severe IVH and severe BPD and tended to associate with lower incidence of MPH and PH. Therefore, the MPI group has a trend of a bottom in neonatal mortality and morbidities in extremely premature infants. We speculate that MPI indicating mild intrauterine stress might increase cortisol exposure to the fetus23 and thus accelerate fetal neurological and cardiopulmonary maturation resulting in better neonatal outcomes in extremely premature infants.
 XML Download