Journal List > J Korean Med Sci > v.37(24) > 1516078842

Kim, Ahn, Kim, Chae, Jeong, Uh, Kim, Kim, Park, Park, and Choi: Development of the Korean Standardized Antimicrobial Administration Ratio as a Tool for Benchmarking Antimicrobial Use in Each Hospital

Abstract

Background

The Korea National Antimicrobial Use Analysis System (KONAS), a benchmarking system for antimicrobial use in hospitals, provides Korean Standardized Antimicrobial Administration Ratio (K-SAAR) for benchmarking. This article describes K-SAAR predictive models to enhance the understanding of K-SAAR, an important benchmarking strategy for antimicrobial usage in KONAS.

Methods

We obtained medical insurance claims data for all hospitalized patients aged ≥ 28 days in all secondary and tertiary care hospitals in South Korea (n = 347) from January 2019 to December 2019 from the Health Insurance Review & Assessment Service. Modeling was performed to derive a prediction value for antimicrobial use in each institution, which corresponded to the denominator value for calculating K-SAAR. The prediction values of antimicrobial use were modeled separately for each category, for all inpatients and adult patients (aged ≥ 15 years), using stepwise negative binomial regression.

Results

The final models for each antimicrobial category were adjusted for different significant risk factors. In the K-SAAR models of all aged patients as well as adult patients, most antimicrobial categories included the number of hospital beds and the number of operations as significant factors, while some antimicrobial categories included mean age for inpatients, hospital type, and the number of patients transferred from other hospitals as significant factors.

Conclusion

We developed a model to predict antimicrobial use rates in Korean hospitals, and the model was used as the denominator of the K-SAAR.

Graphical Abstract

jkms-37-e191-abf001.jpg

INTRODUCTION

Measuring antimicrobial use and feedback is a core element of the antimicrobial stewardship program (ASP), a multidisciplinary activity for inducing proper antimicrobial use and reducing misuse or overuse of antimicrobials.1 Therefore, it was included as a key component of the Korean National Action Plan on Antimicrobial Resistance from 2016 to 2020.2
To properly evaluate antimicrobial use in hospitals and set goals for improvement, a benchmarking strategy is necessary. In addition to the direct comparison of antimicrobial use among hospitals, the Centers for Disease Control and Prevention in the US adopted a Standardized Antimicrobial Administration Ratio (SAAR) as a novel benchmarking strategy and provides it via National Healthcare Safety Network.34 SAAR is calculated by dividing antimicrobial use by predicted antimicrobial use in a hospital; > 1 indicates that the amount of antimicrobial use is greater than the predicted value, and < 1 indicates that the antimicrobial use is less than the predicted value.4 The value of predicted antimicrobial use reflects the characteristics of each hospital that might influence antimicrobial usage patterns; therefore, it differs among hospitals.4
In 2021, the Korean Society of Infectious Diseases developed a benchmarking system for antimicrobial use in hospitals—the Korea National Antimicrobial Use Analysis System (KONAS)—in collaboration with the Korean Society for Antimicrobial Therapy, Health Insurance Review & Assessment Service (HIRA), and EvidNet. KONAS provides not only in-depth analysis results of antimicrobial use within each hospital, but also the antimicrobial use of other hospitals or Korean SAAR (K-SAAR) for benchmarking. Through this system, each medical institution can identify its antibiotic usage and patterns, which could help hospitals perform ASP. This article describes K-SAAR predictive models to enhance the understanding of K-SAAR, an important benchmarking strategy for antimicrobial usage in KONAS.

METHODS

Data source

We obtained medical insurance claims data for all hospitalized patients aged ≥ 28 days in all secondary and tertiary care hospitals in South Korea (n = 347) from January 2019 to December 2019 from the HIRA. The data included patients’ age and sex, hospital codes, hospitalization start date, length of hospitalization, diagnosis codes, medical departments in charge, medical costs, intensive care unit utilization during hospitalization, surgery and procedure codes, and prescription medication codes. The discharge diagnoses were coded according to the International Classification of Diseases, Tenth Revision.
A database was constructed to calculate the number of patient-days. We regarded different claims data as the same inpatient episode if all of the following three conditions were satisfied: 1) same recipient, 2) same hospital, and 3) the interval was less than 2 days between the final date of one claims data and the first date of another claims data.

Definitions

Antibiotics and antifungals were defined as medications with Anatomical Therapeutic Chemical (ATC) classes J01 and J02, respectively, and did not include antituberculous agents or antiviral agents. Systemic agents administered via oral or parenteral routes were included, whereas topical agents were excluded. We adopted the classification of antibiotics as previously developed and added some categories after discussion within the research group.5 Accordingly, the antimicrobial categories for the K-SAAR model were determined as follows: 1) broad-spectrum antibacterial agents predominantly used for hospital-onset infections (including amikacin, cefepime, meropenem, and piperacillin/tazobactam), 2) broad-spectrum antibacterial agents predominantly used for community-acquired infections (including ceftriaxone, ertapenem, ciprofloxacin), 3) antibacterial agents predominantly used for resistant gram-positive bacterial infections (including linezolid, parenteral vancomycin), 4) narrow-spectrum beta-lactam agents (including amoxicillin/clavulanate, nafcillin, cefazolin, cefuroxime), 5) antifungal agents predominantly used for invasive candidiasis (including fluconazole, caspofungin), 6) antibacterial agents predominantly used for extensive antibiotic-resistant gram-negative bacterial infections (including colistin, tigecycline, ceftolozane/tazobactam), 7) carbapenem, 8) fluoroquinolone, 9) metronidazole, and 10) total antibacterial agents (Supplementary Table 1). Some antimicrobials belong to two or more categories. The consumption of each category of antibiotics or antifungals was converted to a defined daily dose (DDD) following the ATC classification system of the World Health Organization6 and then standardized per 1,000 patient-days.
Operations were defined as surgical procedures that were included in the ninth nationwide evaluation of the appropriateness of surgical prophylactic antibiotics in Korean hospitals in 2020, led by the HIRA.7

Predictive modeling for K-SAAR

Modeling was performed to derive a prediction value for antimicrobial use in each institution, which corresponded to the denominator value for calculating K-SAAR. The prediction values of antimicrobial use were modeled separately for each category, for all inpatients and adult patients (aged ≥ 15 years), using stepwise negative binomial regression. The association between annual antimicrobial consumption in each category and factors that were thought to potentially explain the differences in antimicrobial consumption among hospitals was assessed. The independent factors that can influence antimicrobial consumption in the hospital were selected through discussion with the research group. Because an objective of providing K-SAAR is to improve antimicrobial use in each hospital, the factors that could be associated with the characteristics of patients or hospitals were included and those about workforces (e.g., number of infectious diseases specialists) and/or policies (e.g., ASP) were excluded. To obtain enough sample size with standardized data, variables that were available from the medical insurance claims data were finally included; information such as antimicrobial resistance pathogens and the existence of a resident training system was not included. The selected independent factors were as follows: 1) hospital type (tertiary care hospital vs. secondary care hospital), 2) location type (general ward vs. intensive care unit), 3) mean age of inpatients, 4) number of hospital beds, 5) number of operations per year, 6) number of general anesthesia procedures per year, 7) number of patients with malignancy per year, and 8) number of patients transferred from other hospitals per year. Continuous variables were categorized according to a previously reported method.8
All analyses were conducted using the SAS software (version 9.4; SAS Institute Inc., Cary, NC, USA).

Ethics statement

The study protocol was approved by the Institutional Review Board (IRB) of Yonsei University Health System Clinical Trial Center (IRB No. 4-2019-1297). The requirement for written informed consent from patients was waived.

RESULTS

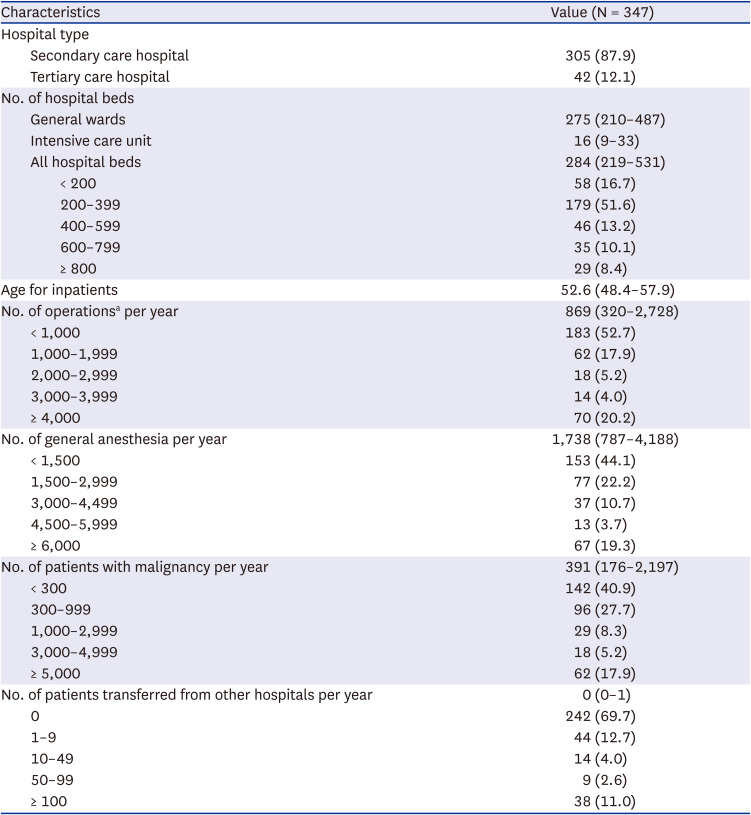
K-SAAR models were constructed using medical insurance claims data in 2019 from all secondary and tertiary care hospitals with 347 general wards and 298 intensive care units. The variables for the K-SAAR modeling are summarized in Table 1 and Supplementary Table 2.
Table 1

Characteristics of hospitals and their inpatients included as data sources for Korean Standardized Antimicrobial Administration Ratio predictive modeling

jkms-37-e191-i001
Characteristics Value (N = 347)
Hospital type
Secondary care hospital 305 (87.9)
Tertiary care hospital 42 (12.1)
No. of hospital beds
General wards 275 (210–487)
Intensive care unit 16 (9–33)
All hospital beds 284 (219–531)
< 200 58 (16.7)
200–399 179 (51.6)
400–599 46 (13.2)
600–799 35 (10.1)
≥ 800 29 (8.4)
Age for inpatients 52.6 (48.4–57.9)
No. of operationsa per year 869 (320–2,728)
< 1,000 183 (52.7)
1,000–1,999 62 (17.9)
2,000–2,999 18 (5.2)
3,000–3,999 14 (4.0)
≥ 4,000 70 (20.2)
No. of general anesthesia per year 1,738 (787–4,188)
< 1,500 153 (44.1)
1,500–2,999 77 (22.2)
3,000–4,499 37 (10.7)
4,500–5,999 13 (3.7)
≥ 6,000 67 (19.3)
No. of patients with malignancy per year 391 (176–2,197)
< 300 142 (40.9)
300–999 96 (27.7)
1,000–2,999 29 (8.3)
3,000–4,999 18 (5.2)
≥ 5,000 62 (17.9)
No. of patients transferred from other hospitals per year 0 (0–1)
0 242 (69.7)
1–9 44 (12.7)
10–49 14 (4.0)
50–99 9 (2.6)
≥ 100 38 (11.0)
Values are presented as number (%) or median (interquartile range).
aOperations included in ‘The ninth nationwide evaluation of the appropriateness of surgical prophylactic antibiotics in Korean hospitals in 2020.’
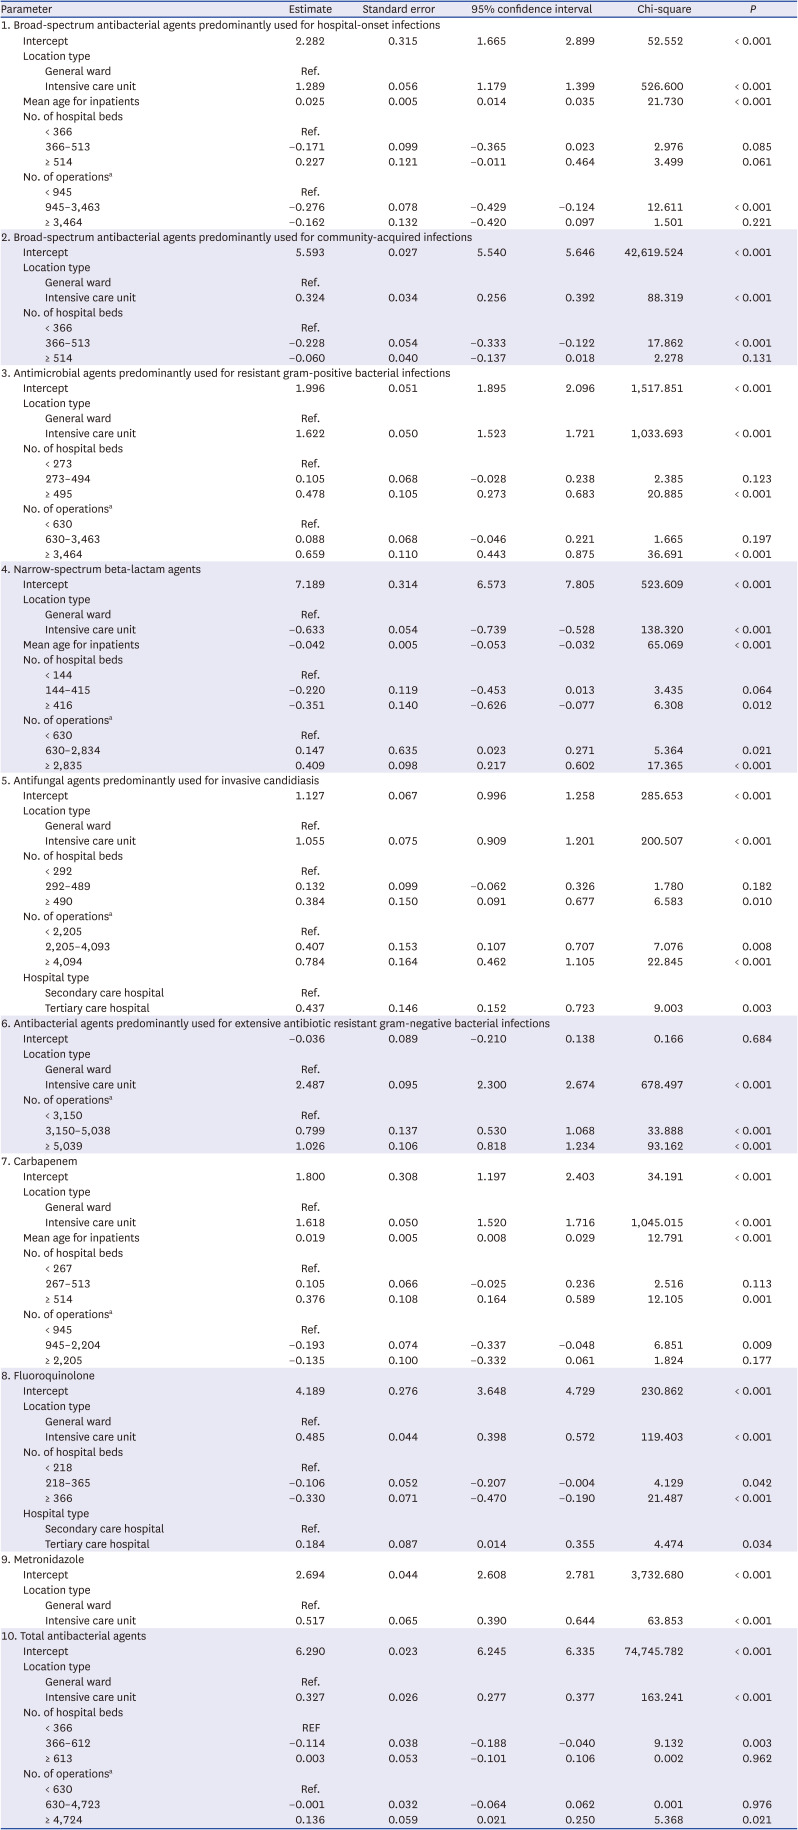
The models estimated the predicted antimicrobial consumption for a given location (total vs. general ward vs. intensive care unit) and antimicrobial categories. Non-significant factors were not included in the final models, and the final models for each antimicrobial category were adjusted for different significant risk factors. In the K-SAAR models of all aged patients as well as adult patients, most antimicrobial categories included the number of hospital beds and the number of operations as significant factors, while some antimicrobial categories included mean age for inpatients, hospital type, and the number of patients transferred from other hospitals as significant factors. For instance, the statistically significant factors for the model about ‘total antibacterial agents’ for all hospitalized patients (aged ≥ 28 days) were intensive care unit (parameter estimate, 0.306; 95% confidence interval [CI], 0.256, 0.357), mean age of inpatients (parameter estimate, −0.005; 95% CI, −0.008, −0.002), 366–612 hospital beds (parameter estimate, −0.100; 95% CI, −0.166, −0.035), and ≥ 613 hospital beds (parameter estimate, 0.082; 95% CI, 0.016, 0.147). The statistically significant factors for the model about ‘broad-spectrum antibacterial agents predominantly used for hospital-onset infection’ for adult patients (≥ 15 years) were intensive care unit (parameter estimate, 1.289; 95% CI, 1.179, 1.399), mean age of inpatients (parameter estimate, 0.025; 95% CI, 0.014, 0.035), and 945–3,463 operations per year (parameter estimate, −0.276; 95% CI, −0.429, −0.124). Detailed risk model parameter estimates are presented in Tables 2 and 3. The K-SAAR values for each hospital are shown in Supplementary Table 2.
Table 2

Korean standardized antimicrobial administration ratio risk model parameter estimates for all patients
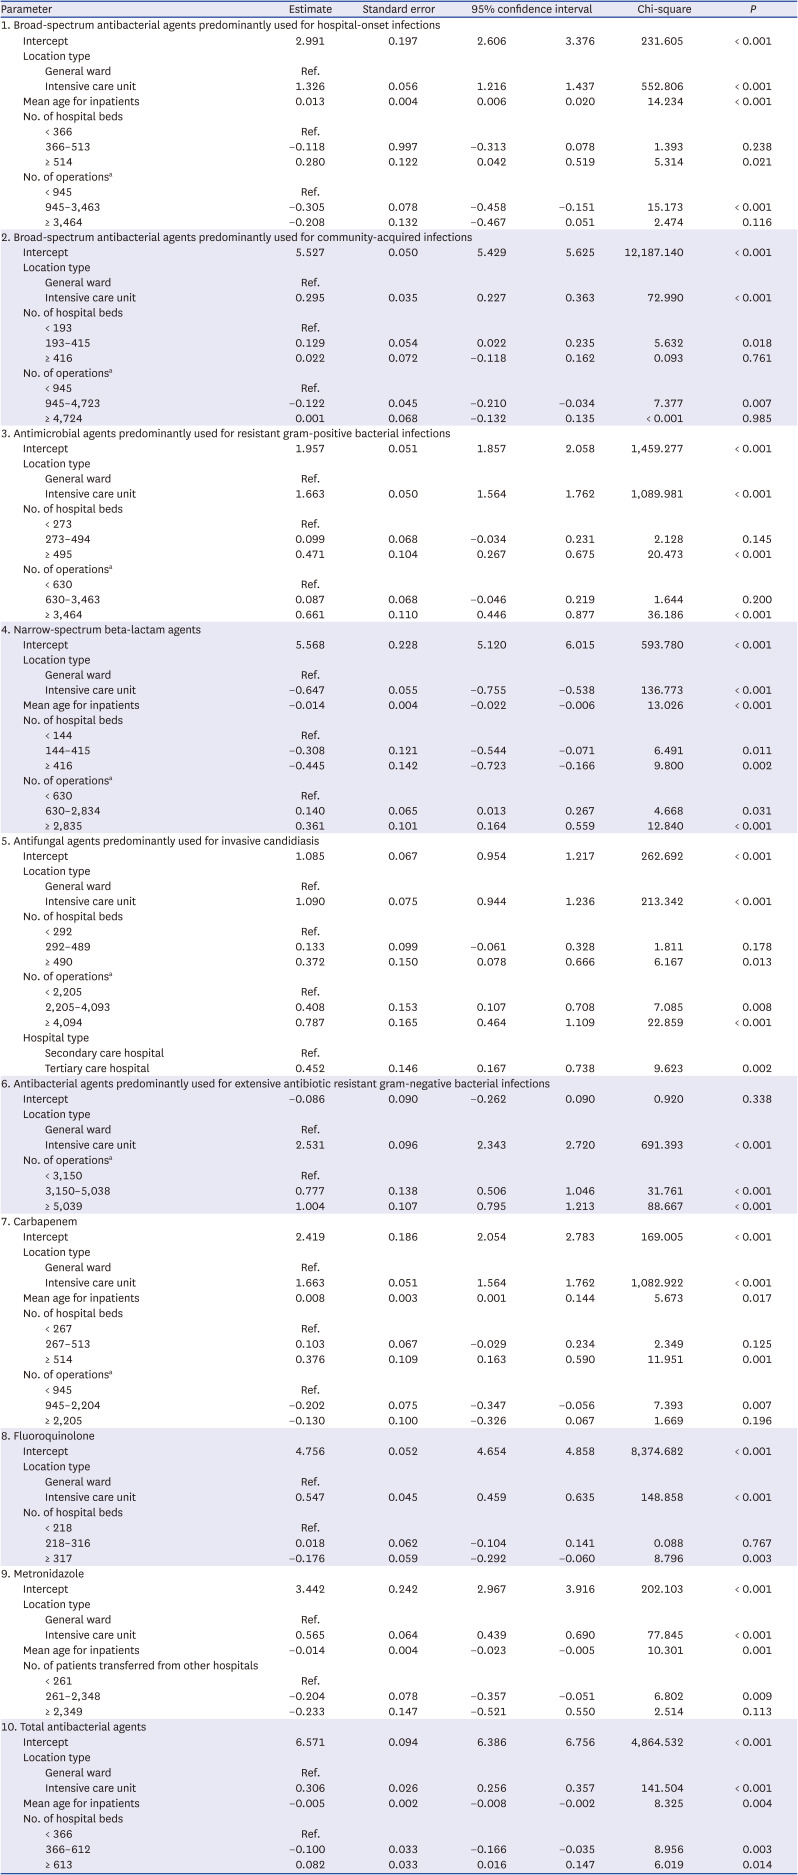
jkms-37-e191-i002
Parameter Estimate Standard error 95% confidence interval Chi-square P
1. Broad-spectrum antibacterial agents predominantly used for hospital-onset infections
Intercept 2.991 0.197 2.606 3.376 231.605 < 0.001
Location type
General ward Ref.
Intensive care unit 1.326 0.056 1.216 1.437 552.806 < 0.001
Mean age for inpatients 0.013 0.004 0.006 0.020 14.234 < 0.001
No. of hospital beds
< 366 Ref.
366–513 −0.118 0.997 −0.313 0.078 1.393 0.238
≥ 514 0.280 0.122 0.042 0.519 5.314 0.021
No. of operationsa
< 945 Ref.
945–3,463 −0.305 0.078 −0.458 −0.151 15.173 < 0.001
≥ 3,464 −0.208 0.132 −0.467 0.051 2.474 0.116
2. Broad-spectrum antibacterial agents predominantly used for community-acquired infections
Intercept 5.527 0.050 5.429 5.625 12,187.140 < 0.001
Location type
General ward Ref.
Intensive care unit 0.295 0.035 0.227 0.363 72.990 < 0.001
No. of hospital beds
< 193 Ref.
193–415 0.129 0.054 0.022 0.235 5.632 0.018
≥ 416 0.022 0.072 −0.118 0.162 0.093 0.761
No. of operationsa
< 945 Ref.
945–4,723 −0.122 0.045 −0.210 −0.034 7.377 0.007
≥ 4,724 0.001 0.068 −0.132 0.135 < 0.001 0.985
3. Antimicrobial agents predominantly used for resistant gram-positive bacterial infections
Intercept 1.957 0.051 1.857 2.058 1,459.277 < 0.001
Location type
General ward Ref.
Intensive care unit 1.663 0.050 1.564 1.762 1,089.981 < 0.001
No. of hospital beds
< 273 Ref.
273–494 0.099 0.068 −0.034 0.231 2.128 0.145
≥ 495 0.471 0.104 0.267 0.675 20.473 < 0.001
No. of operationsa
< 630 Ref.
630–3,463 0.087 0.068 −0.046 0.219 1.644 0.200
≥ 3,464 0.661 0.110 0.446 0.877 36.186 < 0.001
4. Narrow-spectrum beta-lactam agents
Intercept 5.568 0.228 5.120 6.015 593.780 < 0.001
Location type
General ward Ref.
Intensive care unit −0.647 0.055 −0.755 −0.538 136.773 < 0.001
Mean age for inpatients −0.014 0.004 −0.022 −0.006 13.026 < 0.001
No. of hospital beds
< 144 Ref.
144–415 −0.308 0.121 −0.544 −0.071 6.491 0.011
≥ 416 −0.445 0.142 −0.723 −0.166 9.800 0.002
No. of operationsa
< 630 Ref.
630–2,834 0.140 0.065 0.013 0.267 4.668 0.031
≥ 2,835 0.361 0.101 0.164 0.559 12.840 < 0.001
5. Antifungal agents predominantly used for invasive candidiasis
Intercept 1.085 0.067 0.954 1.217 262.692 < 0.001
Location type
General ward Ref.
Intensive care unit 1.090 0.075 0.944 1.236 213.342 < 0.001
No. of hospital beds
< 292 Ref.
292–489 0.133 0.099 −0.061 0.328 1.811 0.178
≥ 490 0.372 0.150 0.078 0.666 6.167 0.013
No. of operationsa
< 2,205 Ref.
2,205–4,093 0.408 0.153 0.107 0.708 7.085 0.008
≥ 4,094 0.787 0.165 0.464 1.109 22.859 < 0.001
Hospital type
Secondary care hospital Ref.
Tertiary care hospital 0.452 0.146 0.167 0.738 9.623 0.002
6. Antibacterial agents predominantly used for extensive antibiotic resistant gram-negative bacterial infections
Intercept −0.086 0.090 −0.262 0.090 0.920 0.338
Location type
General ward Ref.
Intensive care unit 2.531 0.096 2.343 2.720 691.393 < 0.001
No. of operationsa
< 3,150 Ref.
3,150–5,038 0.777 0.138 0.506 1.046 31.761 < 0.001
≥ 5,039 1.004 0.107 0.795 1.213 88.667 < 0.001
7. Carbapenem
Intercept 2.419 0.186 2.054 2.783 169.005 < 0.001
Location type
General ward Ref.
Intensive care unit 1.663 0.051 1.564 1.762 1,082.922 < 0.001
Mean age for inpatients 0.008 0.003 0.001 0.144 5.673 0.017
No. of hospital beds
< 267 Ref.
267–513 0.103 0.067 −0.029 0.234 2.349 0.125
≥ 514 0.376 0.109 0.163 0.590 11.951 0.001
No. of operationsa
< 945 Ref.
945–2,204 −0.202 0.075 −0.347 −0.056 7.393 0.007
≥ 2,205 −0.130 0.100 −0.326 0.067 1.669 0.196
8. Fluoroquinolone
Intercept 4.756 0.052 4.654 4.858 8,374.682 < 0.001
Location type
General ward Ref.
Intensive care unit 0.547 0.045 0.459 0.635 148.858 < 0.001
No. of hospital beds
< 218 Ref.
218–316 0.018 0.062 −0.104 0.141 0.088 0.767
≥ 317 −0.176 0.059 −0.292 −0.060 8.796 0.003
9. Metronidazole
Intercept 3.442 0.242 2.967 3.916 202.103 < 0.001
Location type
General ward Ref.
Intensive care unit 0.565 0.064 0.439 0.690 77.845 < 0.001
Mean age for inpatients −0.014 0.004 −0.023 −0.005 10.301 0.001
No. of patients transferred from other hospitals
< 261 Ref.
261–2,348 −0.204 0.078 −0.357 −0.051 6.802 0.009
≥ 2,349 −0.233 0.147 −0.521 0.550 2.514 0.113
10. Total antibacterial agents
Intercept 6.571 0.094 6.386 6.756 4,864.532 < 0.001
Location type
General ward Ref.
Intensive care unit 0.306 0.026 0.256 0.357 141.504 < 0.001
Mean age for inpatients −0.005 0.002 −0.008 −0.002 8.325 0.004
No. of hospital beds
< 366 Ref.
366–612 −0.100 0.033 −0.166 −0.035 8.956 0.003
≥ 613 0.082 0.033 0.016 0.147 6.019 0.014
aOperations included in ‘The ninth nationwide evaluation of the appropriateness of surgical prophylactic antibiotics in Korean hospitals in 2020.’
Table 3

Korean standardized antimicrobial administration ratio risk model parameter estimates for adult patients

jkms-37-e191-i003
Parameter Estimate Standard error 95% confidence interval Chi-square P
1. Broad-spectrum antibacterial agents predominantly used for hospital-onset infections
Intercept 2.282 0.315 1.665 2.899 52.552 < 0.001
Location type
General ward Ref.
Intensive care unit 1.289 0.056 1.179 1.399 526.600 < 0.001
Mean age for inpatients 0.025 0.005 0.014 0.035 21.730 < 0.001
No. of hospital beds
< 366 Ref.
366–513 −0.171 0.099 −0.365 0.023 2.976 0.085
≥ 514 0.227 0.121 −0.011 0.464 3.499 0.061
No. of operationsa
< 945 Ref.
945–3,463 −0.276 0.078 −0.429 −0.124 12.611 < 0.001
≥ 3,464 −0.162 0.132 −0.420 0.097 1.501 0.221
2. Broad-spectrum antibacterial agents predominantly used for community-acquired infections
Intercept 5.593 0.027 5.540 5.646 42,619.524 < 0.001
Location type
General ward Ref.
Intensive care unit 0.324 0.034 0.256 0.392 88.319 < 0.001
No. of hospital beds
< 366 Ref.
366–513 −0.228 0.054 −0.333 −0.122 17.862 < 0.001
≥ 514 −0.060 0.040 −0.137 0.018 2.278 0.131
3. Antimicrobial agents predominantly used for resistant gram-positive bacterial infections
Intercept 1.996 0.051 1.895 2.096 1,517.851 < 0.001
Location type
General ward Ref.
Intensive care unit 1.622 0.050 1.523 1.721 1,033.693 < 0.001
No. of hospital beds
< 273 Ref.
273–494 0.105 0.068 −0.028 0.238 2.385 0.123
≥ 495 0.478 0.105 0.273 0.683 20.885 < 0.001
No. of operationsa
< 630 Ref.
630–3,463 0.088 0.068 −0.046 0.221 1.665 0.197
≥ 3,464 0.659 0.110 0.443 0.875 36.691 < 0.001
4. Narrow-spectrum beta-lactam agents
Intercept 7.189 0.314 6.573 7.805 523.609 < 0.001
Location type
General ward Ref.
Intensive care unit −0.633 0.054 −0.739 −0.528 138.320 < 0.001
Mean age for inpatients −0.042 0.005 −0.053 −0.032 65.069 < 0.001
No. of hospital beds
< 144 Ref.
144–415 −0.220 0.119 −0.453 0.013 3.435 0.064
≥ 416 −0.351 0.140 −0.626 −0.077 6.308 0.012
No. of operationsa
< 630 Ref.
630–2,834 0.147 0.635 0.023 0.271 5.364 0.021
≥ 2,835 0.409 0.098 0.217 0.602 17.365 < 0.001
5. Antifungal agents predominantly used for invasive candidiasis
Intercept 1.127 0.067 0.996 1.258 285.653 < 0.001
Location type
General ward Ref.
Intensive care unit 1.055 0.075 0.909 1.201 200.507 < 0.001
No. of hospital beds
< 292 Ref.
292–489 0.132 0.099 −0.062 0.326 1.780 0.182
≥ 490 0.384 0.150 0.091 0.677 6.583 0.010
No. of operationsa
< 2,205 Ref.
2,205–4,093 0.407 0.153 0.107 0.707 7.076 0.008
≥ 4,094 0.784 0.164 0.462 1.105 22.845 < 0.001
Hospital type
Secondary care hospital Ref.
Tertiary care hospital 0.437 0.146 0.152 0.723 9.003 0.003
6. Antibacterial agents predominantly used for extensive antibiotic resistant gram-negative bacterial infections
Intercept −0.036 0.089 −0.210 0.138 0.166 0.684
Location type
General ward Ref.
Intensive care unit 2.487 0.095 2.300 2.674 678.497 < 0.001
No. of operationsa
< 3,150 Ref.
3,150–5,038 0.799 0.137 0.530 1.068 33.888 < 0.001
≥ 5,039 1.026 0.106 0.818 1.234 93.162 < 0.001
7. Carbapenem
Intercept 1.800 0.308 1.197 2.403 34.191 < 0.001
Location type
General ward Ref.
Intensive care unit 1.618 0.050 1.520 1.716 1,045.015 < 0.001
Mean age for inpatients 0.019 0.005 0.008 0.029 12.791 < 0.001
No. of hospital beds
< 267 Ref.
267–513 0.105 0.066 −0.025 0.236 2.516 0.113
≥ 514 0.376 0.108 0.164 0.589 12.105 0.001
No. of operationsa
< 945 Ref.
945–2,204 −0.193 0.074 −0.337 −0.048 6.851 0.009
≥ 2,205 −0.135 0.100 −0.332 0.061 1.824 0.177
8. Fluoroquinolone
Intercept 4.189 0.276 3.648 4.729 230.862 < 0.001
Location type
General ward Ref.
Intensive care unit 0.485 0.044 0.398 0.572 119.403 < 0.001
No. of hospital beds
< 218 Ref.
218–365 −0.106 0.052 −0.207 −0.004 4.129 0.042
≥ 366 −0.330 0.071 −0.470 −0.190 21.487 < 0.001
Hospital type
Secondary care hospital Ref.
Tertiary care hospital 0.184 0.087 0.014 0.355 4.474 0.034
9. Metronidazole
Intercept 2.694 0.044 2.608 2.781 3,732.680 < 0.001
Location type
General ward Ref.
Intensive care unit 0.517 0.065 0.390 0.644 63.853 < 0.001
10. Total antibacterial agents
Intercept 6.290 0.023 6.245 6.335 74,745.782 < 0.001
Location type
General ward Ref.
Intensive care unit 0.327 0.026 0.277 0.377 163.241 < 0.001
No. of hospital beds
< 366 REF
366–612 −0.114 0.038 −0.188 −0.040 9.132 0.003
≥ 613 0.003 0.053 −0.101 0.106 0.002 0.962
No. of operationsa
< 630 Ref.
630–4,723 −0.001 0.032 −0.064 0.062 0.001 0.976
≥ 4,724 0.136 0.059 0.021 0.250 5.368 0.021
aOperations included in ‘The ninth nationwide evaluation of the appropriateness of surgical prophylactic antibiotics in Korean hospitals in 2020.’

DISCUSSION

KONAS is the first benchmarking system for antimicrobial use in Korean hospitals, providing not only the crude amount of antimicrobial use in each hospital for direct comparison, but also K-SAAR for indirect comparison. With K-SAAR, medical personnel can easily measure and monitor antimicrobial use in their hospitals and grasp the degree of antimicrobial use, using benchmarking data. In particular, when K-SAAR is above 1, further evaluation and possible hospital-specific interventions can be initiated.
There are several advantages of K-SAAR compared to a direct comparison of antimicrobial use among hospitals. First, the novel metric is a customized indicator that reflects the characteristics of each hospital. The predictive value of antimicrobial use in a hospital is derived from meticulous modeling using variables that are associated with hospital characteristics and might influence the pattern of antimicrobial use in a hospital. Therefore, medical personnel can detect the possible overuse or misuse of antimicrobials in their hospital more easily and precisely. Second, the overall pattern of antimicrobial use within hospitals can be identified through various K-SAAR values according to patient age group, hospital location, and antimicrobial category. For instance, if the K-SAARs for broad-spectrum antibacterial agents predominantly used for hospital-onset infections and antibacterial agents predominantly used for resistant gram-positive infections are observed above 1, and those for broad-spectrum antibacterial agents predominantly used for community-acquired infections and narrow-spectrum beta-lactam agents are observed below 1, medical personnel can suspect that certain classes of antimicrobials such as anti-pseudomonal β-lactam antibiotics or glycopeptides might be excessively prescribed within the hospital. Third, there is little risk of unintentional exposure to individual hospital information. For a direct comparison, even if the hospital names are anonymized, the source of hospital data presented for comparison can be inferred from the remaining information.
Despite these merits, medical personnel should remember that the K-SAAR metric provides a quantitative evaluation of antimicrobial use, but does not provide a definitive measure of the appropriateness or judiciousness of antimicrobial use. Therefore, K-SAAR can be used for monitoring antimicrobial use or follow-up of ASP intervention and should not be used for public reporting or other external accountability purposes.4
There are some potential limitations to the present study. First, the amount of antimicrobial consumption was measured using DDD instead of directly observed therapy (DOT). In fact, according to a recent guideline for ASP, DOT is the preferred method for the measurement of antimicrobial consumption, because DDD has the possibility of underestimation among patients with decreased renal function and pediatric patients.9 However, the DOT of antimicrobials provided by the medical insurance claims data has yet to be validated properly. If the DOT of medical insurance claims data reflects the actual data well, an update of the K-SAAR predictive model using antimicrobial consumption data measured by the DOT should be performed. Second, the current K-SAAR does not apply to pediatric patients. Given that the antimicrobial consumption data were measured by DDD, we could not develop a predictive model for pediatric patients. This problem will be solved if the DOT of medical insurance claim data is validated. Even though limitations of data regarding pediatric patients exist, the research group performed the modeling for all inpatients (aged ≥ 28 days) to enhance the understanding of overall antimicrobial consumption within the hospital at the current phase. Third, the current K-SAAR applies only to annual antimicrobial use in secondary or tertiary care hospitals. It is necessary to develop a K-SAAR predictive model that can be applied to not only antimicrobial use in small- and medium-sized hospitals but also to quarterly antimicrobial use. Fourth, factors reflecting the characteristics and severity of patients within each hospital (e.g., number of transplant recipients, number of patients on hemodialysis, number of septic shock cases, number of neutropenic patients, etc.) were not sufficiently included in the model variables. Because some variables are not available from the medical insurance claim data, the establishment of a system that can collect standardized data from each hospital is necessary in the near future. With such a system, an updated model that reflects patient characteristics and severity more precisely might be able to be developed.
In conclusion, we developed a model to predict antimicrobial use rates in Korean hospitals, and the model was used as the denominator of the K-SAAR. The K-SAAR helps medical personnel easily grasp the status of antimicrobial use in their hospital by providing the ratio between observed antimicrobial use and predicted antimicrobial use. Through K-SAAR, each hospital can effectively investigate the potential overuse or misuse of antimicrobials so that they can establish appropriate ASP interventions.

Notes

Funding: This study was supported by the Research Program funded by the Korea Disease Control and Prevention Agency (2019-ER5408-00).

Disclosure: The authors have no potential conflicts of interest to disclose.

Author Contributions:

  • Conceptualization: Choi JY.

  • Data curation: Ahn SV, Kim DS, Chae J.

  • Formal analysis: Ahn SV.

  • Funding acquisition: Choi JY.

  • Investigation: Kim B, Ahn SV, Kim DS, Chae J, Jeong SJ, Uh Y, Kim HB, Kim HS, Park SH, Park YS, Choi JY.

  • Methodology: Kim B, Ahn SV, Kim DS, Chae J, Choi JY.

  • Project administration: Kim B, Jeong SJ, Choi JY.

  • Resources: Kim DS, Chae J.

  • Software: Ahn SV.

  • Supervision: Kim B, Ahn SV, Kim DS, Chae J, Jeong SJ, Uh Y, Kim HB, Kim HS, Park SH, Park YS, Choi JY.

  • Validation: Kim B, Ahn SV, Kim DS, Chae J, Jeong SJ, Uh Y, Kim HB, Kim HS, Park SH, Park YS, Choi JY.

  • Writing - original draft: Kim B.

  • Writing - review & editing: Kim B, Ahn SV, Choi JY.

References

1. Pollack LA, Srinivasan A. Core elements of hospital antibiotic stewardship programs from the Centers for Disease Control and Prevention. Clin Infect Dis. 2014; 59:Suppl 3. (Suppl 3):S97–S100. PMID: 25261548.
crossref
2. Ryu S. The new Korean action plan for containment of antimicrobial resistance. J Glob Antimicrob Resist. 2017; 8:70–73. PMID: 28024981.
crossref
3. O’Leary EN, Edwards JR, Srinivasan A, Neuhauser MM, Webb AK, Soe MM, et al. National Healthcare Safety Network Standardized Antimicrobial Administration Ratios (SAARs): a progress report and risk modeling update using 2017 data. Clin Infect Dis. 2020; 71(10):e702–e709. PMID: 32215655.
crossref
4. van Santen KL, Edwards JR, Webb AK, Pollack LA, O’Leary E, Neuhauser MM, et al. The Standardized Antimicrobial Administration Ratio: a new metric for measuring and comparing antibiotic use. Clin Infect Dis. 2018; 67(2):179–185. PMID: 29409000.
crossref
5. Kim B, Yoon YK, Kim DS, Jeong SJ, Ahn SV, Park SH, et al. Development of antibiotic classification for measuring antibiotic usage in Korean hospitals using a modified Delphi method. J Korean Med Sci. 2020; 35(30):e241. PMID: 32743987.
crossref
6. World Health Organization (WHO). ATC/DDD index: updates included in the ATC/DDD index. Updated 2021. Accessed November 13, 2021. https://www.whocc.no/atc_ddd_index/updates_included_in_the_atc_ddd_index/ .
7. Health Insurance Review & Assessment Service (KR). The 9th nationwide evaluation of the appropriateness of surgical prophylactic antibiotics in Korean hospitals in 2020. Updated 2019. Assessed December 12, 2020. http://www.hira.or.kr/bbsDummy.do?pgmid=HIRAA020002000100&brdScnBltNo=4&brdBltNo=7623#none/ .
8. Barrio I, Arostegui I, Rodríguez-Álvarez MX, Quintana JM. A new approach to categorising continuous variables in prediction models: proposal and validation. Stat Methods Med Res. 2017; 26(6):2586–2602. PMID: 26384514.
crossref
9. Barlam TF, Cosgrove SE, Abbo LM, MacDougall C, Schuetz AN, Septimus EJ, et al. Implementing an antibiotic stewardship program: guidelines by the Infectious Diseases Society of America and the Society for Healthcare Epidemiology of America. Clin Infect Dis. 2016; 62(10):e51–e77. PMID: 27080992.
crossref

SUPPLEMENTARY MATERIALS

Supplementary Table 1

The classification of antimicrobial agents in Korea National Antimicrobial Use Analysis System
jkms-37-e191-s001.doc

Supplementary Table 2

Korean Standardized Antimicrobial Administration Ratio table
jkms-37-e191-s002.xls
TOOLS
Similar articles