Abstract
Objectives
The purpose of this study was to estimate the minimal clinically important difference (MCID) of mouth opening (MO) and patient satisfaction in surgically treated oral submucous fibrosis (OSMF) patients.
Materials and Methods
The status of MO was collected preoperatively (T0), postoperatively at 3 months (T1), and at a minimum of 6 months postoperatively (T2). MCID was determined through the anchor-based approach with the change difference method, mean change method, and receiver operator characteristic curve (ROC) method.
Results
In this study, 35 patients enrolled and completed postoperative follow-up (T2) averaging a duration of 18.1 months. At T1, using the change difference method, MO was 14.89 mm and the ROC curve exhibited a 11.5 gain in MO (sensitivity 81.8% and specificity 100%, area under the curve [AUC] of 0.902) and was classified as MCID as reported by patients. At T2, MCID of MO was 9.75 mm using the change difference method and 11.75 mm by the mean change method. The ROC curve revealed that the MCID of MO at T2 was 10.5 mm with 73.9% sensitivity and 83.3% specificity (AUC of 0.873). The kappa value was 0.91, confirming reliability of the data.
Oral submucous fibrosis (OSMF) is a potentially malignant disorder with a malignant transformation rate of 7%-30% and a high prevalence of 1.2%-4.6% in females and 0.2%-2.3% in males among the age group of 11-60 years in South and Southeast Asian countries1. This disease is not confined to the Eastern world, and an increasing trend has been reported in Western countries like the UK, USA, South Africa, and many European countries due to increased population migration1.
Despite a plethora of research in the field of OSMF, this disease remains a challenge to maxillofacial surgeons with respect to its treatment and prognosis. Most of the therapeutic modalities reported in the literature have targeted mouth opening (MO) and have shown statistically significant improvement, increasing the patient’s quality of life (QoL)2. However, whether that statistically significant improvement in MO has been perceived as beneficial by the patients.
According to the National Health Service (NHS) survey in 2008, in routine practice, clinicians do not always pay sufficient attention to patients’ opinions about treatment options3. Therefore, patient reported outcomes (PROs) have been employed in the NHS since 2009, and has profoundly altered the profile of health care administration3. The use of PROs to assess health status has several advantages over traditional research-based outcome measurements and enables behavior modification for patients and clinicians, ensuring greater compliance and better treatment outcomes. Application of PROs is an evolving parameter of operative success and should be essential for use in health care practice. However, determining the extent of change in PROs as a numerical score remains a challenge.
The concept of minimum clinically important difference (MCID) describes the smallest change in PROs needed to achieve a level of clinical improvement. It also determines whether a treatment leads to clinically substantial recovery and can be explained as the degree to which a patient needs to improve in order to appreciate a clinical difference4. This measurement has been widely used in a variety of medical specialties such as orthopedics5-7, neurosurgery8, and otorhinolaryngology9. In the head and neck region, MCID has only been calculated for temporomandibular disorders and rhinosinusitis9,10.
Therefore, determination of MCID in patient-oriented outcomes is necessary to better evaluate the effectiveness of OSMF surgery and can provide insight into postoperative patient satisfaction. The purpose of this study was to determine MCID in patients with surgically treated submucous fibrosis.
Adult patients who had undergone surgery for grade III or IV OSMF11 from a single institution (All India Institute of Medical Sciences [AIIMS], Jodhpur, India) from June 2018 to March 2020, were retrospectively included in the study. This study adhered to the Declaration of Helsinki (2013) on medical protocols and ethics after receiving ethical clearance from the Institutional Ethical Committee of AIIMS (No. AIIMS/IEC/2021/3270) and obtaining informed consent from the patients.
Patients who declined to provide records, whose data records were irretrievable, who exhibited ulcerative or malignant changes, or who had difficulty in comprehension and communication were excluded from the study. All enrolled patients had undergone similar surgical management by a single surgeon through fibrous band release and reconstruction with a buccal fat pad under general anesthesia. Coronoidectomy was performed if MO was <35 mm. All patients followed strict jaw physiotherapy protocols involving active MO exercises with heister mouth gags every two hours under observation from postoperative day 1 until the time of discharge. The patients were trained to follow this strict jaw physiotherapy regimen post discharge with daily recordings of MO with a scale and were monitored with clinical visits every week for the first month, every month thereafter for three months, and visits every two months subsequently. The patients were examined in person and, if unable to be reached, were contacted through the use of audio-visual aids using smart phones with standard charts and pictures by an investigator who was blinded to the surgery and was routinely involved in follow-up of such patients.
MO data were collected preoperatively (T0), postoperatively at 3 months (T1), and at minimum 6 months postoperatively (T2). Using a validated 6-point Likert scale, patient satisfaction scores (with MO) were also evaluated at T1 and T2. The patients were designated as “satisfied” or “dissatisfied” based on a completed 6-point Likert satisfaction scale. With reference to the Likert scale, 1 denoted “extremely dissatisfied,” 2 denoted “very dissatisfied,” 3 denoted “somewhat dissatisfied,” 4 denoted “somewhat satisfied,” 5 denoted “very satisfied,” and 6 denoted “extremely satisfied.” Patients reporting lower satisfaction scores of 1 to 3 were categorized as dissatisfied, while those with satisfaction scores of 4 to 6 were categorized as satisfied. This satisfaction categorization was used as the anchor in determining MCID using the standard anchor-based method8.
Generally, MCID calculation methods are classified broadly into two groups: anchor based and distribution based12. Previous literature has demonstrated the strengths and weaknesses of both methods. However, a standardized methodology for calculating MCID has yet to be determined13,14.
Anchor-based methods for calculating a patient reported outcome measures (PROM)’s MCID use an explicit scale for patients to rate the change in outcome as measured by the PROM. This explicit scale is referred to as the ‘‘anchor’’ and is applied post treatment as an external standard against which changes in the PROM score can be compared15. Three MCID calculation methods in the anchor-based approach were used in our study with the change difference method, mean change method, and receiver operator characteristic curve (ROC curve) method.
The mean change method has been defined in the literature as the calculated difference between the mean preoperative and mean postoperative scores in satisfaction13,16,17. The change difference method is the calculated difference between the mean change for the satisfied cohort and the mean change for the dissatisfied cohort13,16,17. Both of these are traditional and widely used methods. However, the appropriateness of a standard anchor must be determined by case18.
Recently, some newer methods have been proposed such as ROC curve methods, which are based on the anchor and regression model19,20, and integrated as both anchor and distribution-based methods. The sensitivity and specificity of the MCID value were determined, and the area under the curve (AUC) was calculated. An AUC of 0.5 indicated that the outcome occurred due to chance alone. Twenty patients were randomly studied by another investigator, and inter-rater reliability was assessed by kappa value. Statistical analysis was performed using IBM SPSS Statistics (ver. 23; IBM, Armonk, NY, USA).
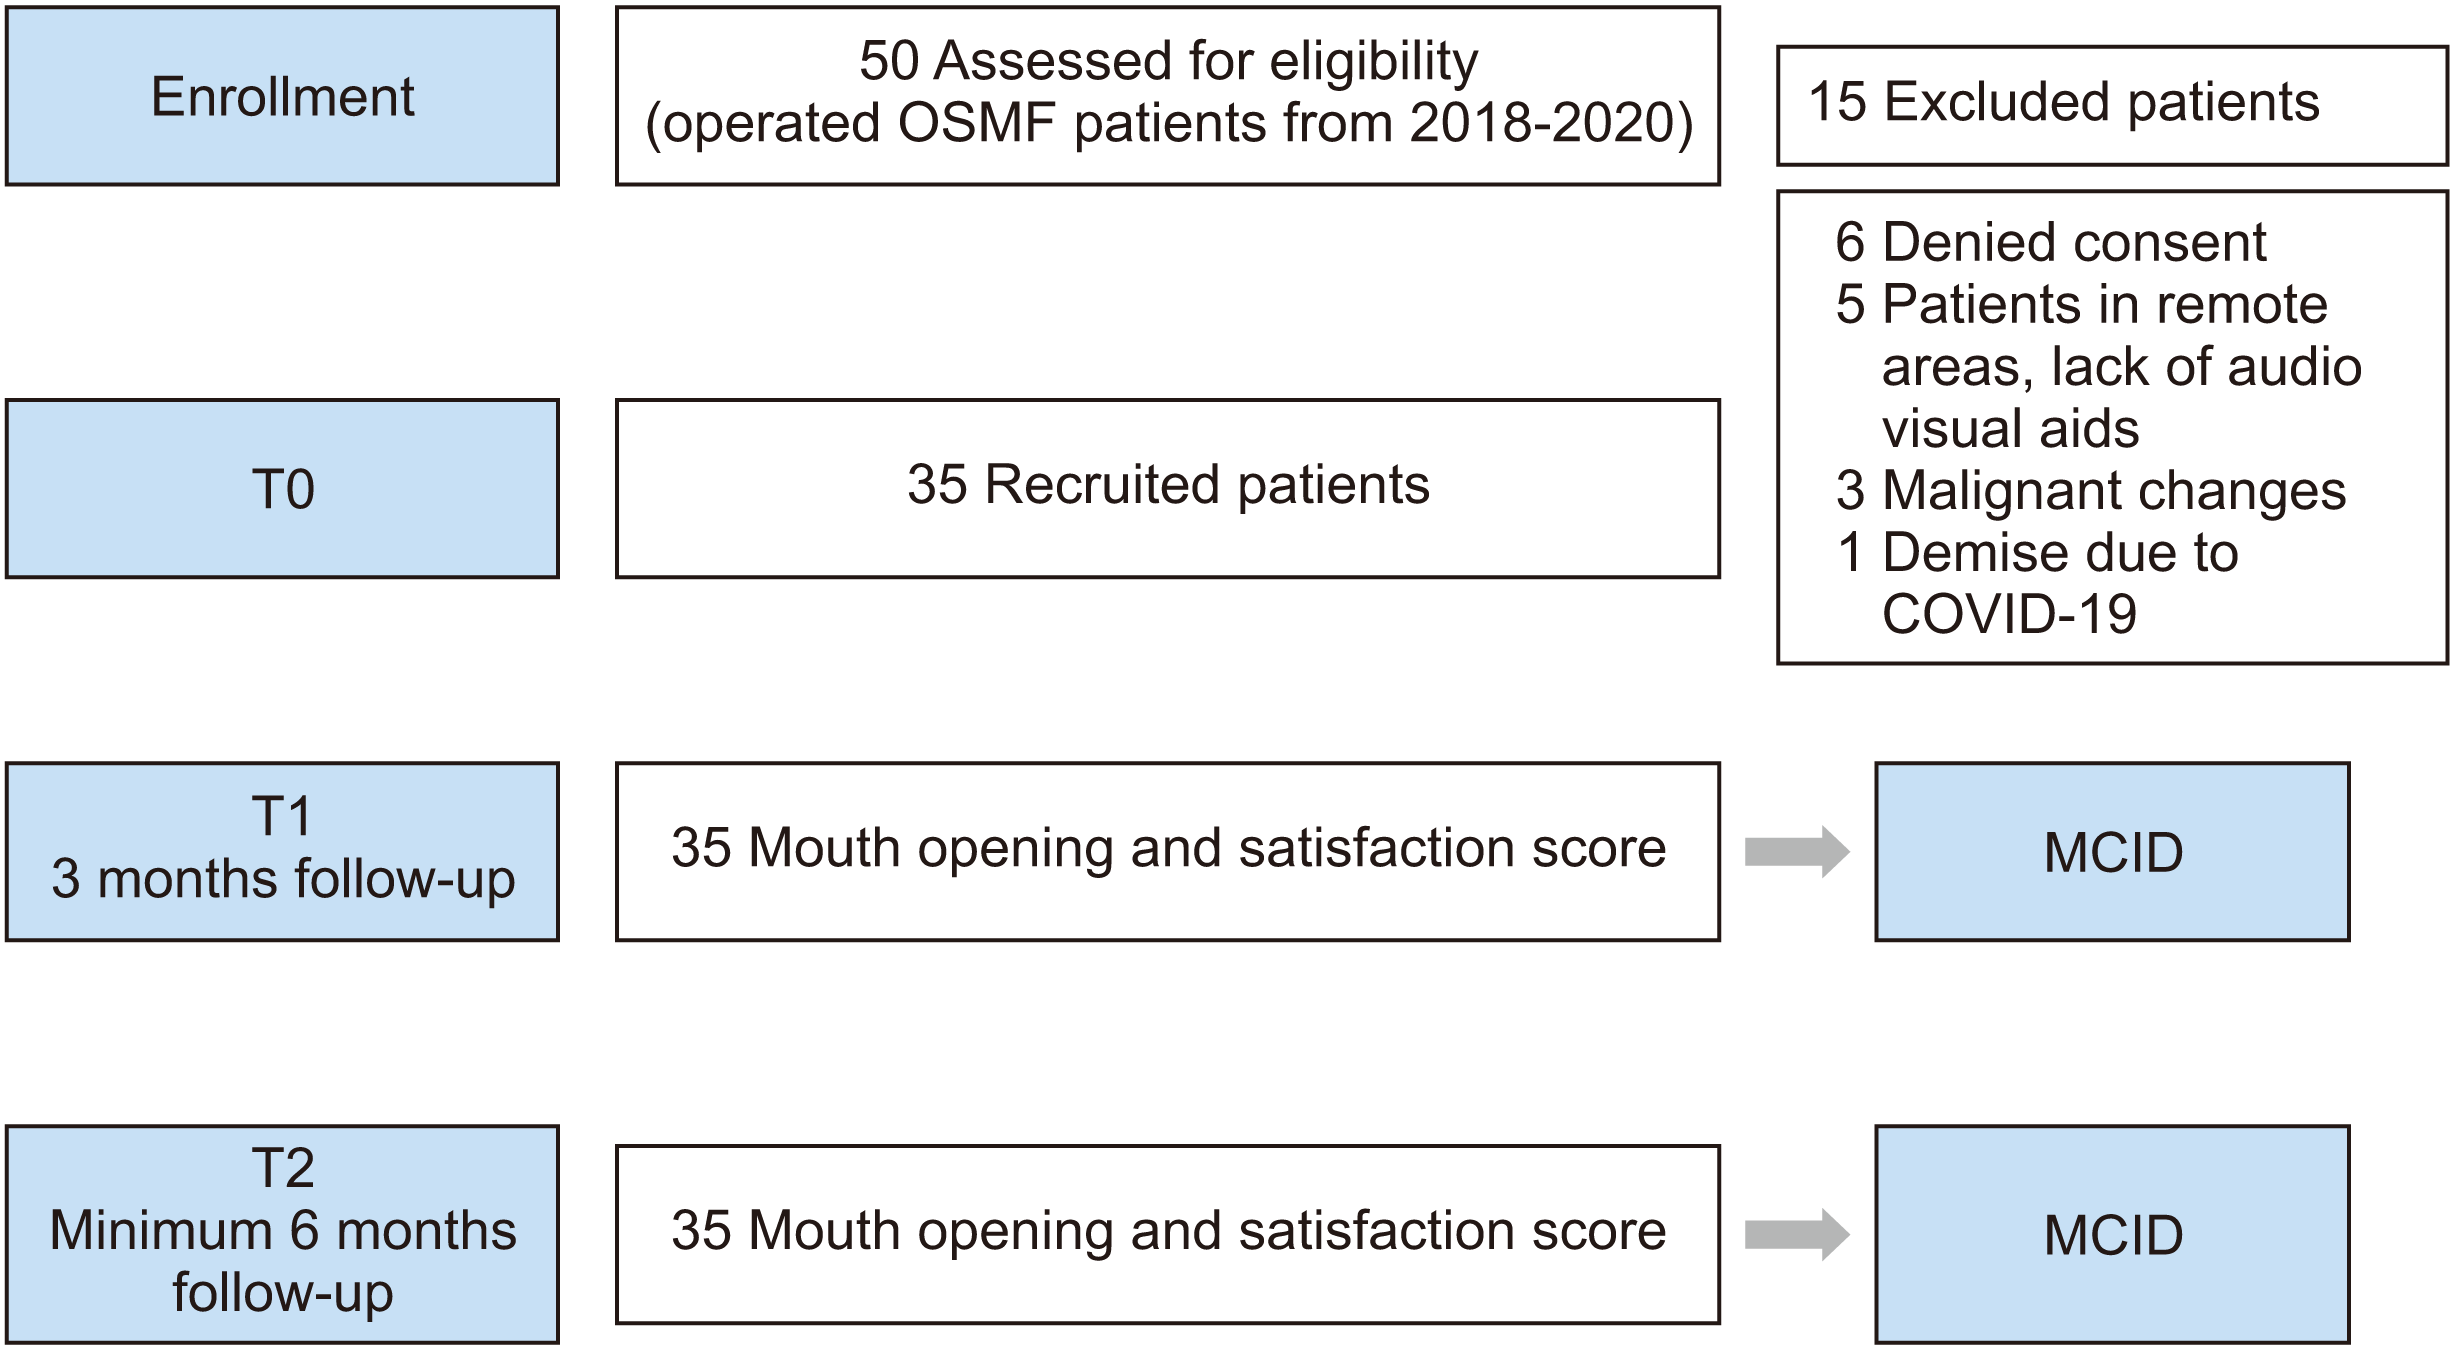
The study included the medical records of 35 of 50 patients who underwent OSMF from June 2018 to March 2020, as seen in the study flowchart of Fig. 1. An attrition of 30% was observed due to unwillingness to participate in the study, ulcerative or malignant changes in the oral cavity, death of the patient due to the COVID-19 pandemic, and lack of availability of visual aids in remote areas.
Our study included 24 males and 11 females with a mean age of 31.89±11.09 years. The mean maximum follow-up (T2) was 18.1 months with a range of 6-27 months. A similar method of predicting MCID using mean follow-up (minimum 1 year) was incorporated by Sutton et al.5.
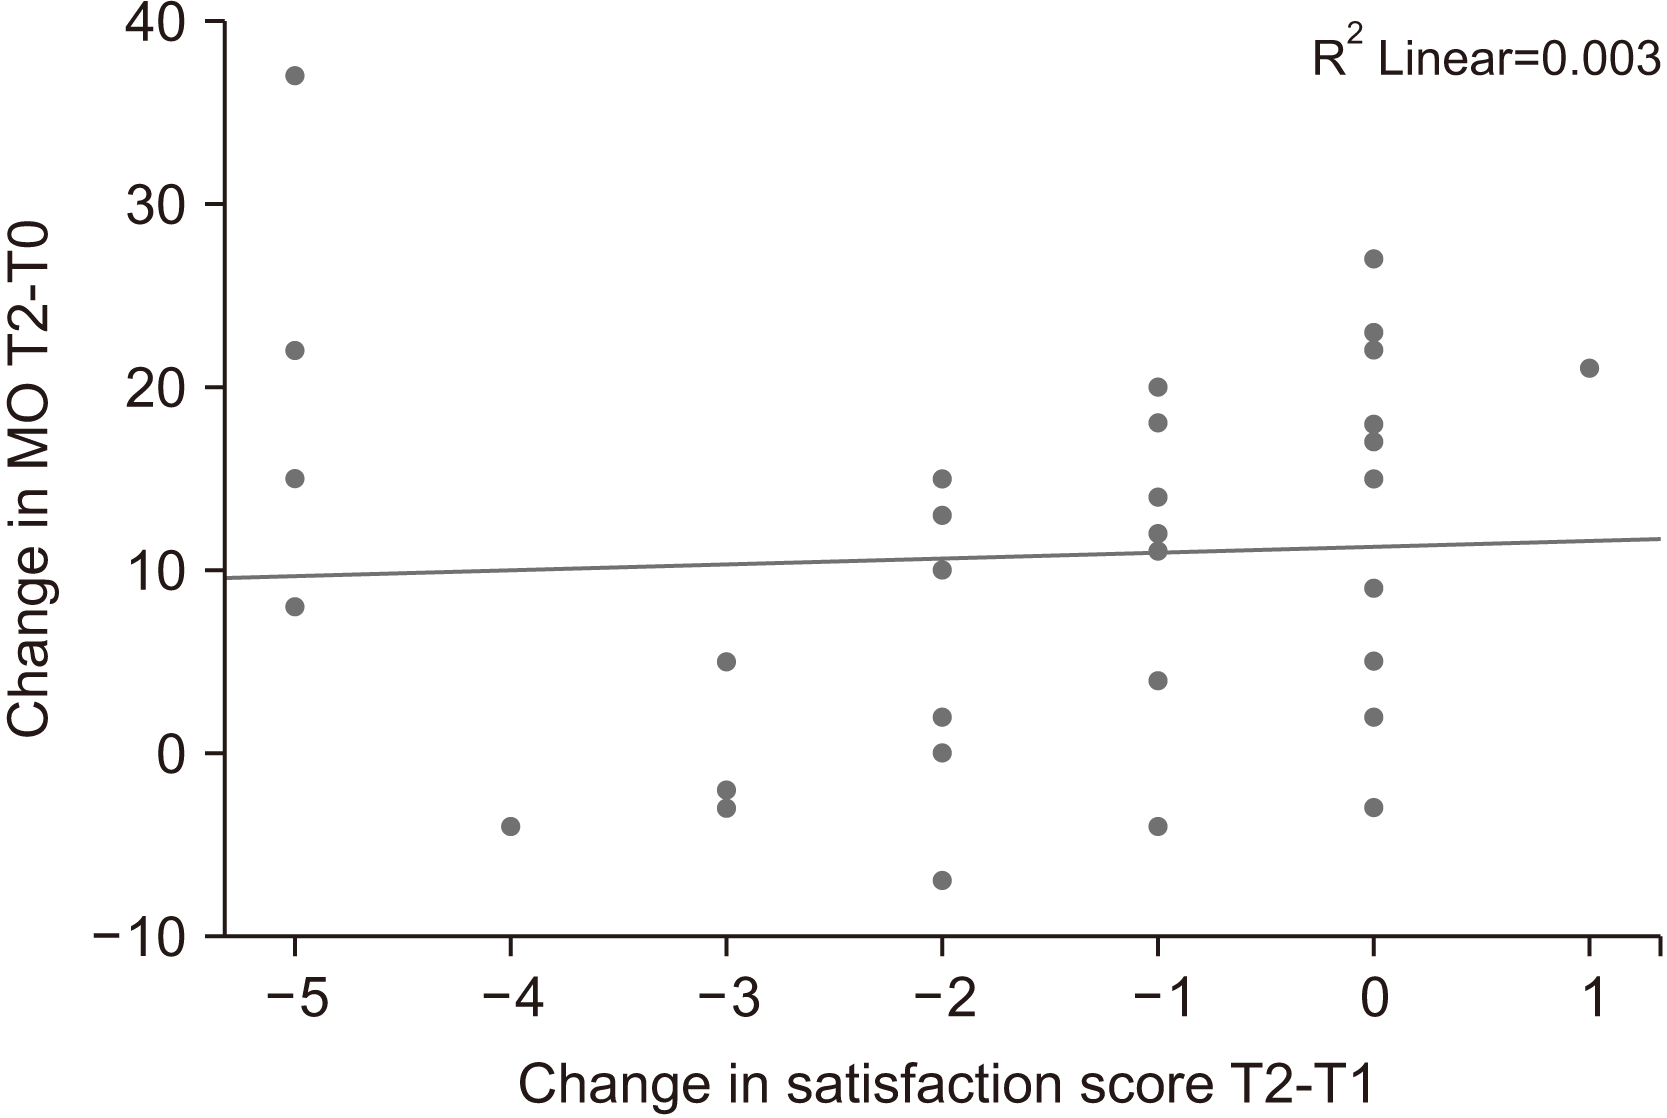
The mean MO was 15.14±5.34 mm at T0, 31.8±7.01 mm at T1, and 25.68±9.48 mm at T2. The mean satisfaction scores at T1 and T2 were 4.86±0.93 and 3.94±1.64, respectively.(Table 1) The correlation of satisfaction scores at maximum follow-up with mean change of the mouth was found to be highly significant (Pearson’s correlation coefficient=0.82).(Fig. 2) A total of 33 patients was satisfied at the 3 month follow-up compared to 19 patients at the final follow-up.(Table 2)
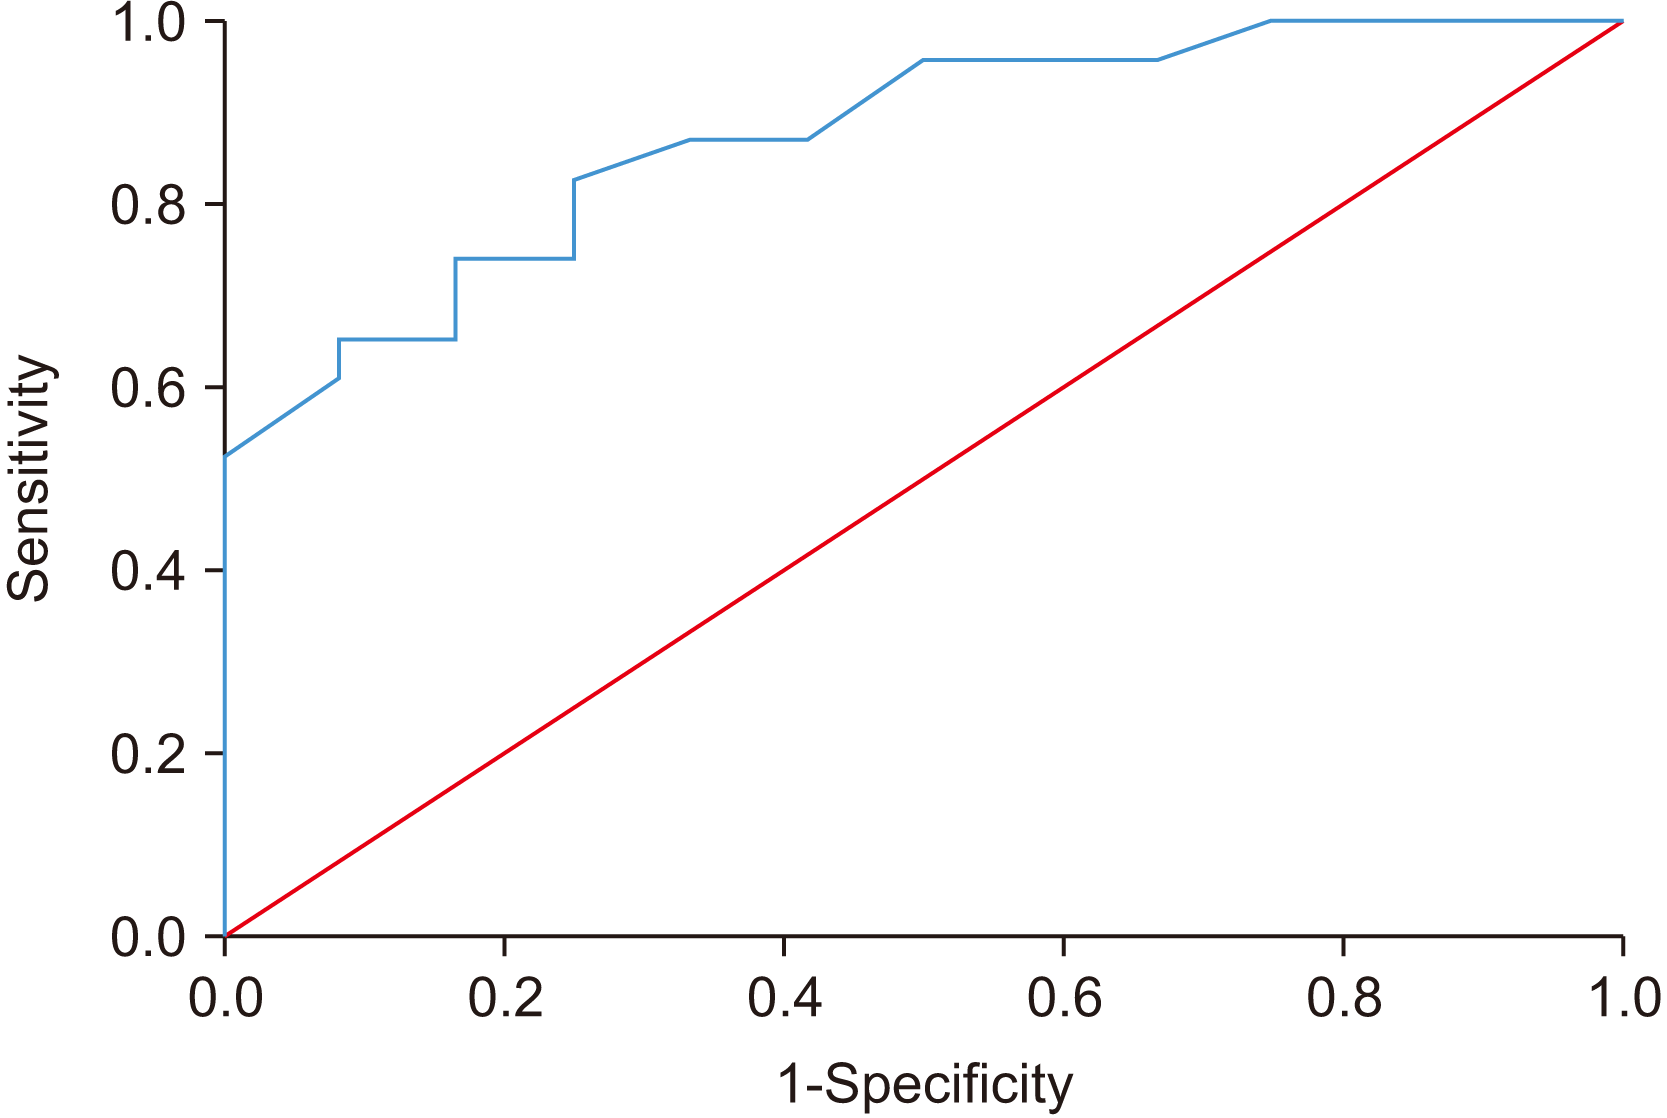
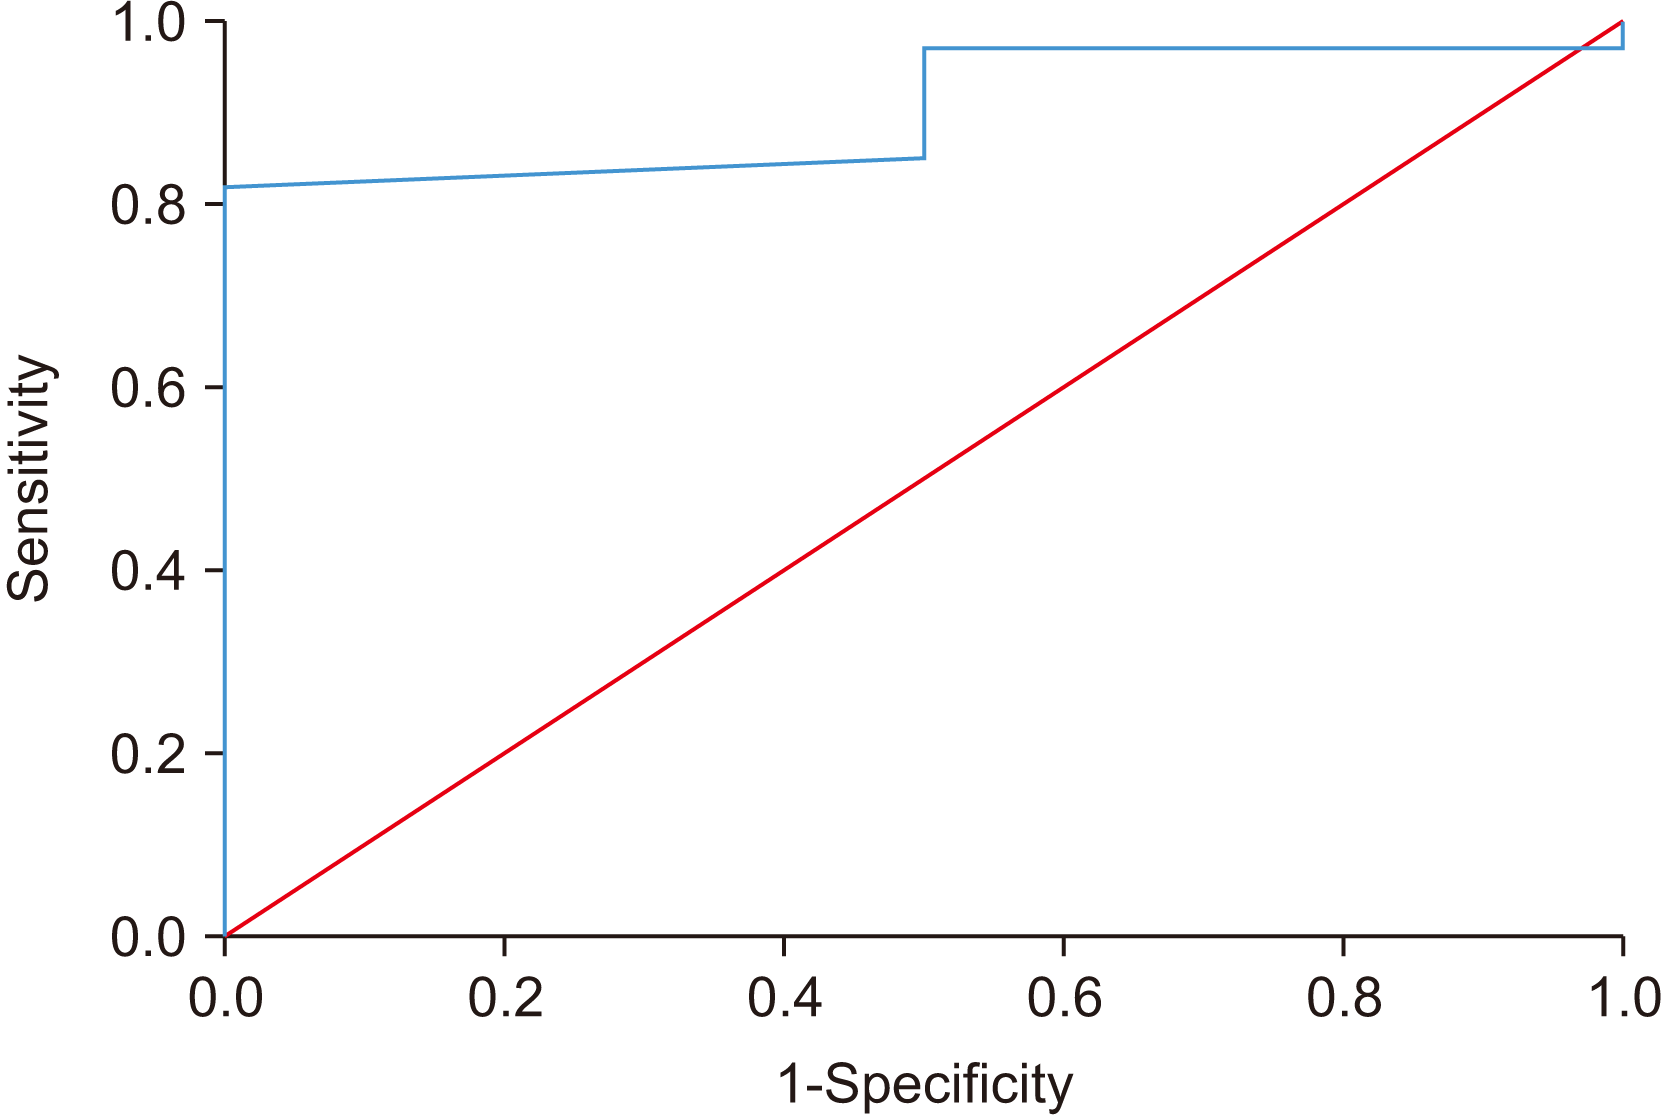
The MCID was calculated by three methods of the anchor-based approach, the change difference method, ROC curve-derived method, and mean change method as shown in Fig. 3 and 4 and Table 3.
The calculated MCID of MO using the mean change approach was 14.89 mm at T1 and 11.75 mm at T2, with 18/35 (51.4%) patients achieving this threshold at T1 and T2, respectively. Additionally, the calculated MCID of MO using the change difference approach was 9.75 mm at T2, with 20/35 (57.1%) patients achieving this threshold. The ROC curve (T1) exhibited a sensitivity of 81.8% and specificity of 100% with MCID at 11.5 mm and AUC at 0.902 as shown in Fig. 2. At T2, the ROC curve had a sensitivity of 73.9% and specificity of 83.3%.(Fig. 3, 4) The AUC of this ROC was 0.873.
The kappa value was determined to be 0.91 confirming the reliability of the data.
This study demonstrated a range of MCID values for gain in MO after OSMF surgery that might indicate clinically significant improvement in MO. Furthermore, this study implies that improvement of MO (gain in MO) of approximately 10 mm indicates a clinically significant improvement to the patient.
Since preoperative decreased MO (Stage III/IV) is a predominant qualification for OSMF surgery, the QoL of patients is quite compromised at this stage2. Mean preoperative MO was 15.14±5.34 mm, and a minimal gain of 10 mm was determined to be sufficient by the patient as they were able to perform their regular day to day activities. This can be inconsistent with the expectation of the surgeons, but the findings of this study are consistent with this assertion. It might be possible that preoperative discomfort and impairment are much more severe than believed, explaining patient acceptance of this minimal gain in MO because of their increased ability to perform daily functions.
Determining the success of any therapy is evolving like the therapy itself, and the focus is being shifted from objective assessments of clinical signs and symptoms to patient determined factors like PROMs, QoL, and more consolidated MCID. PRO questionnaires have been used widely to measure treatment effectiveness. However, the deficiency of such questionnaires is that they lack a clinically relevant meaning17. Therefore, MCID helps to quantify the measure of treatment outcomes as it aids in the assessment of the actual benefit of treatment as perceived by the patient4. PROM and MCIDs are the present-day parameters for determining the success of any therapy.
MCID for pain and function assessed by range of motion has been used extensively in orthopedic literature to assess success of surgical and non-surgical treatments5,7,8,21. In the field of neurosurgery, MCID has found its application in measuring the adequacy of care in lumbar spine surgeries through the assessment of pain8,22. In the maxillofacial arena, MCID has found minor attention confined to calculating calculation of the MCID of chewing efficiency as a treatment outcome in patients with temporomandibular joint and muscle disorders10. As a maxillofacial surgeon, it is important to begin assessing clinical success in terms of patient perceived parameters.
MCID can be calculated by anchor based or distributive approaches. Distribution based methods assume statistical significance of the sample and do not address the question of the patient’s perspective of important change, which is significantly different from clinical statistical significance13,14. In this study, MCID of MO of operated oral submucous patients was calculated through the anchor-based approach with validation by the change difference method, ROC curve method, and mean change method. The MCID values derived from the three methods varied, supporting the internal validity of our study. There was a high correlation of 0.8 between satisfaction score and MO at maximum follow-up, implying that the satisfaction state of the patients improved with an increase in MO. The satisfaction scores and MO at 3 months were 4.86±0.93 and 31.8±7.01 mm, and 3.94±1.64 and 25.68±9.48 mm at maximum follow-up, respectively. A gradual reduction in MO with increased follow-up duration can be attributed to the decrease in patient compliance toward physiotherapy as the frequency of follow-ups decreased after 3 months. This emphasizes the importance for long-term regular follow-ups of a minimum of 6 months along with guided physiotherapy. Since the baseline parameters were similar for all the patients, we can state with confidence that MO after surgery is critical for patient satisfaction.
This is a study assessing patient perspective of MCID in MO after surgical treatment of OSMF rather than relying on statistical data. Second, our study consisted of a homogenous sample with grade III or IV OSMF and MO <20 mm with a similar surgery of fibrous band excision followed by reconstruction with buccal fat pads. Therefore, the confounding factors contributing to selection bias and bias from surgery were eliminated. In addition, a validated anchor question was applied, and MCID was calculated through the mean change method and ROC curve method, demonstrating high sensitivity.
Anchor-based methods have been criticized for recall bias in long-term responsiveness18. In addition, the precision of the anchor is very important in identifying the true response. The applicability of MCID is currently limited by the variable methods of determining MCID and the subsequent results of these methods. Furthermore, the current literature does not support a single MCID method as definitive23.
The limitations of our study involved calculation of the MCID from a series of patients from a single institution. A large series of patients from multiple centers can add to the credibility of the calculated MCID. Due to the limited sample size of our study, stratification of MCID on the basis of age, sex, and duration of follow-up was not feasible, and the other approaches of the distributive method of calculating MCID could not be applied. In addition, the use of PROM is highly subjective, but the patient’s opinion is the ultimate measure of success.
On a positive note, this study established a baseline for the use of MCID in evaluation of MO in OSMF patients. With an increase in prevalence of PROs as a metric of operative success, it is important to quantify these outcomes in a clinically significant fashion.
In conclusion, an MCID of at least a 10 mm increase in MO is required for patients to experience a clinical impact from the procedure. The high sensitivity and specificity of MCID found in our study strongly suggest the need to use patient-reported MCIDs of MO as a parameter for judging the surgical success of OSMF patients. This research paves the way for multiple future studies. A larger sample size and longer follow-ups in treated OSMF patients will allow stratification of MCID based on age, sex, and disease severity using the distributive approach for calculating MCID. It would also be prudent to assess if the MCID of MO varies under different conditions such as with diseases of temporomandibular joint and radiation-induced fibrosis and infections. PROM studies calculating MCID for non-surgical treatment modalities with larger sample sizes should also be planned in order to improve the quality of health care.
Notes
Authors’ Contributions
A.K. participated in study design, coordination, and wrote the manuscript. N.R. participated in the study design and performed the statistical analysis. A.G. participated in data collection. N.P.M. participated in data collection. P.K. participated in approval of final manuscript. K.C. participated in designing the study, drafted the manuscript, and final approval of manuscript.
References
1. Rao NR, Villa A, More CB, Jayasinghe RD, Kerr AR, Johnson NW. 2020; Oral submucous fibrosis: a contemporary narrative review with a proposed inter-professional approach for an early diagnosis and clinical management. J Otolaryngol Head Neck Surg. 49:3. https://doi.org/10.1186/s40463-020-0399-7. DOI: 10.1186/s40463-020-0399-7. PMID: 31915073. PMCID: PMC6951010.

2. Chole RH, Patil R. 2018; Assessment of the quality of life and performance status in patients with oral submucous fibrosis in central India. Clujul Med. 91:203–8. https://doi.org/10.15386/cjmed-806. DOI: 10.15386/cjmed-806. PMID: 29785159. PMCID: PMC5958986.

3. Kyte DG, Calvert M, van der Wees PJ, ten Hove R, Tolan S, Hill JC. 2015; An introduction to patient-reported outcome measures (PROMs) in physiotherapy. Physiotherapy. 101:119–25. https://doi.org/10.1016/j.physio.2014.11.003. DOI: 10.1016/j.physio.2014.11.003. PMID: 25620440.

4. Jaeschke R, Singer J, Guyatt GH. 1989; Measurement of health status. Ascertaining the minimal clinically important difference. Control Clin Trials. 10:407–15. https://doi.org/10.1016/0197-2456(89)90005-6. DOI: 10.1016/0197-2456(89)90005-6. PMID: 2691207.

5. Sutton RM, McDonald EL, Shakked RJ, Fuchs D, Raikin SM. 2019; Determination of minimum clinically important difference (MCID) in visual analog scale (VAS) pain and foot and ankle ability measure (FAAM) scores after hallux valgus surgery. Foot Ankle Int. 40:687–93. https://doi.org/10.1177/1071100719834539. DOI: 10.1177/1071100719834539. PMID: 30841749.

6. Torrens C, Guirro P, Santana F. 2016; The minimal clinically important difference for function and strength in patients undergoing reverse shoulder arthroplasty. J Shoulder Elbow Surg. 25:262–8. https://doi.org/10.1016/j.jse.2015.07.020. DOI: 10.1016/j.jse.2015.07.020. PMID: 26422525.

7. Tashjian RZ, Deloach J, Porucznik CA, Powell AP. 2009; Minimal clinically important differences (MCID) and patient acceptable symptomatic state (PASS) for visual analog scales (VAS) measuring pain in patients treated for rotator cuff disease. J Shoulder Elbow Surg. 18:927–32. https://doi.org/10.1016/j.jse.2009.03.021. DOI: 10.1016/j.jse.2009.03.021. PMID: 19535272.

8. Asher AL, Kerezoudis P, Mummaneni PV, Bisson EF, Glassman SD, Foley KT, et al. 2018; Defining the minimum clinically important difference for grade I degenerative lumbar spondylolisthesis: insights from the Quality Outcomes Database. Neurosurg Focus. 44:E2. https://doi.org/10.3171/2017.10.FOCUS17554. DOI: 10.3171/2017.10.FOCUS17554. PMID: 29290132.

9. Levy JM, Mace JC, Bodner TE, Alt JA, Smith TL. 2017; Defining the minimal clinically important difference for olfactory outcomes in the surgical treatment of chronic rhinosinusitis. Int Forum Allergy Rhinol. 7:821–6. https://doi.org/10.1002/alr.21964. DOI: 10.1002/alr.21964. PMID: 28556611. PMCID: PMC5544549.

10. Ingram M, Choi YH, Chiu CY, Haggard R, Dougall AL, Buschang P, et al. 2011; Use of the minimal clinically important difference (MCID) for evaluating treatment outcomes with TMJMD patients: a preliminary study. J Appl Biobehav Res. 16:148–66. https://doi.org/10.1111/j.1751-9861.2011.00068.x. DOI: 10.1111/j.1751-9861.2011.00068.x. PMID: 22919263. PMCID: PMC3423998.

11. Khanna JN, Andrade NN. 1995; Oral submucous fibrosis: a new concept in surgical management. Report of 100 cases. Int J Oral Maxillofac Surg. 24:433–9. https://doi.org/10.1016/s0901-5027(05)80473-4. DOI: 10.1016/S0901-5027(05)80473-4. PMID: 8636640.

12. Wright A, Hannon J, Hegedus EJ, Kavchak AE. 2012; Clinimetrics corner: a closer look at the minimal clinically important difference (MCID). J Man Manip Ther. 20:160–6. https://doi.org/10.1179/2042618612Y.0000000001. DOI: 10.1179/2042618612Y.0000000001. PMID: 23904756. PMCID: PMC3419574.

13. Copay AG, Subach BR, Glassman SD, Polly DW Jr, Schuler TC. 2007; Understanding the minimum clinically important difference: a review of concepts and methods. Spine J. 7:541–6. https://doi.org/10.1016/j.spinee.2007.01.008. DOI: 10.1016/j.spinee.2007.01.008. PMID: 17448732.

14. Crosby RD, Kolotkin RL, Williams GR. 2003; Defining clinically meaningful change in health-related quality of life. J Clin Epidemiol. 56:395–407. https://doi.org/10.1016/s0895-4356(03)00044-1. DOI: 10.1016/S0895-4356(03)00044-1. PMID: 12812812.

15. Sedaghat AR. 2019; Understanding the minimal clinically important difference (MCID) of patient-reported outcome measures. Otolaryngol Head Neck Surg. 161:551–60. https://doi.org/10.1177/0194599819852604. DOI: 10.1177/0194599819852604. PMID: 31159641.

16. Copay AG, Glassman SD, Subach BR, Berven S, Schuler TC, Carreon LY. 2008; Minimum clinically important difference in lumbar spine surgery patients: a choice of methods using the Oswestry disability index, medical outcomes study questionnaire short form 36, and pain scales. Spine J. 8:968–74. https://doi.org/10.1016/j.spinee.2007.11.006. DOI: 10.1016/j.spinee.2007.11.006. PMID: 18201937.

17. Parker SL, Mendenhall SK, Shau DN, Adogwa O, Anderson WN, Devin CJ, et al. 2012; Minimum clinically important difference in pain, disability, and quality of life after neural decompression and fusion for same-level recurrent lumbar stenosis: understanding clinical versus statistical significance. J Neurosurg Spine. 16:471–8. https://doi.org/10.3171/2012.1.SPINE11842. DOI: 10.3171/2012.1.SPINE11842. PMID: 22324801.

18. Ren D, Wu T, Wan C, Li G, Qi Y, Fang Y, et al. 2021; Exploration of the methods of establishing the minimum clinical important difference based on anchor and its application in the quality of life measurement scale QLICP-ES (V2.0) for esophageal cancer. Health Qual Life Outcomes. 19:173. https://doi.org/10.1186/s12955-021-01808-7. DOI: 10.1186/s12955-021-01808-7. PMID: 34215267. PMCID: PMC8254221.

19. Coeytaux RR, Kaufman JS, Chao R, Mann JD, Devellis RF. 2006; Four methods of estimating the minimal important difference score were compared to establish a clinically significant change in headache impact test. J Clin Epidemiol. 59:374–80. https://doi.org/10.1016/j.jclinepi.2005.05.010. DOI: 10.1016/j.jclinepi.2005.05.010. PMID: 16549259.

20. de Vet HC, Beckerman H, Terwee CB, Terluin B, Bouter LM. 2006; Definition of clinical differences. J Rheumatol. 33:434. author reply 435. PMID: 16465677.
21. Tubach F, Ravaud P, Beaton D, Boers M, Bombardier C, Felson DT, et al. 2007; Minimal clinically important improvement and patient acceptable symptom state for subjective outcome measures in rheumatic disorders. J Rheumatol. 34:1188–93. PMID: 17477485. PMCID: PMC2760122.
22. Copay AG, Chung AS, Eyberg B, Olmscheid N, Chutkan N, Spangehl MJ. 2018; Minimum clinically important difference: current trends in the orthopaedic literature, part I: upper extremity: a systematic review. JBJS Rev. 6:e1. https://doi.org/10.2106/JBJS.RVW.17.00159. DOI: 10.2106/JBJS.RVW.17.00159. PMID: 30179897.

23. Maltenfort M, Díaz-Ledezma C. 2017; Statistics in brief: minimum clinically important difference-availability of reliable estimates. Clin Orthop Relat Res. 475:933–46. https://doi.org/10.1007/s11999-016-5204-6. DOI: 10.1007/s11999-016-5204-6. PMID: 28050812. PMCID: PMC5339150.

Fig. 1
Study flowchart. (OSMF: oral submucous fibrosis, MCID: minimal clinically important difference)

Fig. 2
Scatter diagram with the fit line of change in mouth opening (MO) T2-T0 by change in satisfaction score T2-T1.

Fig. 3
Receiver operator characteristic (ROC) curve for mean change in mouth opening at T1. Diagonal segments are produced by ties.

Fig. 4
Receiver operator characteristic (ROC) curve for mean change in mouth opening at T2. Diagonal segments are produced by ties.

Table 1
Mouth opening (MO) values and satisfaction scores at different time periods
| Parameter | Value |
|---|---|
| Preoperative MO T0 (mm) | 15.14±5.34 |
| MO at T1 (mm) | 31.8±7.01 |
| MO at T2 (mm) | 25.68±9.48 |
| Satisfaction score T1 | 4.86±0.93 |
| Satisfaction score at T2 | 3.94±1.64 |
Table 2
Distribution of satisfaction scores and mean change in mouth opening (MO) at T1 and at T2
Table 3
Calculated MCID values for each method


 PDF
PDF Citation
 Print
Print


 XML Download