

 PDF
PDF Citation
 Print
Print


INTRODUCTION
MATERIALS AND METHODS
Subjects
Table 1
For a clinical diagnosis of classical BWS, a patient requires a score of ≥4 (this clinical diagnosis does not require molecular confirmation of an 11p15.5 anomaly). Patients with a score of ≥2 (including those with classical BWS with a score of ≥4) merit genetic testing for BWS investigation and diagnosis.
![]()
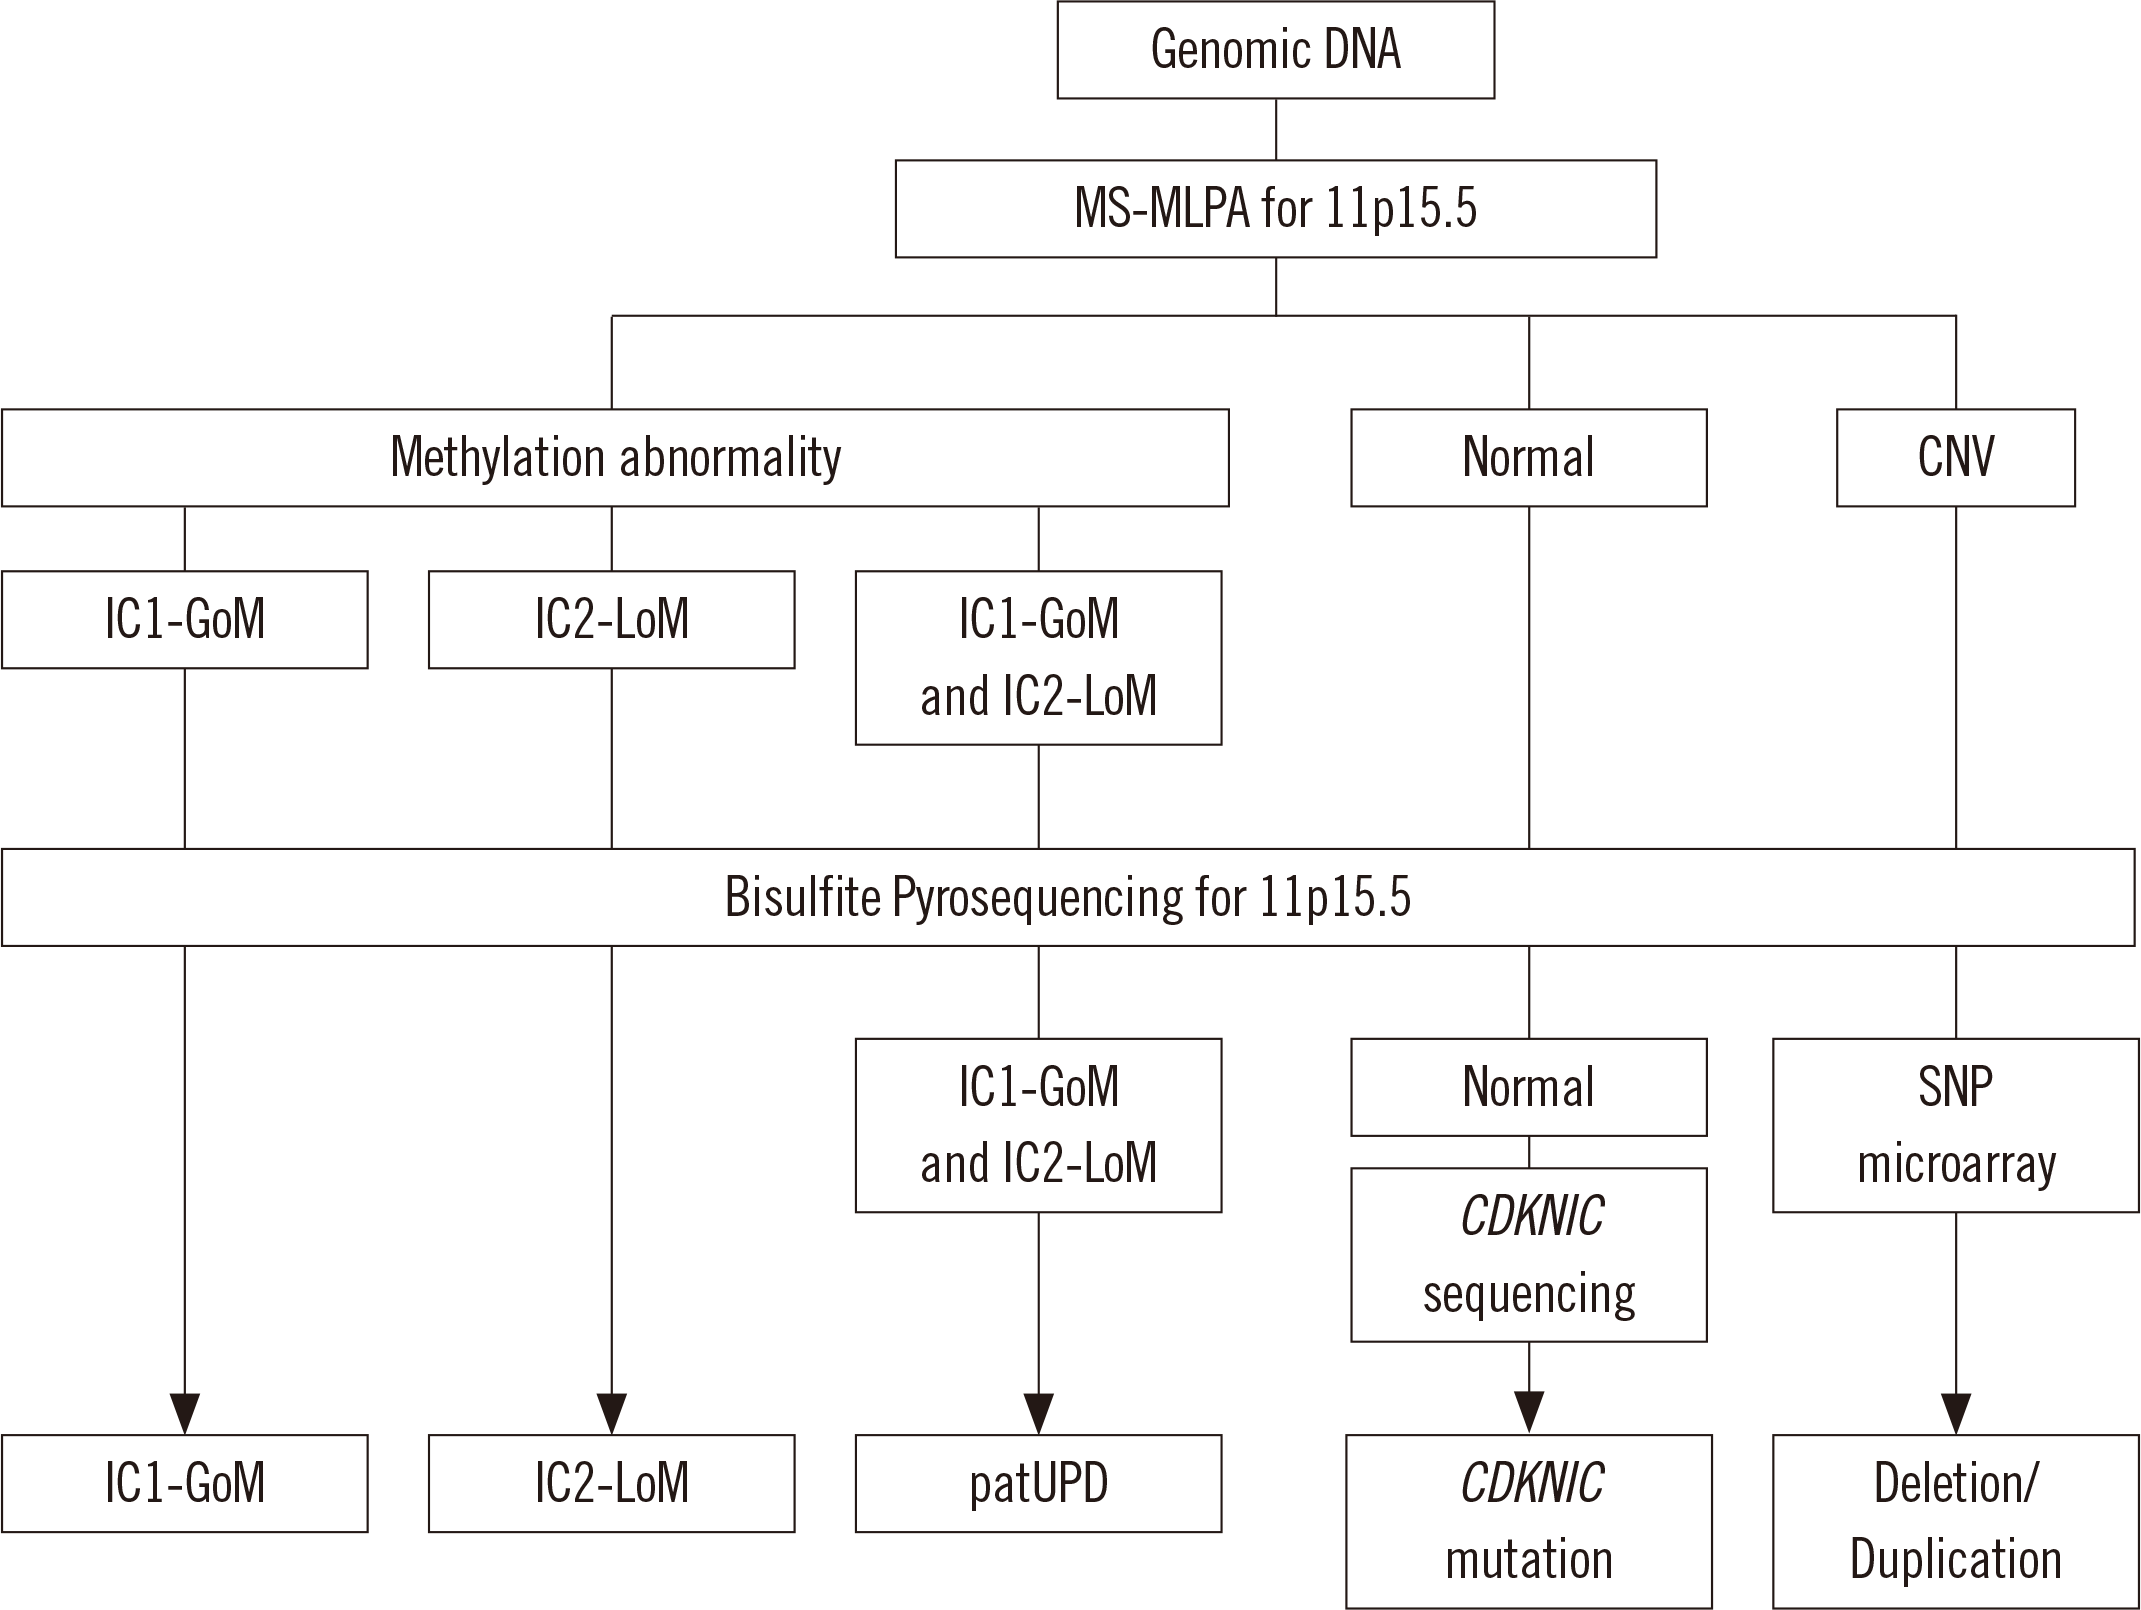
Genetic and epigenetic analysis
Fig. 1
![]()
Statistical analysis
RESULTS
Patient characteristics
Table 2
| No. case | Sex | Age (yr) | Gestation (weeks) | Length at birth (SDS) | Birth weight (SDS) | ART | Clinical score | Clinical manifestations | MS-MLPA (11p15.5) | Bisulfite pyrosequencing | ||
|---|---|---|---|---|---|---|---|---|---|---|---|---|
|
|
|
|||||||||||
| BWS features | Other features | IC1 (%mC SDS) | IC2 (%mC SDS) | |||||||||
| 1 | F | 6.2 | 40 | –0.3 | +0.5 | + | 3 | LO, E | IC2-LoM | N | L (–12.9) | |
| 2 | M | 1.5 | 28 | +0.7 | +2.1 | - | 7 | S, O, MO, E | C, PDA | IC2-LoM | N | L (–20.4) |
| 3 | F | 4.8 | 38 | +1.7 | +2.2 | - | 8 | S, LO, MO, E, OM, U | IC2-LoM | N | L (–12.1) | |
| 4 | M | 6.1 | 33 | +1.0 | +1.7 | - | 8 | S, O, P, E, T, OM | ASD, PS | IC2-LoM | N | L (–20.0) |
| 5 | F | 6.2 | 37 | +1.2 | +0.9 | - | 6 | S, LO, FN, E | PFO | IC2-LoM | N | L (–16.7) |
| 6 | M | 3.9 | 37 | NA | +2.0 | - | 5 | S, FN, E, U | IC2-LoM | N | L (–19.6) | |
| 7 | F | 1.2 | 28 | –1.6 | –0.5 | + | 4 | S, E, U | ASD | IC2-LoM | N | L (–10.2) |
| 8 | F | 10.5 | 39 | NA | +0.8 | - | 5 | S, O, E | ASD | IC2-LoM | N | L (–19.3) |
| 9 | F | 8.8 | 39 | +0.6 | +1.1 | - | 6 | S, LO, FN, E | MMD | IC2-LoM | N | L (–11.8) |
| 10 | F | 9.3 | 37 | 1.5 | +2.5 | - | 8 | S, O, LO, MO, T | IC2-LoM | N | L (–18.8) | |
| 11 | M | 7.1 | 39 | NA | +1.3 | - | 8 | S, O, LO, FN, P, OM | IC2-LoM | N | L (–19.0) | |
| 12 | F | 5.5 | 36 | +0.6 | +0.4 | - | 7 | S, LO, FN, E, U | IC2-LoM | N | L (–15.0) | |
| 13 | M | 8.8 | 40 | +0.9 | +1.7 | + | 7 | S, LO, FN, E, U | IC2-LoM | N | L (–16.9) | |
| 14 | F | 7.1 | 30 | +3.2 | +1.0 | + | 5 | S, E, OM, U | C, PS | IC2-LoM | N | L (–20.5) |
| 15 | F | 1.8 | 37 | –0.1 | +0.3 | - | 6 | S, O, FN, E | PFO, PS | IC2-LoM | N | L (–18.9) |
| 16 | M | 5.9 | 39 | +4.0 | +2.3 | - | 7 | S, LO, MO, E, T | IC2-LoM | N | L (–15.2) | |
| 17 | F | 6.3 | 37 | +1.6 | +1.5 | - | 3 | LO, FN | IC2-LoM | N | L (–7.7) | |
| 18 | M | 10.4 | 37 | NA | +3.0 | - | 7 | S, O, MO, P, E | PFO, VSD | IC2-LoM | N | L (–19.9) |
| 19 | F | 1.1 | 33 | +1.9 | +1.7 | - | 5 | S, O, E | ASD, PDA | IC2-LoM | N | L (–18.1) |
| 20 | M | 1.1 | 37 | NA | +2.2 | + | 4 | MO, FN, E, U | IC2-LoM | N | L (–15.2) | |
| 21 | F | 3.2 | 37 | NA | +1.2 | + | 5 | S, R, E | IC2-LoM | N | L (–19.1) | |
| 22 | M | 15.8 | 30 | NA | –0.6 | NA | 2 | LO | HS, ADHD | IC2-LoM | N | L (–10.8) |
| 23 | M | 14.7 | 40 | NA | –1.3 | NA | 2 | LO | IC2-LoM | N | L (–7.7) | |
| 24 | F | 8.9 | 33 | NA | +0.6 | NA | 2 | LO | IC2-LoM | N | L (–17.5) | |
| 25 | M | 0.6 | 31 | NA | +2.2 | - | 6 | S, O, MO, FN | Inguinal hernia | IC2-LoM | N | L (–18.3) |
| 26 | F | 0.2 | 37 | –0.2 | +1.8 | - | 5 | S, I, U | IC2-LoM | N | L (–10.9) | |
| 27 | M | 2.6 | 35 | +0.6 | +0.4 | - | 8 | S, LO, I, FN, U | patUPD (marginal) | H (+1.7) | L (–4.4) | |
| 28 | M | 5.6 | 39 | NA | –0.3 | - | 6 | S, LO, E, U | patUPD | H (+5.0) | L (–8.7) | |
| 29 | F | 0.8 | 40 | NA | +0.0 | - | 3 | LO, U | patUPD | H (+2.0) | L (–3.0) | |
| 30 | M | 3.8 | 37 | +1.8 | +2.5 | - | 4 | LO, MO, U | patUPD | H (+3.6) | L (–8.4) | |
| 31 | M | 8.9 | 39 | +0.5 | +0.9 | - | 5 | S, LO, FN | patUPD | H (+5.6) | L (–15.3) | |
| 32 | M | 3.7 | 38 | NA | +2.2 | - | 6 | LO, MO, FN, E, OM | RC, FSGS | patUPD | H (+3.7) | L (–7.9) |
| 33 | F | 8.5 | 34 | NA | +1.2 | - | 7 | I, A, NB, P, OM, U | patUPD | H (+7.0) | L (–17.3) | |
| 34 | F | 5.2 | 36 | –0.8 | +1.2 | - | 8 | S, O, LO, E, T | ASD, PDA, GV | patUPD | H (+5.8) | L (–10.8) |
| 35 | F | 5.0 | 40 | –0.2 | –0.9 | NA | 2 | LO | patUPD | H (+5.2) | L (–11.1) | |
| 36 | F | 3.5 | 36 | +0.9 | +1.7 | - | 3 | LO, U | VSD, PS | patUPD | H (+4.9) | L (–10.5) |
| 37 | M | 6.8 | 39 | +3.8 | +1.6 | - | 2 | LO | patUPD | H (+5.2) | L (–11.7) | |
| 38 | M | 8.0 | 37 | +2.9 | +2.8 | - | 8 | S, MO, P, E, T, OM, U | VSD, AP | IC1-GoM | H (+6.3) | N |
| 39 | M | 5.4 | 35 | NA | +4.4 | - | 5 | S, MO, P, OM | CNV (dup)* | H (+2.5) | L (–7.3) | |
| 40 | M | 5.2 | 36 | +0.6 | +1.1 | - | 7 | S, O, FN, E, OM | PS, RC, BU | N† | N | N |
*A 4.0-Mb duplication was detected at chromosome 11p15.5p15.4; †CDKN1C mutation was revealed in this case.
Abbreviations: SDS, SD score; ART, assisted reproductive technique; BWS, Beckwith–Wiedemann syndrome; MS-MLPA, methylation-specific multiplex ligation-dependent probe amplification; IC1, imprinting center 1; IC2, imprinting center 2; F, female; LO, lateralized overgrowth; E, ear anomalies; LoM, loss of methylation; N, normal; L, low; M, male; S, macroglossia; O, exomphalos; MO, macrosomia; C, cleft palate; PDA, patent ductus arteriosus; OM, organomegaly; U, umbilical hernia and/or diastasis recti; P, polyhydramnios and/or placentomegaly; T, transient hypoglycemia; ASD, atrial septal defect; PS; pulmonary stenosis; FN, facial nevus simplex; PFO, patent ductus arteriosus; NA, not available; MMD, moyamoya disease; VSD, ventricular septal defect; R, nephrogenic rest; HS, hypospadia; ADHD, attention deficit hyperactivity disorder; I, hyperinsulinism; patUPD, paternal uniparental disomy; H, high; RC, renal cyst; FSGS, focal segmental glomerulosclerosis; A, adrenal hyperplasia; NB, nesidioblastosis; GV, genu valgum; AP, arched palate; GoM, gain of methylation; CNV, copy number variant; dup, duplication; BU, bifid uvula.
![]()
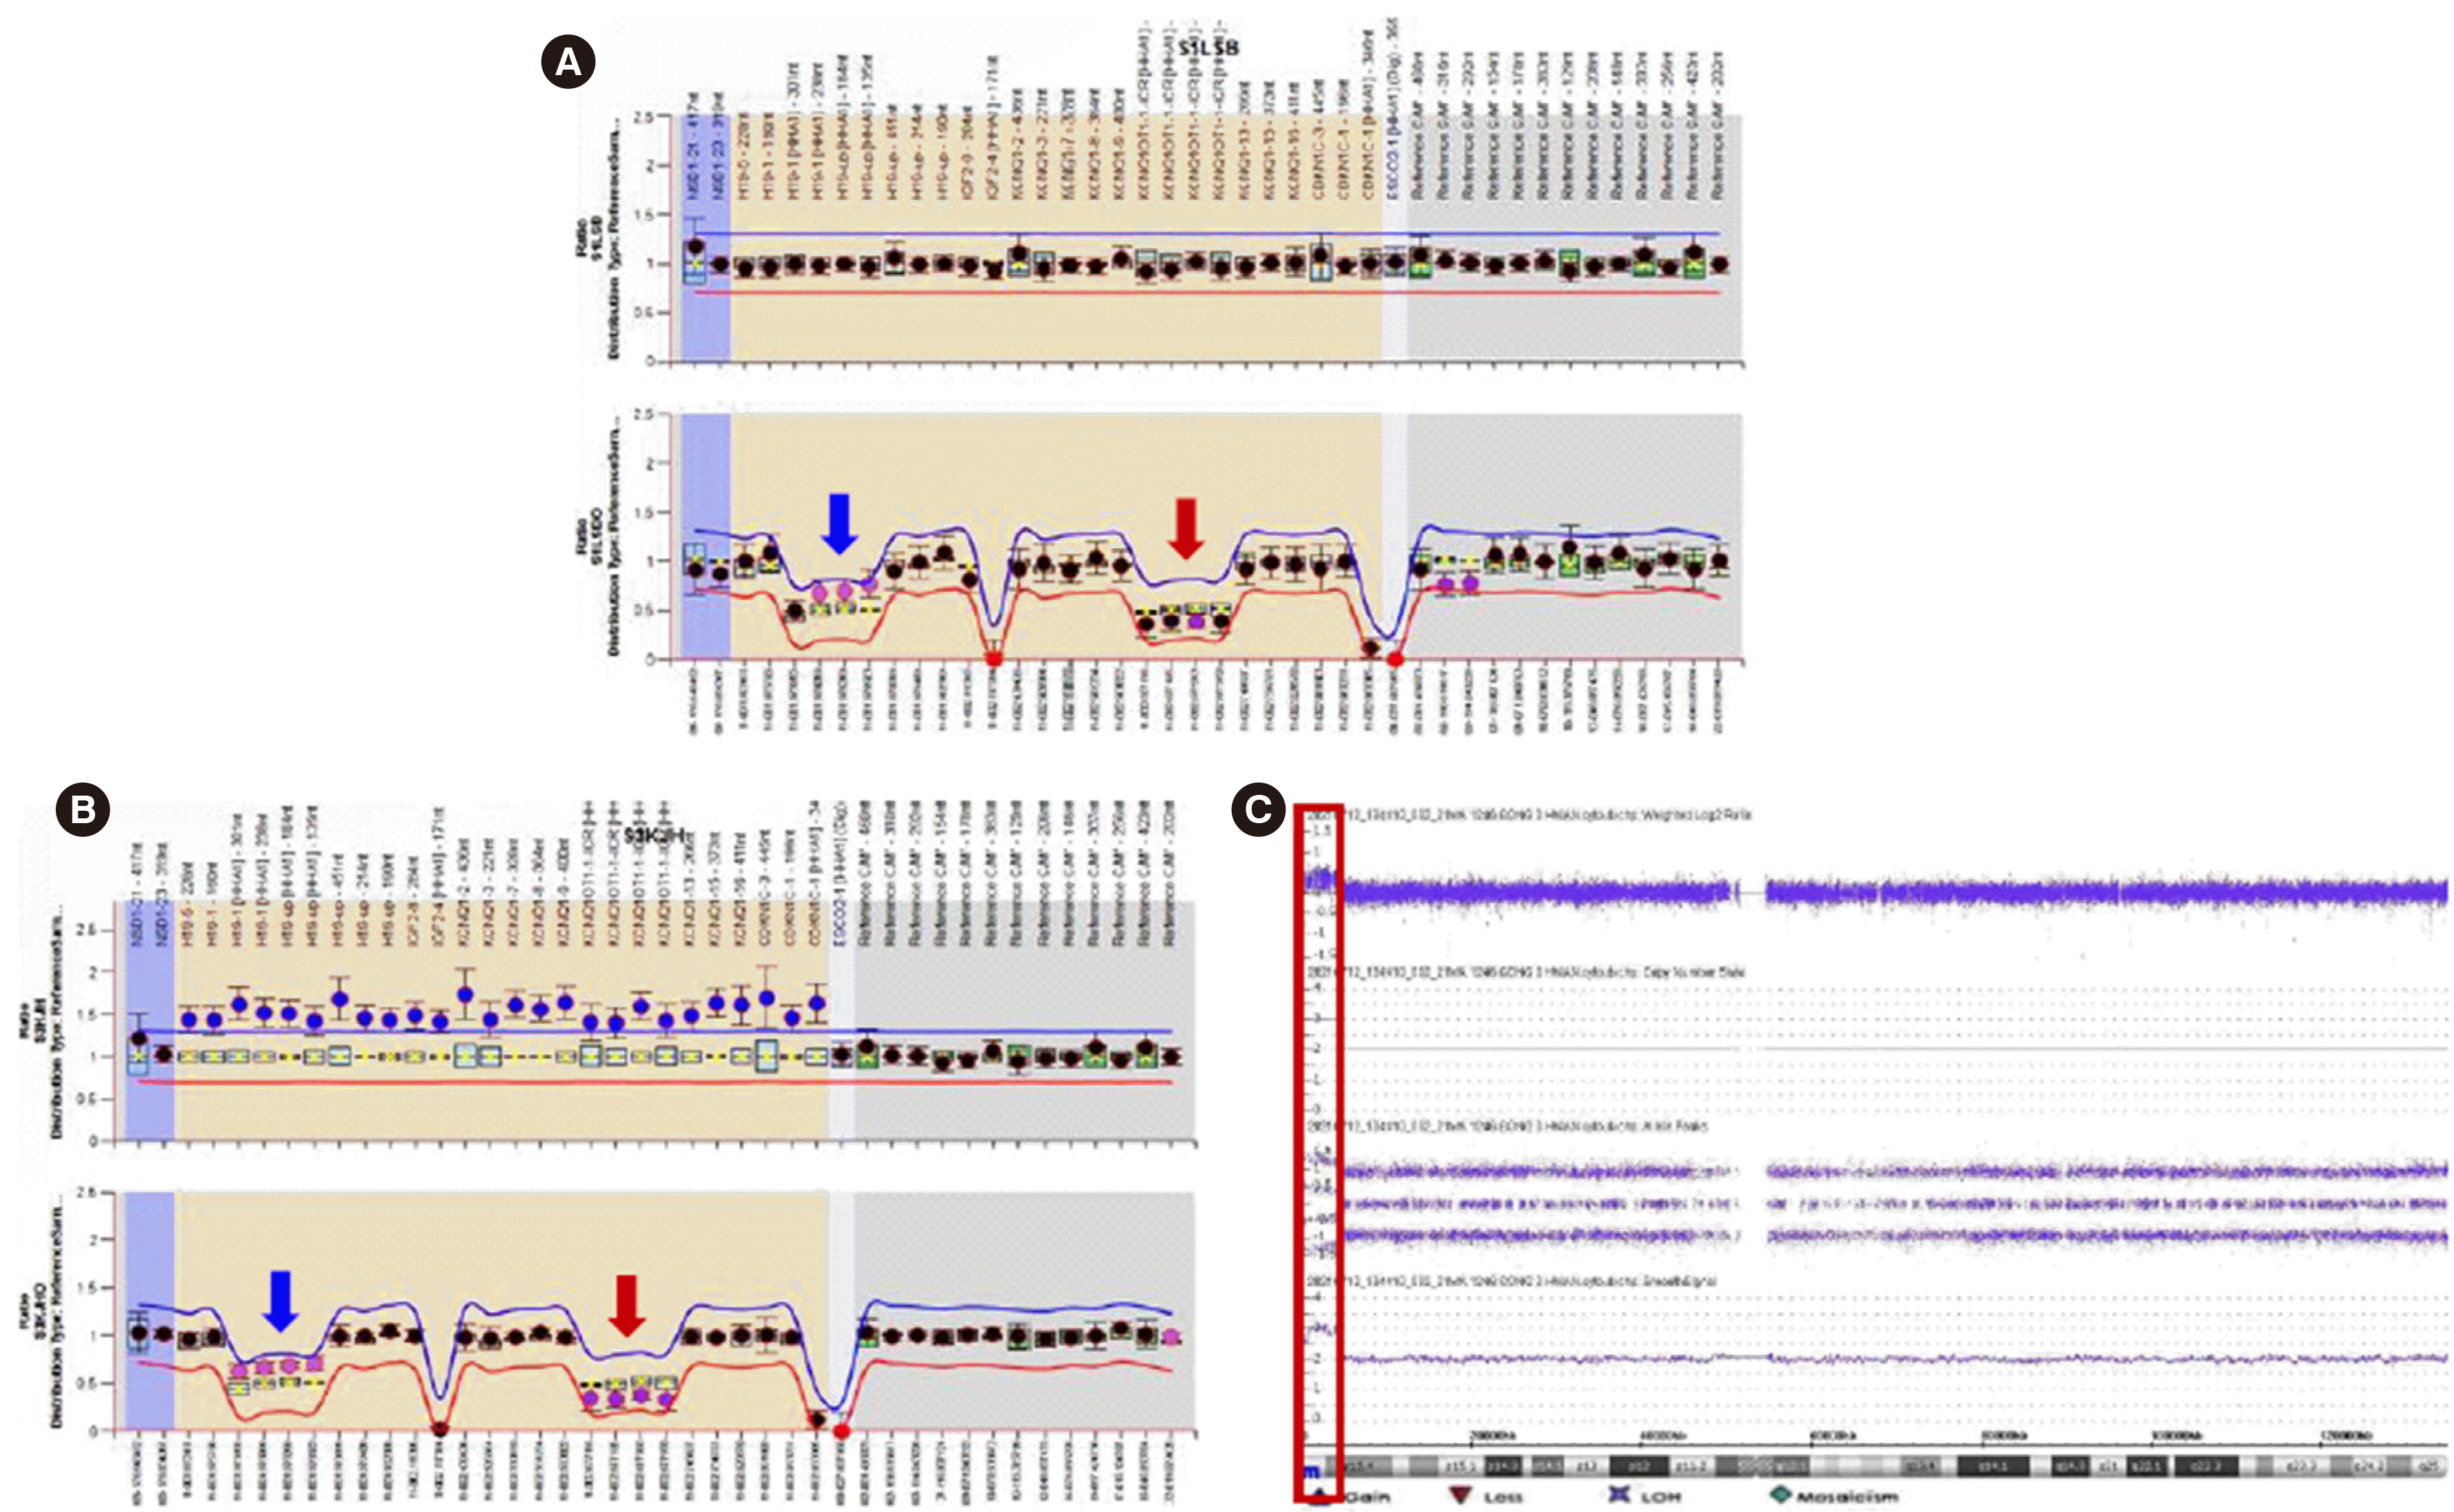
Epigenotype analysis
Fig. 2
![]()
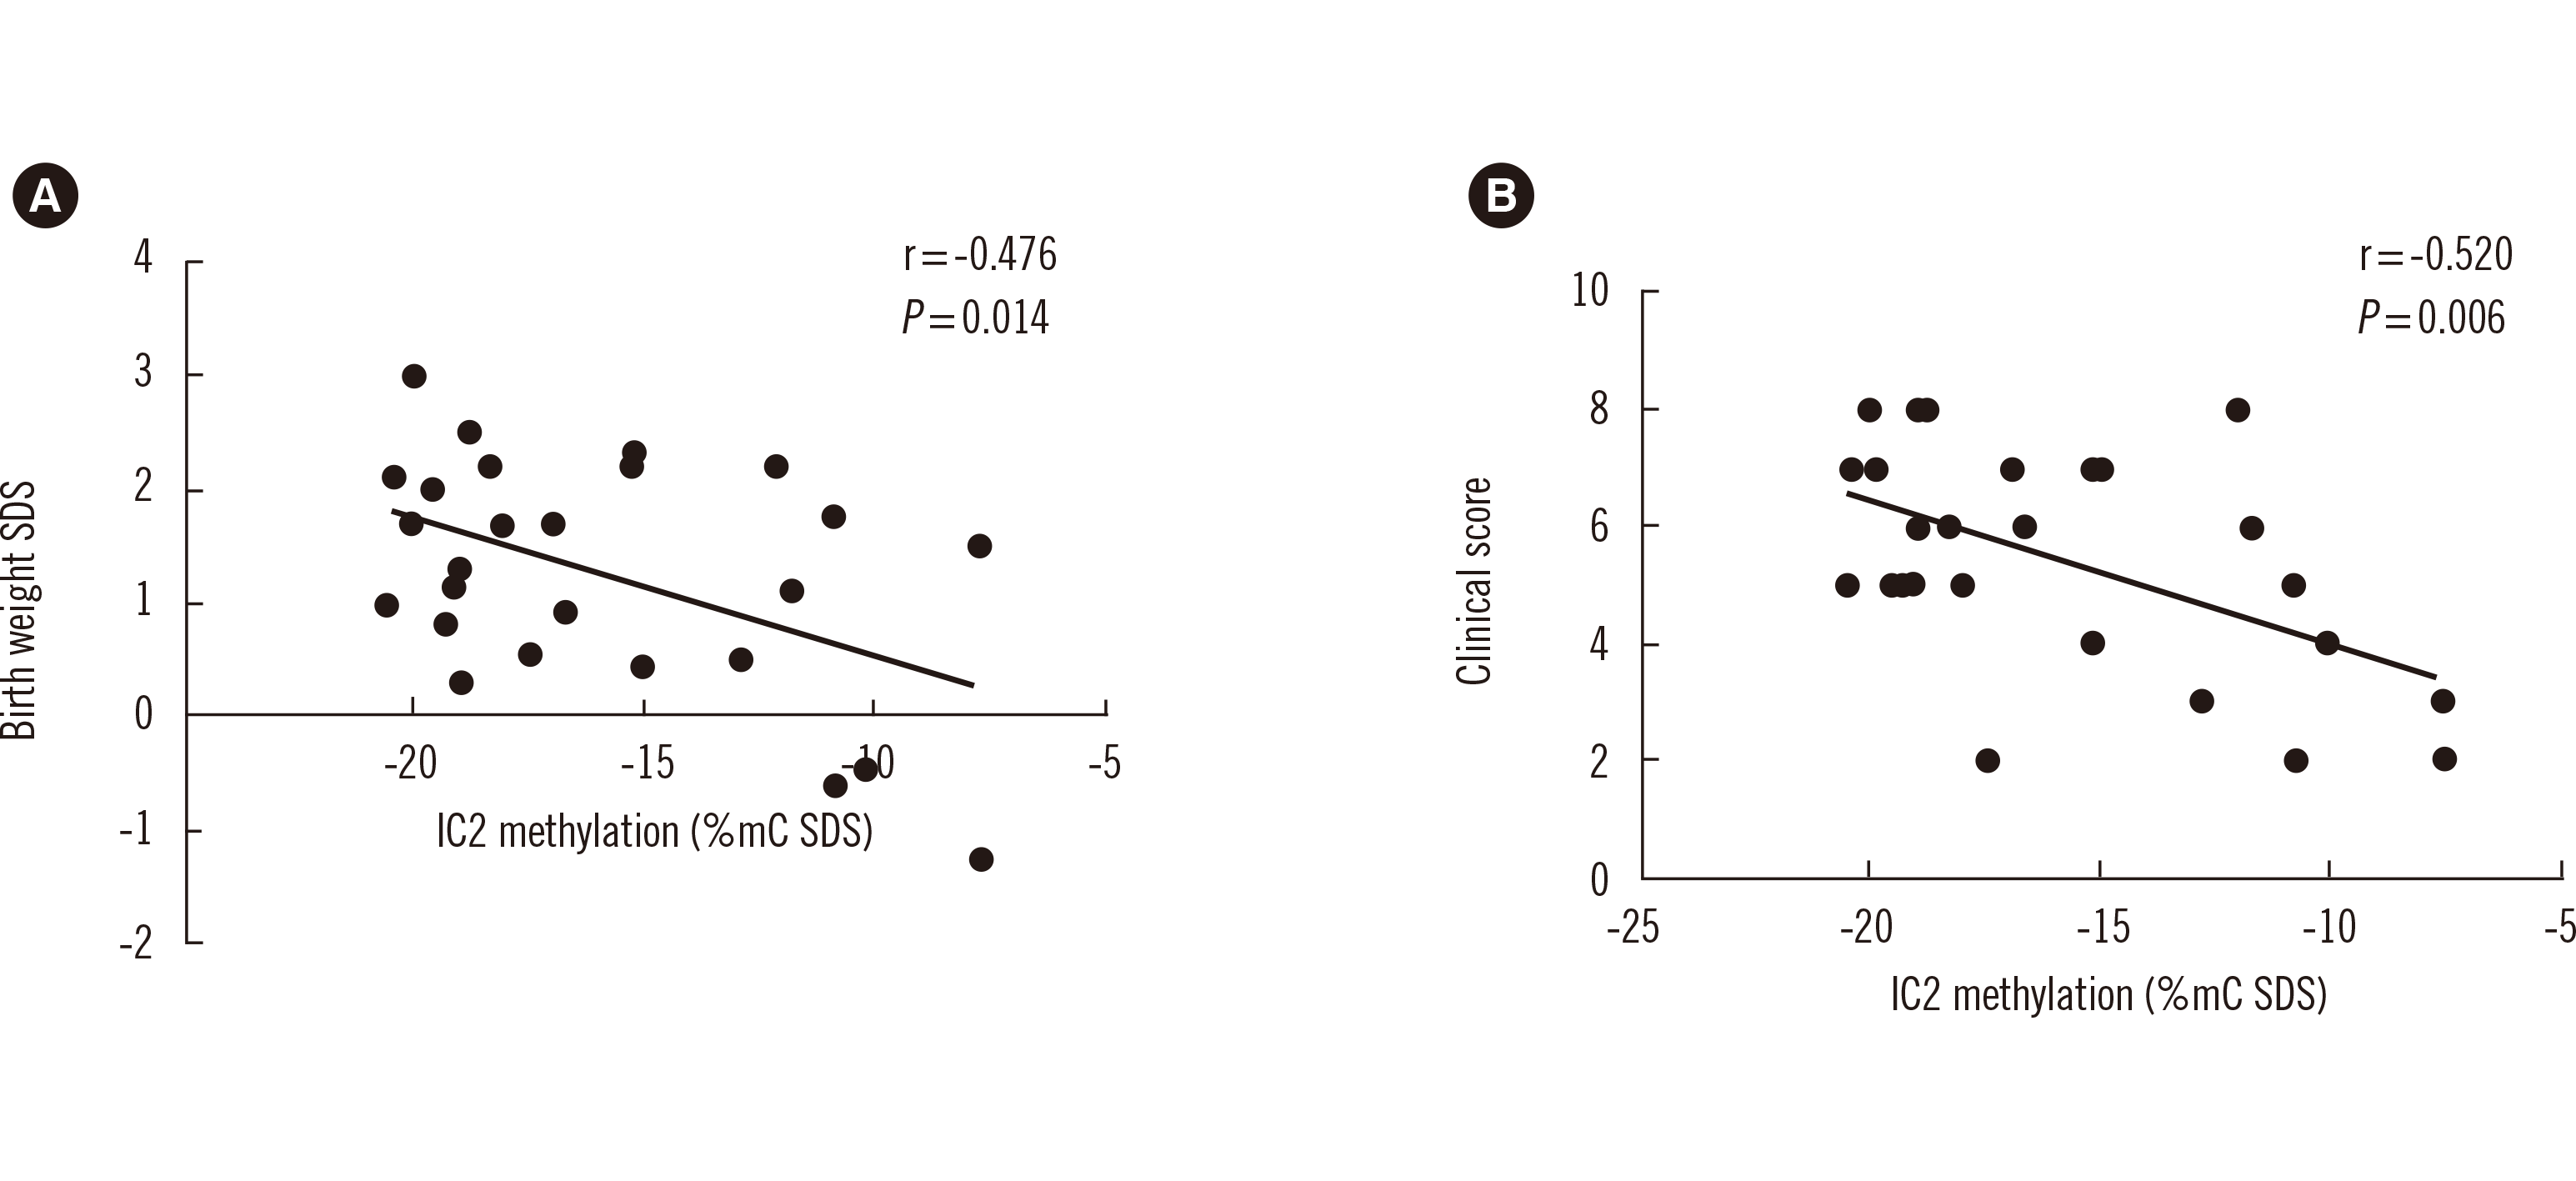
Epigenotype–phenotype correlations
Table 3
| Characteristics | Overall (N = 40) | IC2-LoM (N = 26) | patUPD (N = 11) | P |
|---|---|---|---|---|
| ART, N (%) | 6 (15.0) | 6 (26 1) | 0 (0.0) | 0.011 |
| Paternal age at conception (yr) | 37.8 ± 4.5 | 39.3 ± 4.7 | 35.1 ± 3.3 | 0.029 |
| Maternal age at conception (yr) | 34.5 ± 4.2 | 35.5 ± 4.6 | 32.9 ± 2.9 | 0.129 |
| Birth length (SDS) | +1.1 ± 1.4 | +1.1 ± 1.3 | +0.9 ± 1.5 | 0.871 |
| Birth weight (SDS) | +1.3 ± 1.1 | +1.2 ± 1.0 | +1.0 ± 1.1 | 0.431 |
| Head circumference at birth (SDS) | +0.7 ± 0.7 | +0.6 ± 0.6 | +0.7 ± 0.7 | 0.840 |
| Age at last visit (yr) | 5.8 ± 3.6 | 6.0 ± 4.2 | 4.9 ± 2.4 | 0.424 |
| Height at last visit (SDS) | +1.1 ± 1.1 | +1.2 ± 1.1 | +0.4 ± 0.8 | 0.030 |
| Weight at last visit (SDS) | +1.0 ± 1.3 | +1.0 ± 1.4 | +0.6 ± 1.0 | 0.301 |
| Head circumference at last visit (SDS) | +0.0 ± 0.0 | +0.0 ± 0.0 | +0.0 ± 0.0 | 0.670 |
| Clinical score | 5.4 ± 2.0 | 5.4 ± 1.9 | 4.9 ± 2.3 | 0.485 |
| Macroglossia, N (%) | 27 (67.5) | 20 (76.9) | 4 (36.4) | 0.028 |
| Exomphalos, N (%) | 11 (27.5) | 9 (34.6) | 1 (9.1) | 0.224 |
| Lateralized overgrowth, N (%) | 23 (57.5) | 13 (50.0) | 10 (90.9) | 0.019 |
| Wilms tumor or nephroblastomatosis, N (%) | 1 (2.5) | 1 (3.8) | 0 (0.0) | 1.000 |
| Hyperinsulinism, N (%) | 3 (7.5) | 1 (3.8) | 2 (18.2) | 0.205 |
| Pathology*, N (%) | 1 (2.5) | 0 (0.0) | 1 (9.1) | 0.297 |
| Macrosomia (birthweight > 2 SDS), N (%) | 11 (27.5) | 7 (26.9) | 2 (18.2) | 0.695 |
| Facial nevus simplex, N (%) | 14 (35.0) | 11 (42.3) | 3 (27.3) | 0.477 |
| Polyhydramnios or placentomegaly, N (%) | 7 (17.5) | 6 (23.1) | 1 (9.1) | 0.649 |
| Ear creases or pits, N (%) | 23 (57.5) | 18 (69.2) | 3 (27.3) | 0.030 |
| Transient hypoglycemia, N (%) | 5 (12.5) | 3 (11.5) | 1 (9.1) | 1.000 |
| Nephromegaly or hepatomegaly, N (%) | 8 (20.0) | 3 (11.5) | 2 (18.2) | 0.623 |
| Umbilical hernia or diastasis recti, N (%) | 15 (37.5) | 8 (30.8) | 6 (54.5) | 0.173 |
![]()
Fig. 3
![]()
 XML Download