Journal List > Ann Lab Med > v.42(6) > 1516078797

Gu, Lee, Hong, Lee, Yun, Chun, Lee, and Min: Practical Considerations for Clinical Laboratories in Top-down Approach for Assessing the Measurement Uncertainty of Clinical Chemistry Analytes

Abstract

Background

The top-down (TD) approach using internal quality control (IQC) data is regarded a practical method for estimating measurement uncertainty (MU) in clinical laboratories. We estimated the MU of 14 clinical chemistry analytes using the TD approach and evaluated the effect of lot changes on the MU.

Methods

MU values were estimated using subgrouping by reagent lot changes or using the data as a whole, and both methods were compared. Reagent lot change was simulated using randomly generated data, and the mean values and MU for two IQC datasets (different QC material lots) were compared using statistical methods.

Results

All MU values calculated using subgrouping were lower than the total values; however, the average differences were minimal. The simulation showed that the greater the increase in the extent of the average shift, the larger the difference in MU. In IQC data comparison, the mean values and MU exhibited statistically significant differences for most analytes. The MU calculation methods gave rise to minimal differences, suggesting that IQC data in clinical laboratories show no significant shift. However, the simulation results demonstrated that notable differences in the MU can arise from significant variations in IQC results before and after a reagent lot change. Additionally, IQC material lots should be treated separately when IQC data are collected for MU estimation.

Conclusions

Lot changes in IQC data are a key factor affecting MU estimation and should not be overlooked during MU estimation.

INTRODUCTION

Measurement uncertainty (MU) is a concept commonly used in various industries and engineering fields but not in clinical laboratories [1]. As the importance of standardization and traceability of test results is increasing, MU is likely to become an important issue in laboratory quality management [2-4].
Since the Guide to the Expression of Uncertainty in Measurement (GUM) was published in 1996 [5], the bottom-up approach is the standard method for estimating MU. This approach involves the identification of all sources of uncertainty in the measurement procedure, estimation of their magnitudes, and calculation of the combined uncertainty according to the law of error propagation [5]. However, the MU guidelines for clinical laboratories recommend that the top-down (TD) approach is practical and particularly well-suited to closed measuring systems, which are common in routine clinical laboratories [6, 7]. For most measuring systems in clinical laboratories, the most significant uncertainty contributions to the overall MU are (1) long-term imprecision data obtained for internal quality control (IQC) materials for a period sufficient to include all changes to measuring conditions (uRw, within-laboratory reproducibility); (2) uncertainty of the end-user calibrator (ucal) obtained from the manufacturer or established by a laboratory with its own measuring system; and (3) bias correction, if a medically unacceptable measurement bias exists [4, 6, 7].
Identifying the sources of uncertainty may be the first step in estimating the MU of a measurement system. Various measurement factors, such as sample inhomogeneity, reconstitution procedures for lyophilized materials, reagent and calibrator instability, fluctuations in the laboratory environment, operator bias, routine instrument maintenance, lot changes for calibrators and reagents, and different operators, are common sources of MU [5-9]. It is presumed that IQC data cover all anticipated routine changes in the measuring system for an appropriate period [6, 7, 10]. When repeatability or long-term imprecision data for a well-controlled measurement procedure are plotted as a Gaussian distribution, the magnitude of the dispersion of values around the mean value can be quantified by calculating the standard deviation (SD) [6, 7, 10]. Standard uncertainty can be expressed as SD. Because SD or u values cannot be added or subtracted, relative standard uncertainties (urel) first have to be converted to their respective variances (SD2 and CV2) in calculations [6, 7, 10].
Among the various MU factors mentioned above, reagent lot changes are important factors that may cause a shift in IQC values, leading to MU overestimation [7]. Therefore, it is recommended that both IQC and human sample results demonstrate similar behaviors upon a reagent lot change [7]. If IQC values obtained before and after lot change are treated as a single dataset for uRw calculation, MU may be overestimated. Practical considerations for when a shift occurs after a reagent lot change are reported in several guidelines [7]. However, more specific recommendations are needed, e.g., a “significant change” upon a reagent lot change has to be clearly defined. In addition, the extent of differences that such considerations can bring about when MU is calculated using real-world IQC data should be demonstrated.
In this regard, we estimated MU by the TD approach using long-term IQC data generated in our laboratory to demonstrate how reagent lot changes influence uncertainty.

MATERIALS AND METHODS

Materials

IQC values were collected from March 2020 to February 2021. During this period, only one IQC lot (No. 28870) was used for data analysis. IQC data of 14 analytes (serum albumin, alkaline phosphatase [ALP], ALT, AST, HDL, LDL, total cholesterol, creatinine, glucose, total protein, triglyceride, potassium, sodium, and blood urea nitrogen [BUN]) were collected. We used a single chemistry measurement system (Cobas 8000 c702; Roche Diagnostics, Rotkreuz, Switzerland) and two concentration levels of IQC materials (Lyphochek Assayed Chemistry Control Levels 1 and 2; Bio-Rad, Hercules, CA, USA), including multiple reagent lots during the study period (mean, 3.14; range, 2-4). Traceability and calibrator uncertainty for each analyte are summarized in Supplemental Data Table S1.

MU estimation by different calculation methods using 1-year IQC data

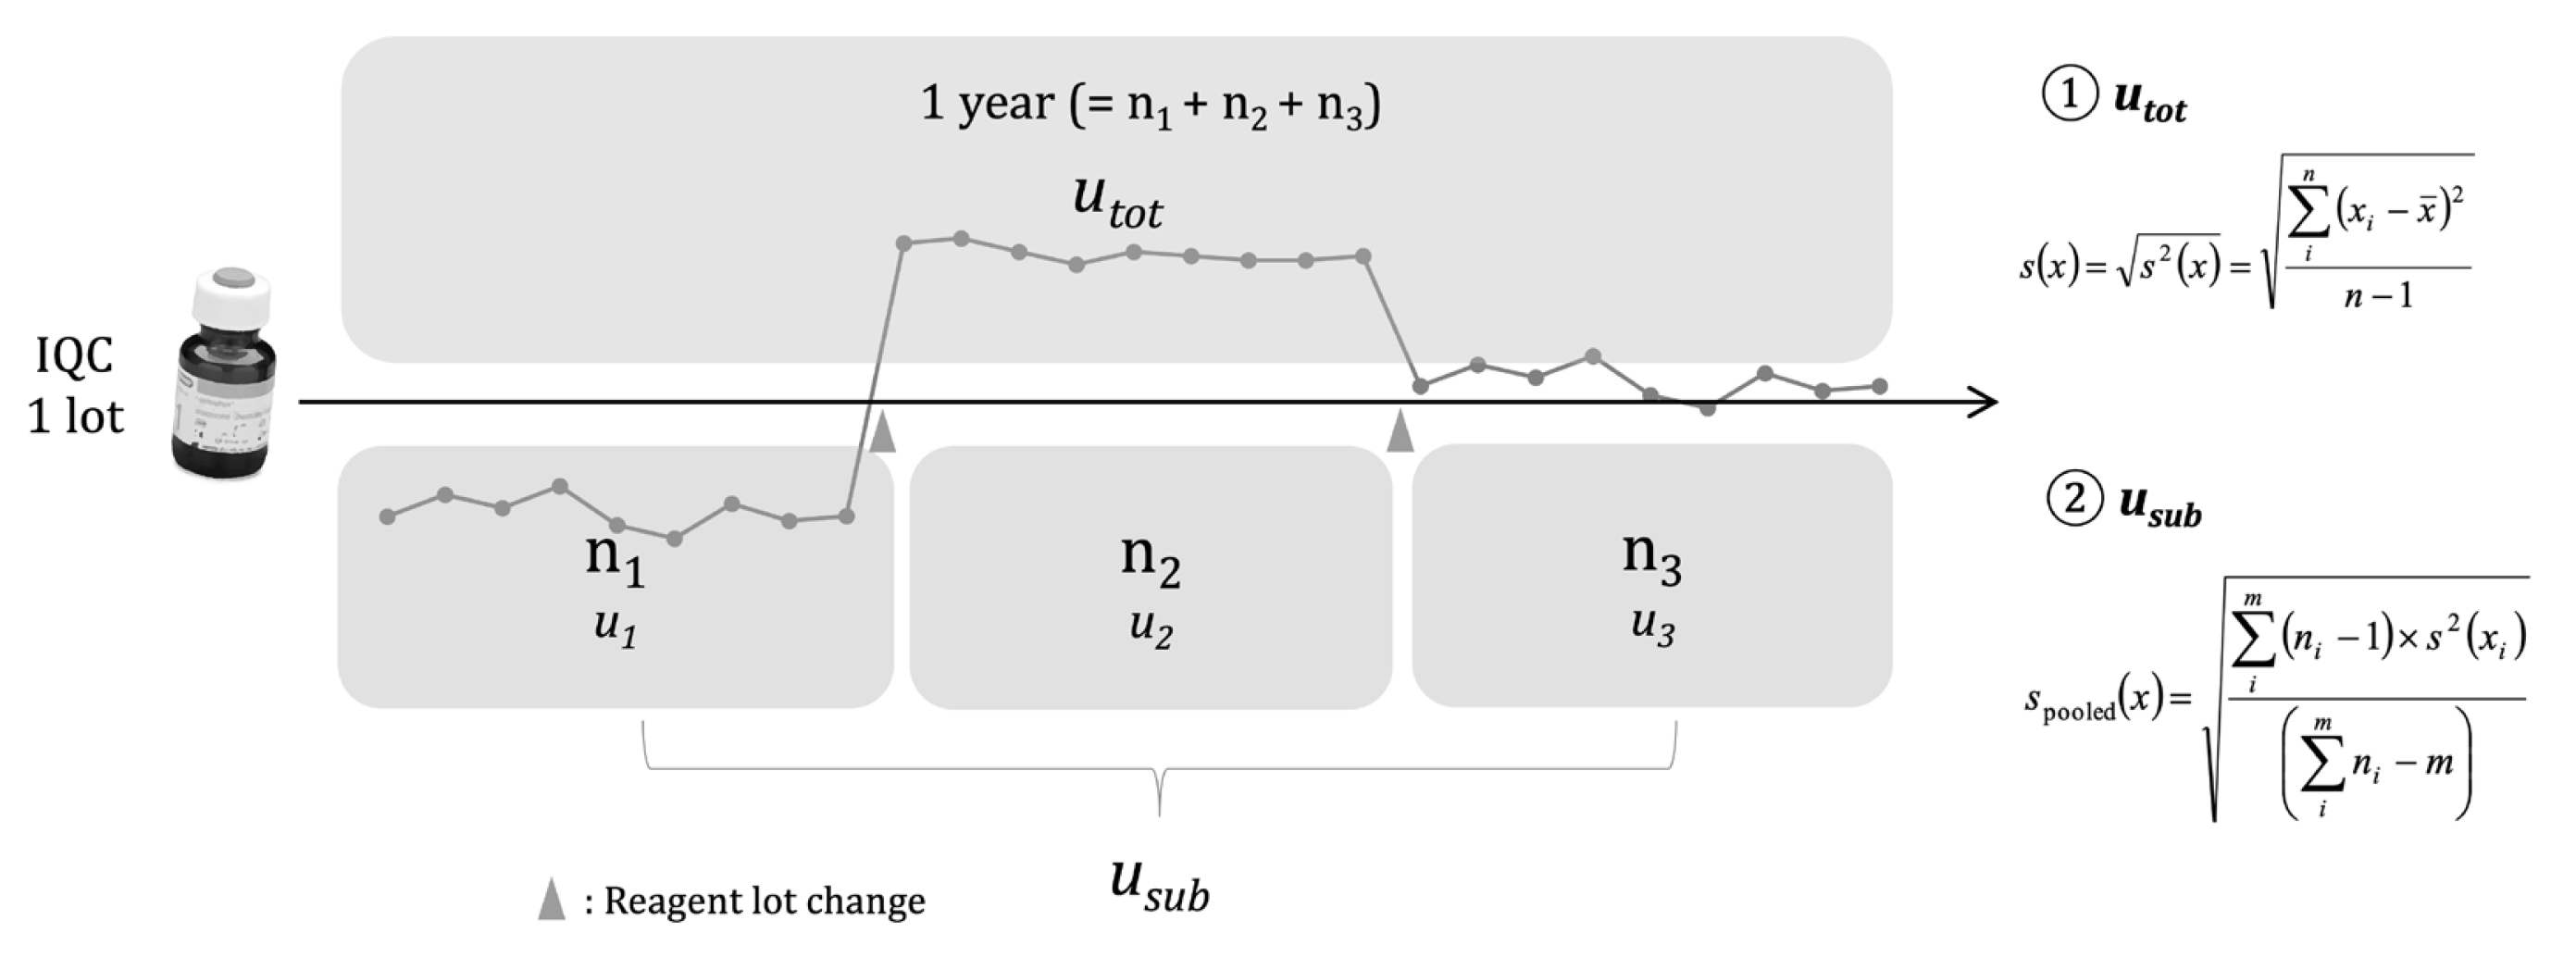
To demonstrate the influence of the calculation method on uncertainty, we used two methods to calculate MU (uRw) values (Fig. 1):
1) According to equation (1), the total uncertainty (utot) was calculated as the SD, regardless of reagent lot changes [6, 7].
2) IQC values before and after a reagent lot change were collected separately according to lot number, and uRw values calculated for each data subgroup were combined to obtain the overall uncertainty (subgrouping uncertainty, usub) according to equation (2) [6, 7, 10].
Basically, the calculated uRw values were combined with the uncertainty of end-user calibrator values and bias uncertainty. The combined MU values were obtained according to equation (3) [7]:
(3)
uc=u(y)=(uRW2+ucal2+ubias2
where uc is combined uncertainty, uRw is the standard uncertainty obtained by repetitive measurement, ucal is the uncertainty of end-user calibrator, and ubias is the uncertainty of bias.
Bias correction is one of the most significant steps in estimating MU. We assessed the external quality assessment (EQA) results for the last two years to evaluate whether medically unacceptable bias was detected. We assumed that the end-user manufacturing process includes the correction of medically significant bias relative to the highest-order references used [4]. As there were no unacceptable results in the past two-year EQA results, we could adopt equation (4) from the ISO/TS 20419:2019 guidelines to obtain combined uncertainty [7]:
(4)
uc=u(y)=(uRW2+ucal2)(if bias is within specification)
The calculated uRw values were combined with the uncertainty of end-user calibrator values to obtain expanded uncertainty [6, 7]:
(5)
U=u(y)×k(k,coverage factor; k=2,95%confidence interval)
All combined uncertainty (uc) values were multiplied by 2 (coverage factor, k=2) (equation 5). The expanded uncertainty values were expressed as the standard expanded uncertainty (U) with their units and relative expanded uncertainty (%Urel) [6, 7, 10].
When a new reagent lot is introduced, any change in IQC results should be matched by a change in values obtained for a panel of typical human samples of equal magnitude [7]. For new reagent lot validation, we measured three QC samples at two levels and five human samples with various concentrations encompassing the reference interval concentration of each analyte. The human samples were verified using a current (old) and a new reagent to check the consistency of the results (Supplemental Data Table S2). The study was exempted from approval from the Institutional Review Board (IRB No. S2022-0370-0001) given the study’s design.

Monte Carlo simulation (MCS) of a reagent lot change using artificial IQC data

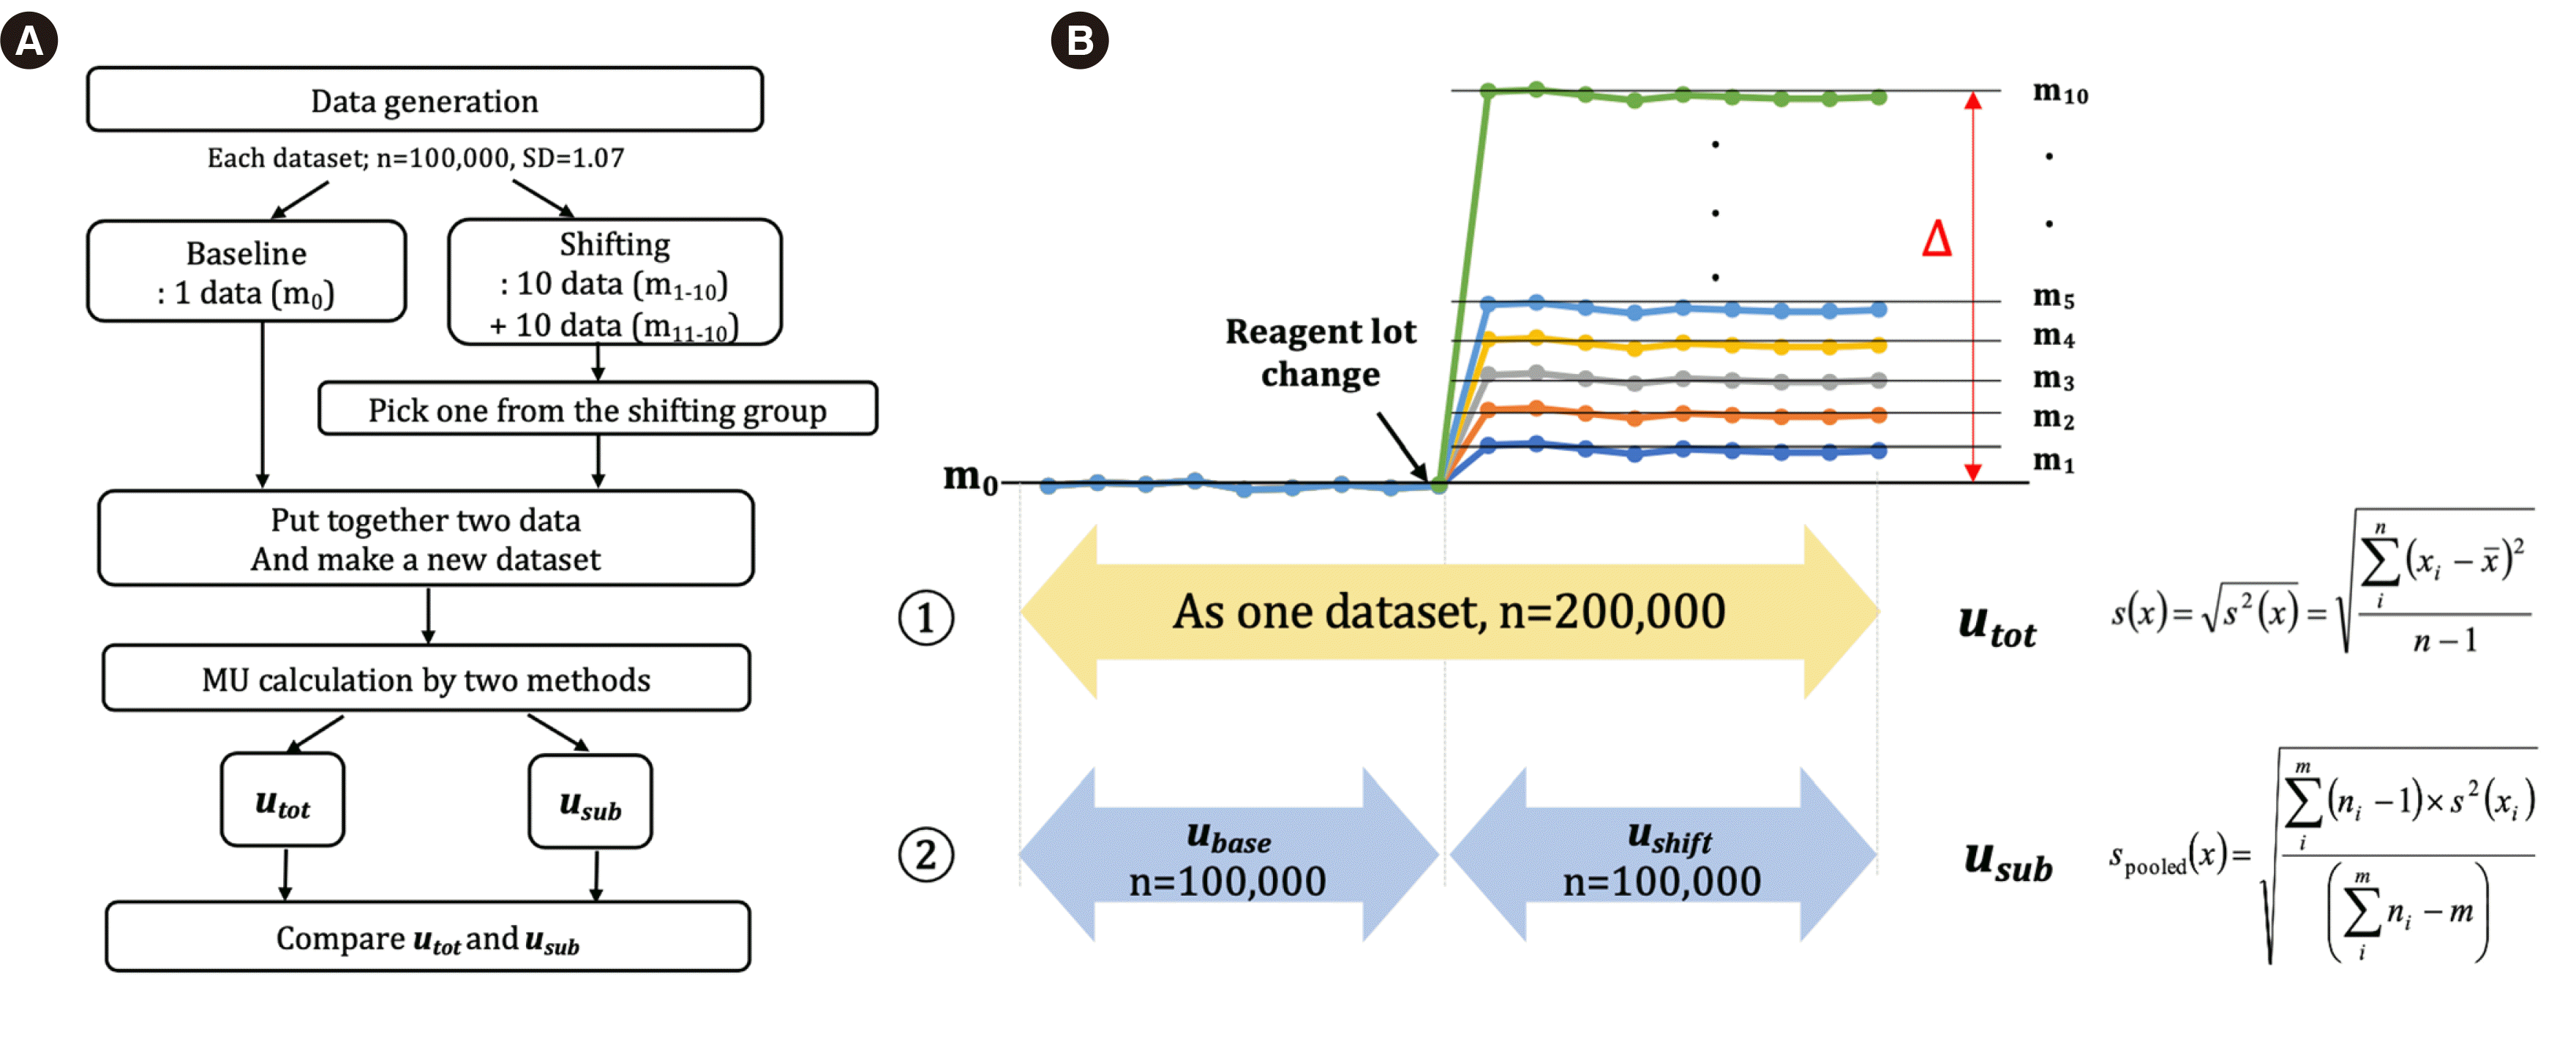
A shift in artificial IQC data due to a reagent lot change was simulated to show differences in MU depending on the degree of shift and the calculation method (Fig. 2A). MCS was used to demonstrate how a shift in IQC data may significantly affect MU evaluation. MCS uses algorithmically produced pseudo-random numbers that follow a specified probability distribution. The dispersion of random integers in a normal distribution is predefined by the stated mean and SD. The MCS method creates a random numeric number from the probability distribution function for each input. It generates numeric values for all inputs to the known functional relationship, which are utilized to generate a single numeric value as an output. This is repeated a sufficient number of times (“trials”) to provide a collection of simulated results as an output. The measurand and its standard uncertainty are then estimated using the mean and SC of the output results.
Following this procedure, multiple datasets were generated using a random number generator with the same SD, but different means. Each dataset included 100,000 random numbers. The simulation demonstrated various degrees of shift in IQC data upon a reagent lot change. First, a baseline IQC dataset (baseline; m0=100; SD=1.7; N=100,000) was generated. Then, 20 shifted IQC datasets with the same SD as the baseline data, but different mean shifts, were generated (m1 to m10: 1%, 2%, 4%, 6%, 8%, 10%, 12.5%, 15, 17.5%, 20% higher than m0 and m11 to m20: 1%, 2%, 4%, 6%, 8%, 10%, 12.5%, 15%, 17.5%, and 20% lower than m0 (SD=1.7, N=100,000 each). The baseline data and one subset from the shifted dataset were combined (baseline-shifted) to generate a new dataset. Then, we calculated and compared the uncertainties using two methods [6, 7]. In the first method, uncertainty was calculated regardless of a mean change, and in the second method, uncertainties were calculated separately according to the mean and then combined using equation (6) [6, 7, 10] (Fig. 2B).

Comparison of two IQC datasets from different QC material lots

Two sets of IQC data from different QC material lots, which were used consecutively for a year from March 2019 to February 2021, were comparatively analyzed.

Outlier elimination

Values outside 1.5 times the interquartile range were eliminated as outliers using Tukey’s fences [11].

Statistical analysis

Basic calculations for MU and data analyses, including Tukey’s fences, MCS, t-tests, and F-tests, were performed using Microsoft Excel 365 (Microsoft, Redmond, WA, USA). Data normality and distribution skewness and kurtosis were analyzed using RStudio (PBC, Boston, MA, USA). An absolute skewness value ≤2 or an absolute kurtosis (excess) ≤4 was used as a threshold for determining considerable normality [12, 13].

RESULTS

Comparison of MU data obtained via different calculation methods using 1-year IQC data

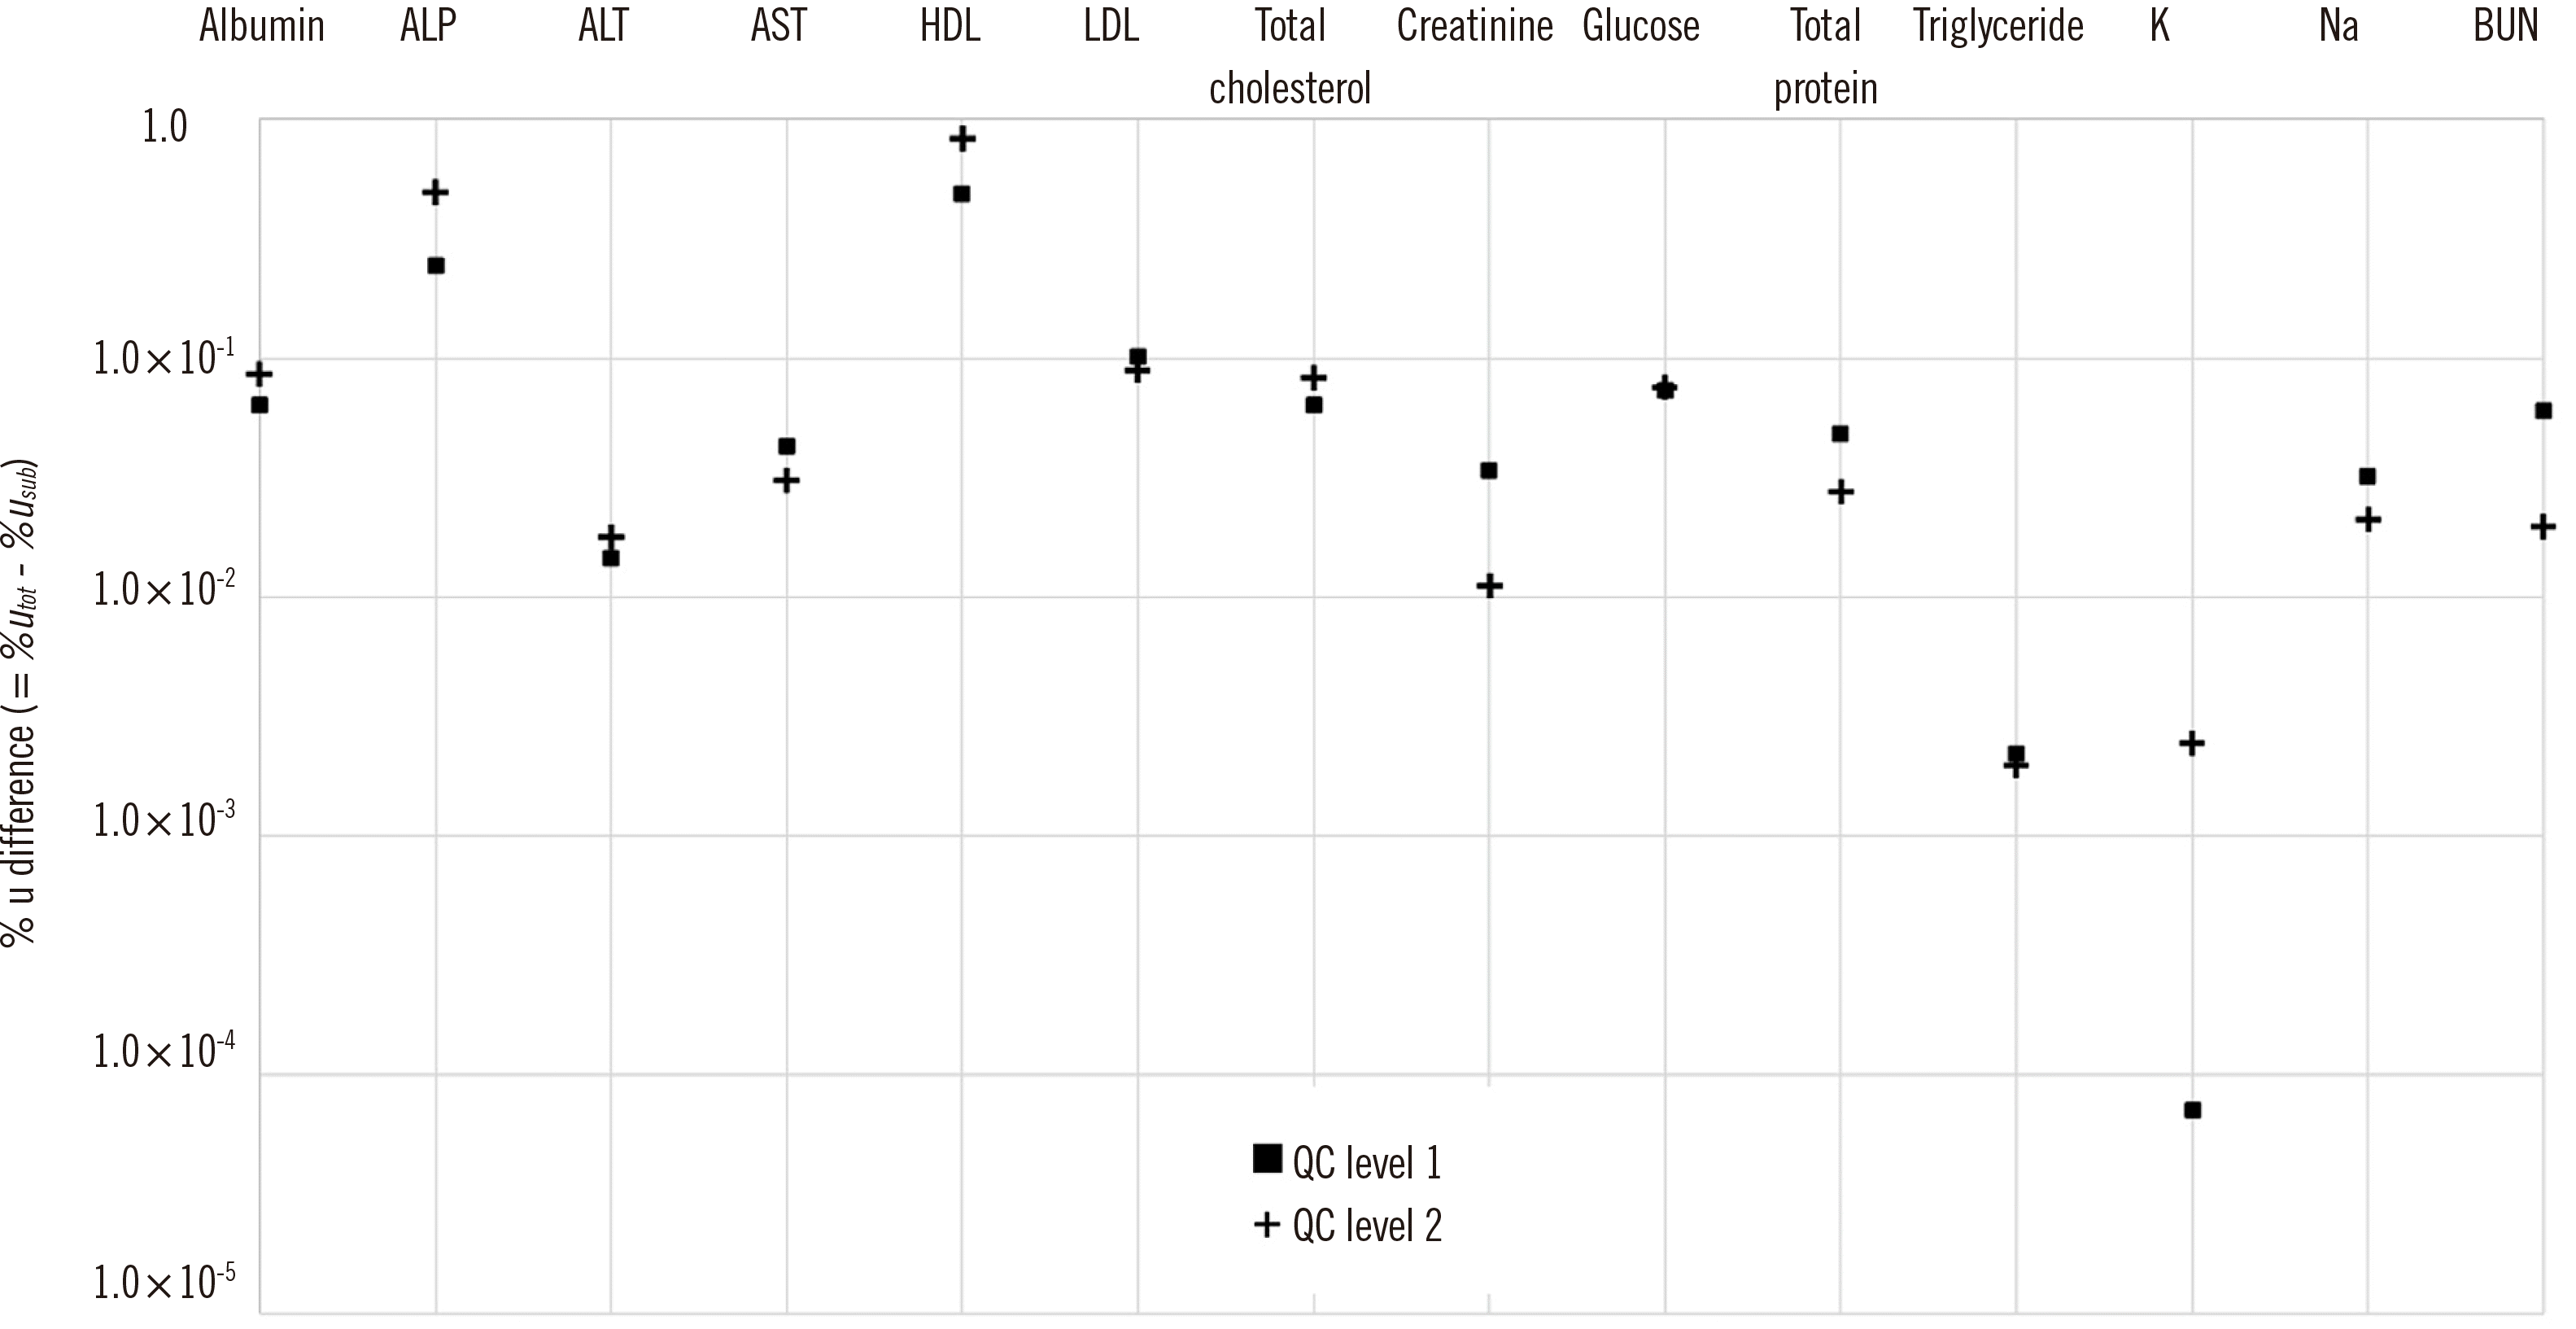
During the one-year study period, the mean number of IQC evaluations performed for each item was 1,087.9 (range, 1,049-1,296). All %Urel values calculated by subgrouping (%Urel_sub) were lower than the values calculated as a whole (%Urel_tot); the mean values of %Urel_sub and %Urel_tot were 5.45 and 5.62 at level 1 and 4.95 and 5.07 at level 2, respectively (Table 1). The entire calculation process and MU values for each analyte are listed in Supplemental Data Table S3 (A-N). The mean MU differences (%, %Urel_sub−%Urel_tot) were -0.13% at level 1 (range, -0.88 to -2.43×10⁻⁵%) and -0.12% at level 2 (range, -0.77 to -2.20×10⁻⁵%; Fig. 3).

MCS of a reagent lot change using artificial IQC data

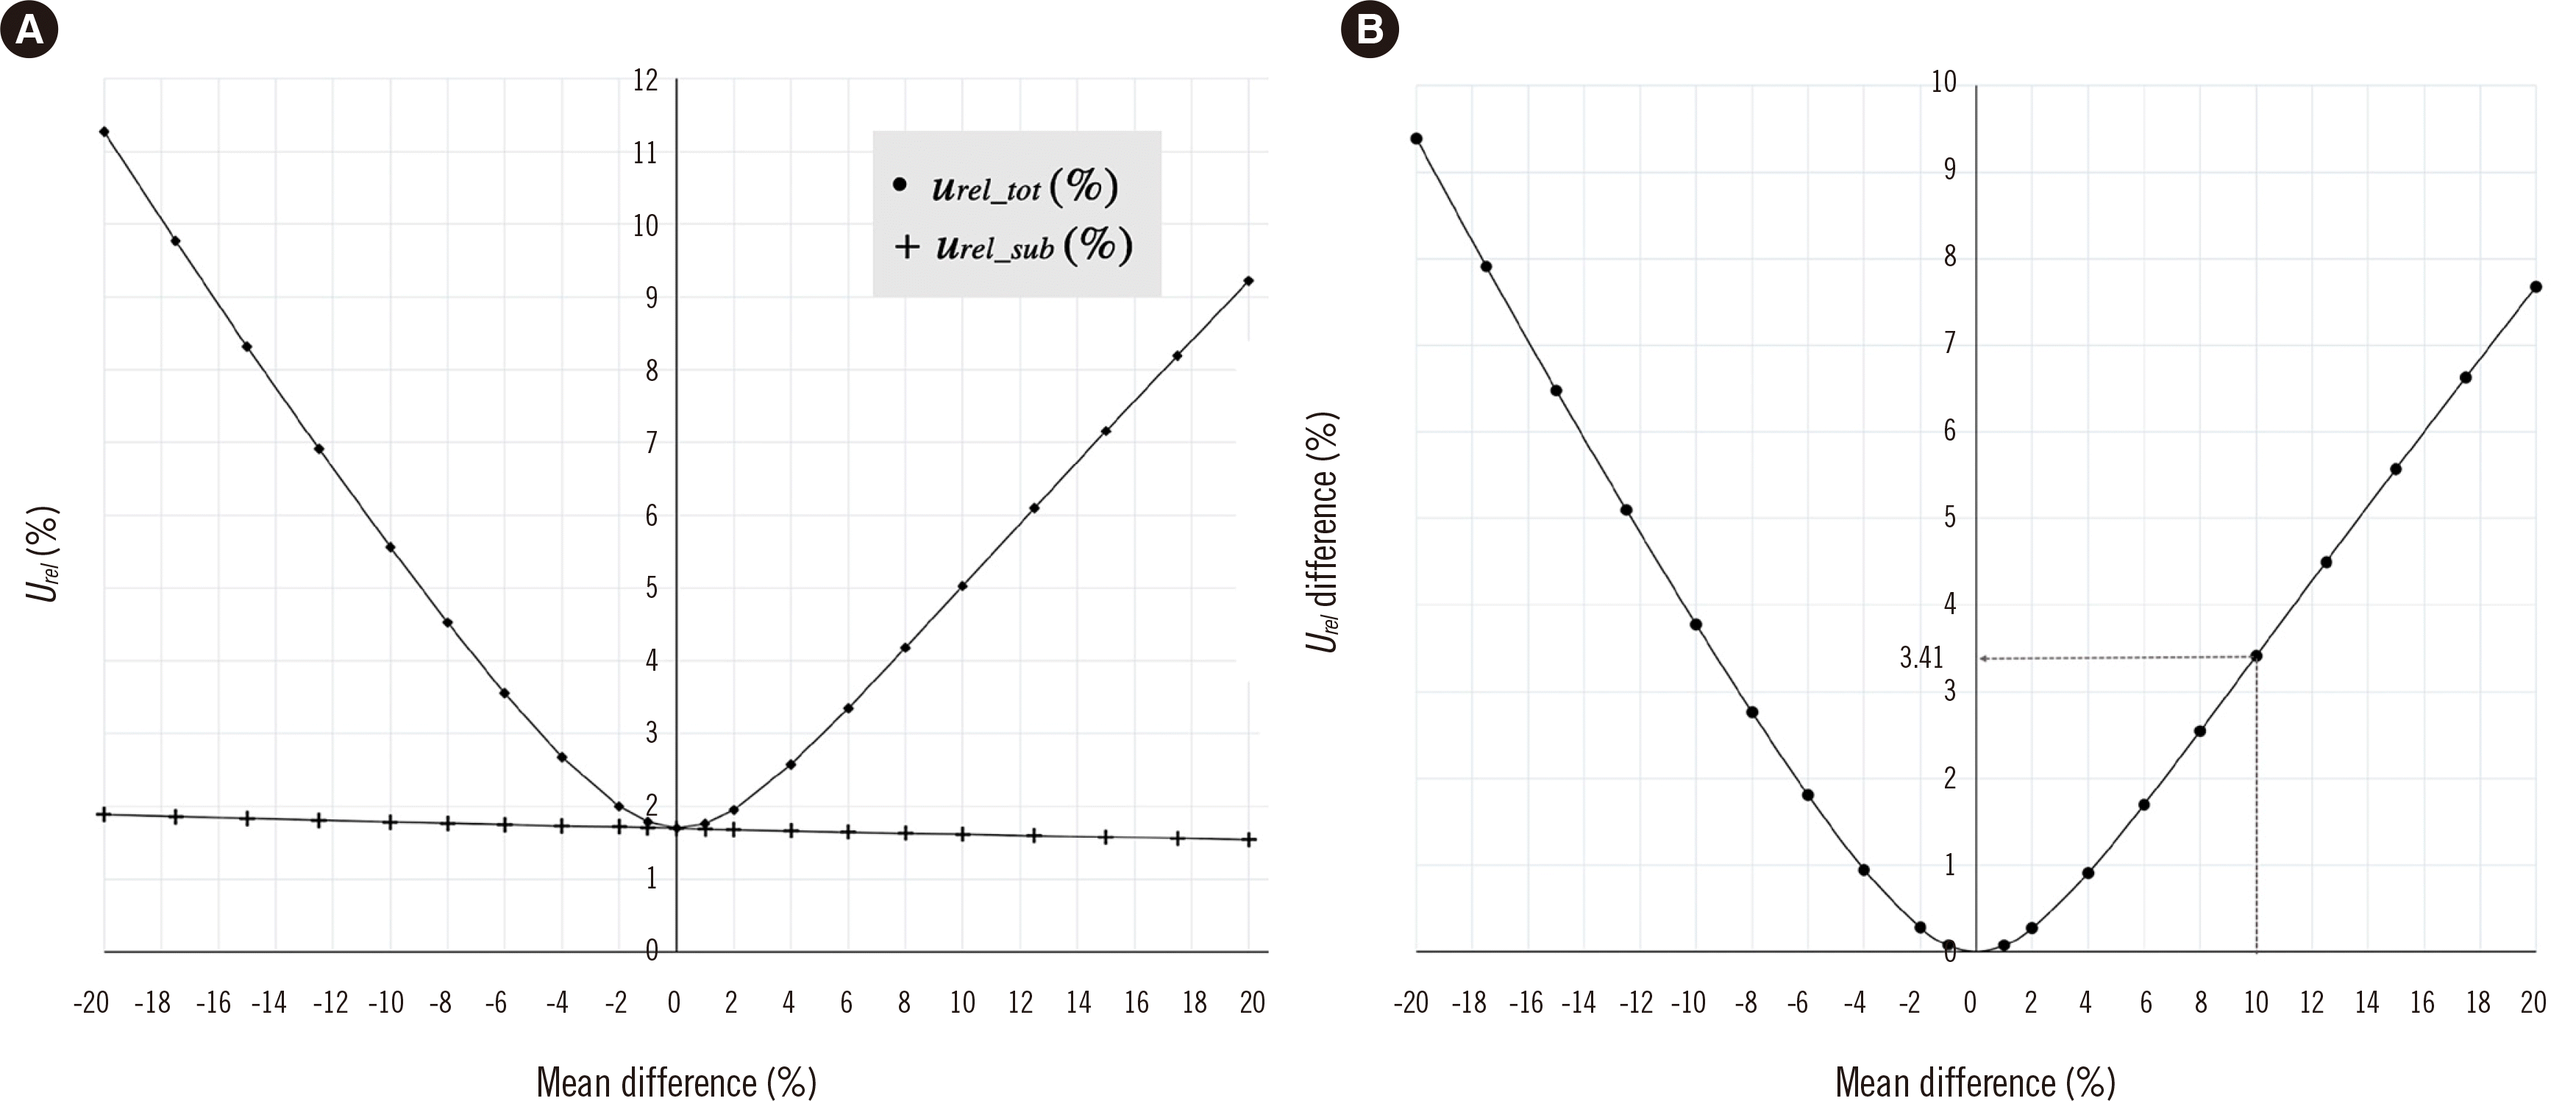
IQC data with varying degrees of shift were simulated. As shown in Fig. 4A, all %Usub values were relatively constant, irrespective of the degree of shift. However, %Usub values increased with increasing degree of shift in both directions. The mean MU differences (%, %Urel_sub–%Urel_tot) gradually increased as the mean differences (shifts) increased (Fig. 4B).

Review and comparative analysis of IQC data using two different QC material lots

IQC data obtained from two different IQC material lots that were used for two consecutive years (lot 1: March 2019 to February 2020; lot 2: March 2020 to February 2021) were reviewed, and the mean and SD values for each lot of IQC data were obtained (Supplemental Data Table S4). The t-test (for mean comparison) and F-test (for variance [SD] comparison) were used to analyze the significance of differences between the IQC datasets (Table 2). The mean values were significantly different at all levels for all analytes except creatinine. Additionally, SDs were significantly different for most analytes (except AST, LDL, creatinine, total protein, and BUN at level 1 and albumin, AST, and creatinine at level 2).

DISCUSSION

Guidelines issued by the International Organization for Standardization (ISO) and the CLSI recommend the TD approach for MU estimation in clinical laboratories [6-8]. In this approach, IQC data, which are easily obtainable in clinical laboratories, are required as a key component to evaluate MU, particularly, in laboratories that use closed measurement systems [14]. However, the practical issues faced in working conditions need to be addressed. For example, the recommended collection period, described as a “sufficiently long time,” should be defined in detail [6, 7]. Furthermore, clear recommendations should be made for IQC data obtained from different reagent lots. The guidelines recommend collecting IQC data separately if “a significant shift” in the IQC absolute values occurs when a new lot of reagents is introduced [6, 7]. However, the range of acceptable values is not defined. If each laboratory uses different standards to calculate MU, the accuracy of the results may be compromised and/or confusion may arise.
Initially, it was assumed that MU values (%Usub) calculated by subgrouping of the data would be substantially lower than those calculated as a whole (%Utot). However, the differences between MU values obtained by the two different calculation methods were minimal (minimum difference: 7.13×10⁻⁵%, maximum difference: 0.825%), although the %Usub values were lower for all analytes.
It is common to observe matrix effects in IQC materials that produce different results than human serum samples during the reaction with reagents [15]. We attempted to identify how large mean differences between IQC and patient sample results are before and after a reagent lot change (Supplemental Data Table S2). The mean differences in the two groups were within a narrow interval (in IQC data, up to 3.73% in absolute value; in patient sample data, up to 2.5% in absolute value). We therefore presumed that a mean change of <4% in IQC data may not cause a marked difference, depending on the consideration of a reagent lot change during MU estimation. This may be due to the good management of IQC activities in the laboratory.
To demonstrate the effect of a significant shift in IQC data after a reagent lot change, we conducted a simulation with artificial IQC datasets consisting of random numbers and considering one reagent lot change. As the degree of IQC data shift gradually increased, the difference between MU results increased according to the calculation method. For example, in a dataset generated with a 10% shift from the mean, the difference in MU values was ~3.41% (Urel, relative expansion uncertainty, k=2) (Fig. 4B). When we comparatively evaluated reagent lot changes in the laboratory, the predefined allowable total error was used as an acceptable performance criterion [16]. If we presume that the mean difference after a lot change was 8%, which is within the acceptable interval, the new lot would be used without further evaluation. However, in MU estimation, a significant difference was observed depending on the calculation method used. The MU value calculated regardless of the shift of 8% was higher (utot=4.34) than that calculated considering the shift (usub=1.7), which led to a highly overestimated MU value.
As observed in the third analysis, a shift in IQC data may indicate that all lots of IQC materials should be treated as different materials. In addition, an SD change in the IQC data may show various uncertainty factors related to the measurement system at the time and/or the IQC material lot change. Therefore, an IQC material lot change may be accompanied by changes not only in the IQC material substances but also in the measurement system over time.
If MU estimation was performed using the combined results of multiple IQC material lot changes, the MU values would be overestimated due to the effects of shifts and other influences from the measurement system over time (6, 7). Therefore, to obtain stable MU values using the TD approach, we suggest that one QC lot should be used for at least six consecutive months.
Lot changes of the calibrator used in MU estimation were not considered in accordance with the ISO guideline, which stipulates that separate collection and calculation of IQC data are not required unless the calibrator manufacturer introduces significant changes, such as a setpoint change [6, 7]. Furthermore, the calculation using the IQC data as a single set based on the calibrator lot change will capture the variability of human sample results due to this change as a random error [6, 7]. The means changed in different patterns over several reagent lot changes, which may indicate that the effects of the mean change were weakened. This weakening effect was not considered, and further studies may be needed.
MU estimation in clinical laboratories universally requires more detailed discussions and revisions by expert groups. The results of this study may provide basic, but practical, considerations in clinical laboratories for conducting MU estimation using a TD approach. In conclusion, reagent lot changes should be considered when the TD approach is applied to IQC data, and data from a single lot of IQC materials are recommended to obtain stable and reliable MU values using the TD approach.
Supplemental Materials

ACKNOWLEDGEMENTS

None.

Notes

AUTHOR CONTRIBUTIONS

Gu H designed the study, analyzed the data, and wrote the draft; Lee W conceived the study, analyzed the data, and finalized the draft; Lee WI conceived the study and reviewed the manuscript; Yun YM discussed the data and reviewed the manuscript; Chun S and Min WK provided perspectives on the study concept; Lee J supported the study data collection; and Hong J discussed the data. All authors have read and approved the final manuscript.

CONFLICTS OF INTEREST

The authors have no conflicts of interest to declare.

RESEARCH FUNDING

None declared.

REFERENCES

1. Ćelap I, Vukasović I, Juričić G, Šimundić AM. 2017; Minimum requirements for the estimation of measurement uncertainty: recommendations of the joint Working group for uncertainty of measurement of the CSMBLM and CCMB. Biochem Med (Zagreb). 27:030502. DOI: 10.11613/BM.2017.030502. PMID: 29180913. PMCID: PMC5696748.
crossref
2. Infusino I, Panteghini M. 2018; Measurement uncertainty: friend or foe? Clin Biochem. 57:3–6. DOI: 10.1016/j.clinbiochem.2018.01.025. PMID: 29410277.
crossref
3. Braga F, Infusino I, Panteghini M. 2015; Role and responsibilities of laboratory medicine specialists in the verification of metrological traceability of in vitro medical diagnostics. J Med Biochem. 34:282–7. DOI: 10.1515/jomb-2015-0004. PMID: 28356838. PMCID: PMC4922343.
4. Braga F, Panteghini M. 2020; The utility of measurement uncertainty in medical laboratories. Clin Chem Lab Med. 58:1407–13. DOI: 10.1515/cclm-2019-1336. PMID: 32126011.
crossref
5. BIPM. Evaluation of measurement data - Guide to the expression of uncertainty in measurement, GUM 1995 with minor corrections. 2008; JCGM. 100.
6. CLSI. 2012. Expression of measurement uncertainty in laboratory medicine, approved guideline. CLSI EP29-A. Wayne, PA: Clinical and Laboratory Standards Institute.
7. ISO. 2019. Medical laboratories - Practical guidance for the estimation of measurement uncertainty. ISO/TS 20914:2019 Technical Specification: The International Organization for Standardization.
8. EURACHEM/CITAC. 2019. Measurement uncertainty arising from sampling: a guide to methods and approaches.
9. Braga F, Infusino I, Panteghini M. 2015; Performance criteria for combined uncertainty budget in the implementation of metrological traceability. Clin Chem Lab Med. 53:905–12. DOI: 10.1515/cclm-2014-1240. PMID: 25870964.
crossref
10. Ellis AD, Gross AR, Budd JR, Miller WG. 2020; Influence of reagent lots and multiple measuring systems on estimating the coefficient of variation from quality control data; implications for uncertainty estimation and interpretation of QC results. Clin Chem Lab Med. 58:1829–35. DOI: 10.1515/cclm-2020-0320. PMID: 32883061.
crossref
11. Johansen MB, Christensen PA. 2018; A simple transformation independent method for outlier definition. Clin Chem Lab Med. 56:1524–32. DOI: 10.1515/cclm-2018-0025. PMID: 29634477.
crossref
12. Mishra P, Pandey CM, Singh U, Gupta A, Sahu C, Keshri A. 2019; Descriptive statistics and normality tests for statistical data. Ann Card Anaesth. 22:67–72. DOI: 10.4103/aca.ACA_157_18. PMID: 30648682. PMCID: PMC6350423.
crossref
13. Kim HY. 2013; Statistical notes for clinical researchers: assessing normal distribution (2) using skewness and kurtosis. Restor Dent Endod. 38:52–4. DOI: 10.5395/rde.2013.38.1.52. PMID: 23495371. PMCID: PMC3591587.
crossref
14. Ceriotti F. 2018; Deriving proper measurement uncertainty from Internal Quality Control Data: an impossible mission? Clin Biochem. 57:37–40. DOI: 10.1016/j.clinbiochem.2018.03.019. PMID: 29605551.
crossref
15. Kim SY, Chun S, Lee W, Min WK. 2013; Commutability of proficiency testing (PT): status of the matrix-related bias in general clinical chemistry. Clin Chem Lab Med. 51:e169–73. DOI: 10.1515/cclm-2013-0117. PMID: 23612674.
crossref
16. Thompson S, Chesher D. 2018; Lot-to-lot variation. Clin Biochem Rev. 39:51–60. DOI: 10.1515/cclm-2022-0128. PMID: 30473592. PMCID: PMC6223607.

Fig. 1
Schematic illustration of MU estimation by different calculation methods. (i) Total uncertainty (utot=s(x), SD) was calculated regardless of reagent lot changes, according to equation (1). (ii) IQC values before and after a reagent lot change were collected separately by lot number, and uRw calculated in each data subgroup were combined to obtain the overall uncertainty (subgrouping uncertainty, usub=spooled(x), pooled sample SD for x organized into subgroups), according to equation (2).
Abbreviations: QC, quality control; x, measurand quantity value for a measurement; x̄, mean value of a measurand; xi, ith member of a group of values (e.g., repeated measurements of a sample); n, total number of values; ni, number of values in the ith group; m, number of groups of values.
alm-42-6-630-f1.tif
Fig. 2
Schematic illustration of reagent lot change simulation using artificial IQC data. (A) Process of generating baseline and shifted artificial IQC datasets. (B) MU estimation with the generated datasets by different calculation methods.
Abbreviations: IQC, internal quality control; MU, measurement uncertainty; m0–10, arithmetic mean of baseline and shifted datasets; utot, standard uncertainty calculated regardless of a reagent lot change; usub, combined uncertainty calculated using values obtained from each subgroup; ubase, standard uncertainty of the baseline data; ushift, standard uncertainty of the shifted data; x, measurand quantity value; n, total number of values; ni, number of values in the ith group; m, number of groups of values.
alm-42-6-630-f2.tif
Fig. 3
Results of MU estimation using different calculation methods.
Abbreviations: MU, measurement uncertainty; utot, standard uncertainty calculated regardless of a reagent lot change; usub, combined uncertainty calculated using values obtained from each subgroup; ALP, alkaline phosphatase; K, potassium; Na, sodium; BUN, blood urea nitrogen.
alm-42-6-630-f3.tif
Fig. 4
Difference in MU values between two differently calculated groups. (A) As the mean differences (%) increased, urel_tot values calculated regardless of mean change showed a constant MU, whereas usel_sub values calculated separately by mean and then combined showed gradual increases in MU. (B) MU differences (=%urel_tot – %urel_sub) with respect to mean differences (%) are plotted. For example, a mean difference of 10% after one reagent lot change corresponded to a difference in MU of 3.41%.
Abbreviations: MU, measurement uncertainty; urel_tot, relative uncertainty calculated regardless of a reagent lot change; urel_sub, relative combined uncertainty calculated from values obtained from each subgroup; %urel, relative uncertainty, akin to CV.
alm-42-6-630-f4.tif
Table 1
Results of MU estimation using different calculation methods
Analytes QC level 1 QC level 2 No. of reagent lots used


Urel_tot (%) Urel_sub (%) %Difference* Urel_tot (%) Urel_sub (%) %Difference
Albumin 2.944 2.881 0.063 2.565 2.479 0.086 3
ALP 4.259 4.013 0.245 4.085 3.59 0.495 3
ALT 8.01 7.995 0.015 2.591 2.573 0.018 2
AST 5.425 5.382 0.043 2.939 2.908 0.031 3
HDL 4.655 4.165 0.49 5.348 4.523 0.825 3
LDL 4.414 4.312 0.101 3.926 3.837 0.089 2
Total cholesterol 3.554 3.491 0.064 3.567 3.485 0.083 4
Creatinine 5.847 5.813 0.034 4.345 4.334 0.011 3
Glucose 2.159 2.085 0.073 2.144 2.068 0.076 4
Total protein 2.359 2.311 0.048 2.29 2.263 0.028 4
Triglyceride 2.581 2.579 0.002 2.534 2.532 0.002 3
K 1.538 1.538 7.13E-05 1.284 1.282 0.002 2
Na 1.557 1.525 0.032 1.368 1.347 0.021 4
BUN 4.366 4.306 0.06 3.477 3.458 0.02 4
Mean 4.752 4.606 0.146 3.575 3.342 0.232 2.9
Median 4.414 4.165 0.064 3.567 3.485 0.086 3
Min (analyte) 2.944 2.881 1.45E-02 2.534 2.532 0.018 2
K Triglyceride
Max (analyte) 4.655 4.165 0.49 5.348 4.523 0.825 4
HDL HDL

*%Difference = % Urel_tot – %Sub Urel_sub

Abbreviations: MU, measurement uncertainty; QC, quality control; Urel_tot, expanded relative uncertainty (coverage factor, k=2) calculated regardless of reagent lot change, akin to CV; Urel_sub, expanded relative uncertainty (coverage factor, k=2) with obtained values from each subgroup, akin to CV; ALP, alkaline phosphatase; K, potassium; Na, sodium; BUN, blood urea nitrogen.

Table 2
Comparison of two IQC data groups from separate QC material lots, using t- and F-tests
QC level Statistical analysis Alb ALP ALT AST HDL LDL T-chol Cr Glu Ptn K Na TG BUN
1 t-test Y Y Y Y Y Y Y N Y Y Y Y Y Y
P ( < 0.05) 0.000 0.000 0.000 0.000 0.000 0.000 0.000 0.086 0.000 0.000 0.000 0.000 0.000 0.000
F-test Y Y Y N Y N Y N Y N Y Y Y N
P ( < 0.05) 0.015 0.000 0.000 0.114 0.009 0.693 0.000 0.709 0.000 0.795 0.000 0.000 0.014 0.705
2 t-test Y Y Y Y Y Y Y Y Y Y Y Y Y Y
P ( < 0.05) 0.000 0.000 0.000 0.000 0.000 0.000 0.000 0.000 0.000 0.000 0.000 0.000 0.000 0.000
F-test N Y Y N Y Y Y N Y Y Y Y Y Y
P ( < 0.05) 0.228 0.000 0.000 0.769 0.000 0.006 0.000 0.092 0.000 0.001 0.003 0.000 0.033 0.014

*t-test: Y (P<0.05), a significant difference exists between the mean values of two groups; N (P≥0.05), no significant difference exists between the mean values of two groups.

*F-test: Y (P<0.05), a significant difference exists between the variance (SD) values of two groups.; N (P≥0.05), no significant difference exists between the variance (SD) of two groups.

Abbreviations: MU, measurement uncertainty; IQC, internal quality control; Alb, albumin; ALP, alkaline phosphatase; T-chol, total cholesterol; Cr, creatinine; Glu, glucose; Ptn, protein; K, potassium; Na, sodium; TG, triglyceride; BUN, blood urea nitrogen.

TOOLS
Similar articles