INTRODUCTION
METHODS
Cell culture
Mitochondrial isolation
Markers of cellular senescence
Table 2
TCA cycle enzymes
Nicotinamide cofactors
ETC enzymes
ATP and ADP levels
Quantitative real-time PCR (qRT-PCR)
Statistical analysis
RESULTS
Senescence markers are increased in serially subcultured fibroblasts
 | Fig. 1Identification of senescent fibroblasts by monitoring total cellular glucose and glycogen degradative enzyme activities and oxidative stress markers in confluent serial subcultures.Enzyme activities of (A) phosphofructokinase (PFK), (B) lactate dehydrogenase (LDH), and (C) glycogen phosphorylase (GP), along with levels of (D) hydrogen peroxide (H2O2) and (E) superoxide anions (SA), (F) lipid peroxides (LPO), (G) protein carbonyl content (PCC), and (H) oxidized glutathione (GSSG) in P5-P35 confluent cells. *p < 0.05, **p < 0.01, ***p < 0.001, and ****p < 0.0001 indicate significant difference from control P5 values (n = 6).
|
Senescent cells exhibit profound oxidative stress
Senescence disrupts mitochondrial TCA cycle enzyme activities
 | Fig. 2Mitochondrial specific activities of TCA cycle enzymes in primary P5 and senescent P25 and P35 fibroblasts.Enzyme activities of (A) aconitase (can), (B) α-ketoglutarate dehydrogenase (α-KGDH), (C) succinate dehydrogenase (SDH), (D) malate dehydrogenase (MDH), (E) NAD+- isocitrate dehydrogenase (ICD), and (F) NADP+-ICD in young (P5) and senescent (P25 and P35) confluent cells. ***p < 0.001 and ****p < 0.0001 indicate significant difference from control P5 values (n = 6).
|
Senescence is associated with reduced ETC enzyme activities
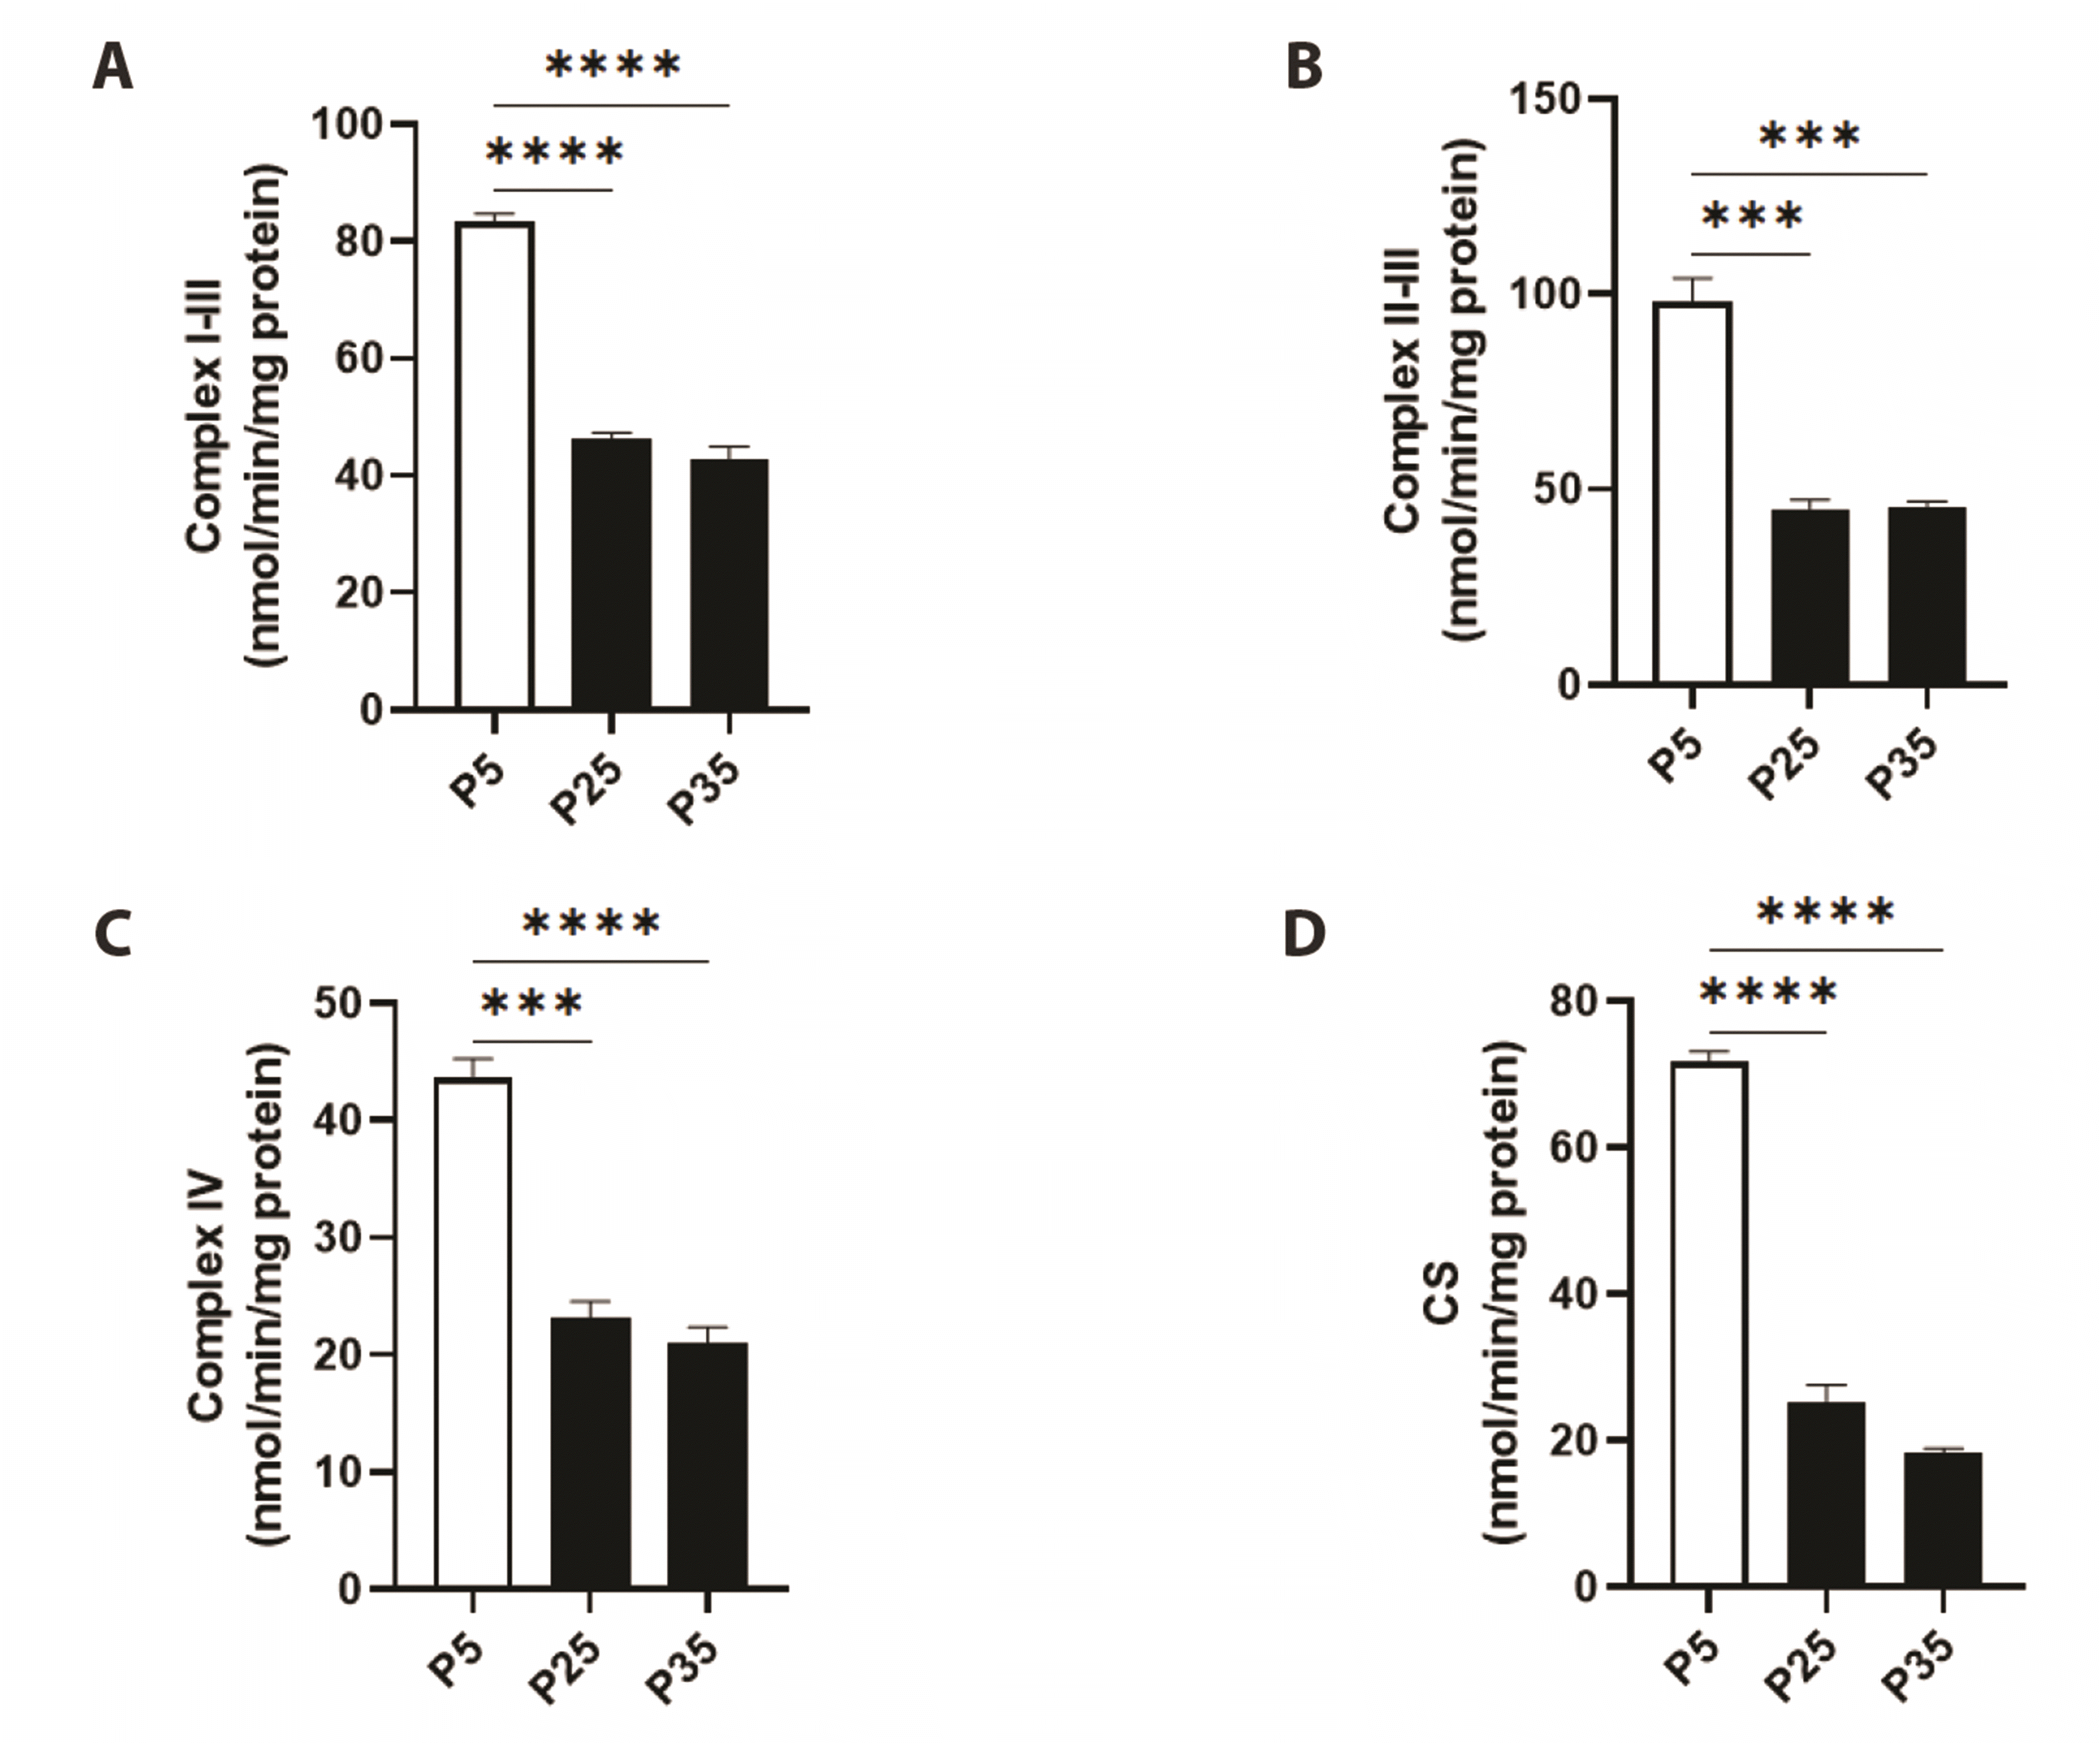 | Fig. 3Mitochondrial specific activities of electron transport chain (ETC) enzymes in primary P5 and senescent P25 and P35 fibroblasts.Enzyme activities of (A) complex I-III, (B) complex II-III, (C) complex IV, and (D) citrate synthase (CS) in young (P5) and senescent (P25 and P35) confluent cells. ***p < 0.001 and ****p < 0.0001 indicate significant difference from control P5 values (n = 6).
|
Senescence promotes mitochondrial oxidative stress
 | Fig. 4Mitochondrial oxidative stress markers in primary P5 and senescent P25 and P35 fibroblasts.Generation levels of (A) hydrogen peroxide (H2O2), (B) superoxide anions (SA), (C) lipid peroxides (LPO), and (D) protein carbonyl content (PCC), and transcriptional and enzyme activities of thioredoxin reductase 2 (TrxR2) (E, F) and superoxide dismutase 2 (SOD2) (G, H) in young (P5) and senescent (P25 and P35) confluent cells. **p < 0.01), ***p < 0.001, and ****p < 0.0001 indicate significant difference from control P5 values (n = 6).
|
 | Fig. 5Mitochondrial glutathione status in primary P5 and senescent P25 and P35 fibroblasts.Transcriptional activities of (A) glutathione peroxidase 1 (GPx1) and (B) glutathione reductase (GR), and enzyme activities of (C) GPx1 and (D) GR, along with levels of (E) reduced glutathione (GSH), (F) oxidized glutathione (GSSG), and (G) GSH/GSSG ratio in young (P5) and senescent (P25 and P35) confluent cells. *p < 0.05, **p < 0.01, ***p < 0.001, and ****p < 0.0001 indicate significant difference from control P5 values (n = 6).
|
Nicotinamide cofactors are disrupted in senescent mitochondria
 | Fig. 6Mitochondrial NAD+, NADH, NADP+, and NADPH levels in primary P5 and senescent P25 and P35 fibroblasts.Levels of (A) NAD+, (B) NADH, (C) NAD+/NADH ratio, (D) NADP+, (E) NADPH, and (F) NADP+/NADPH ratio in young (P5) and senescent (P25 and P35) confluent cells. **p < 0.01, ***p < 0.001, and ****p < 0.0001 indicate significant difference from control P5 values (n = 6).
|
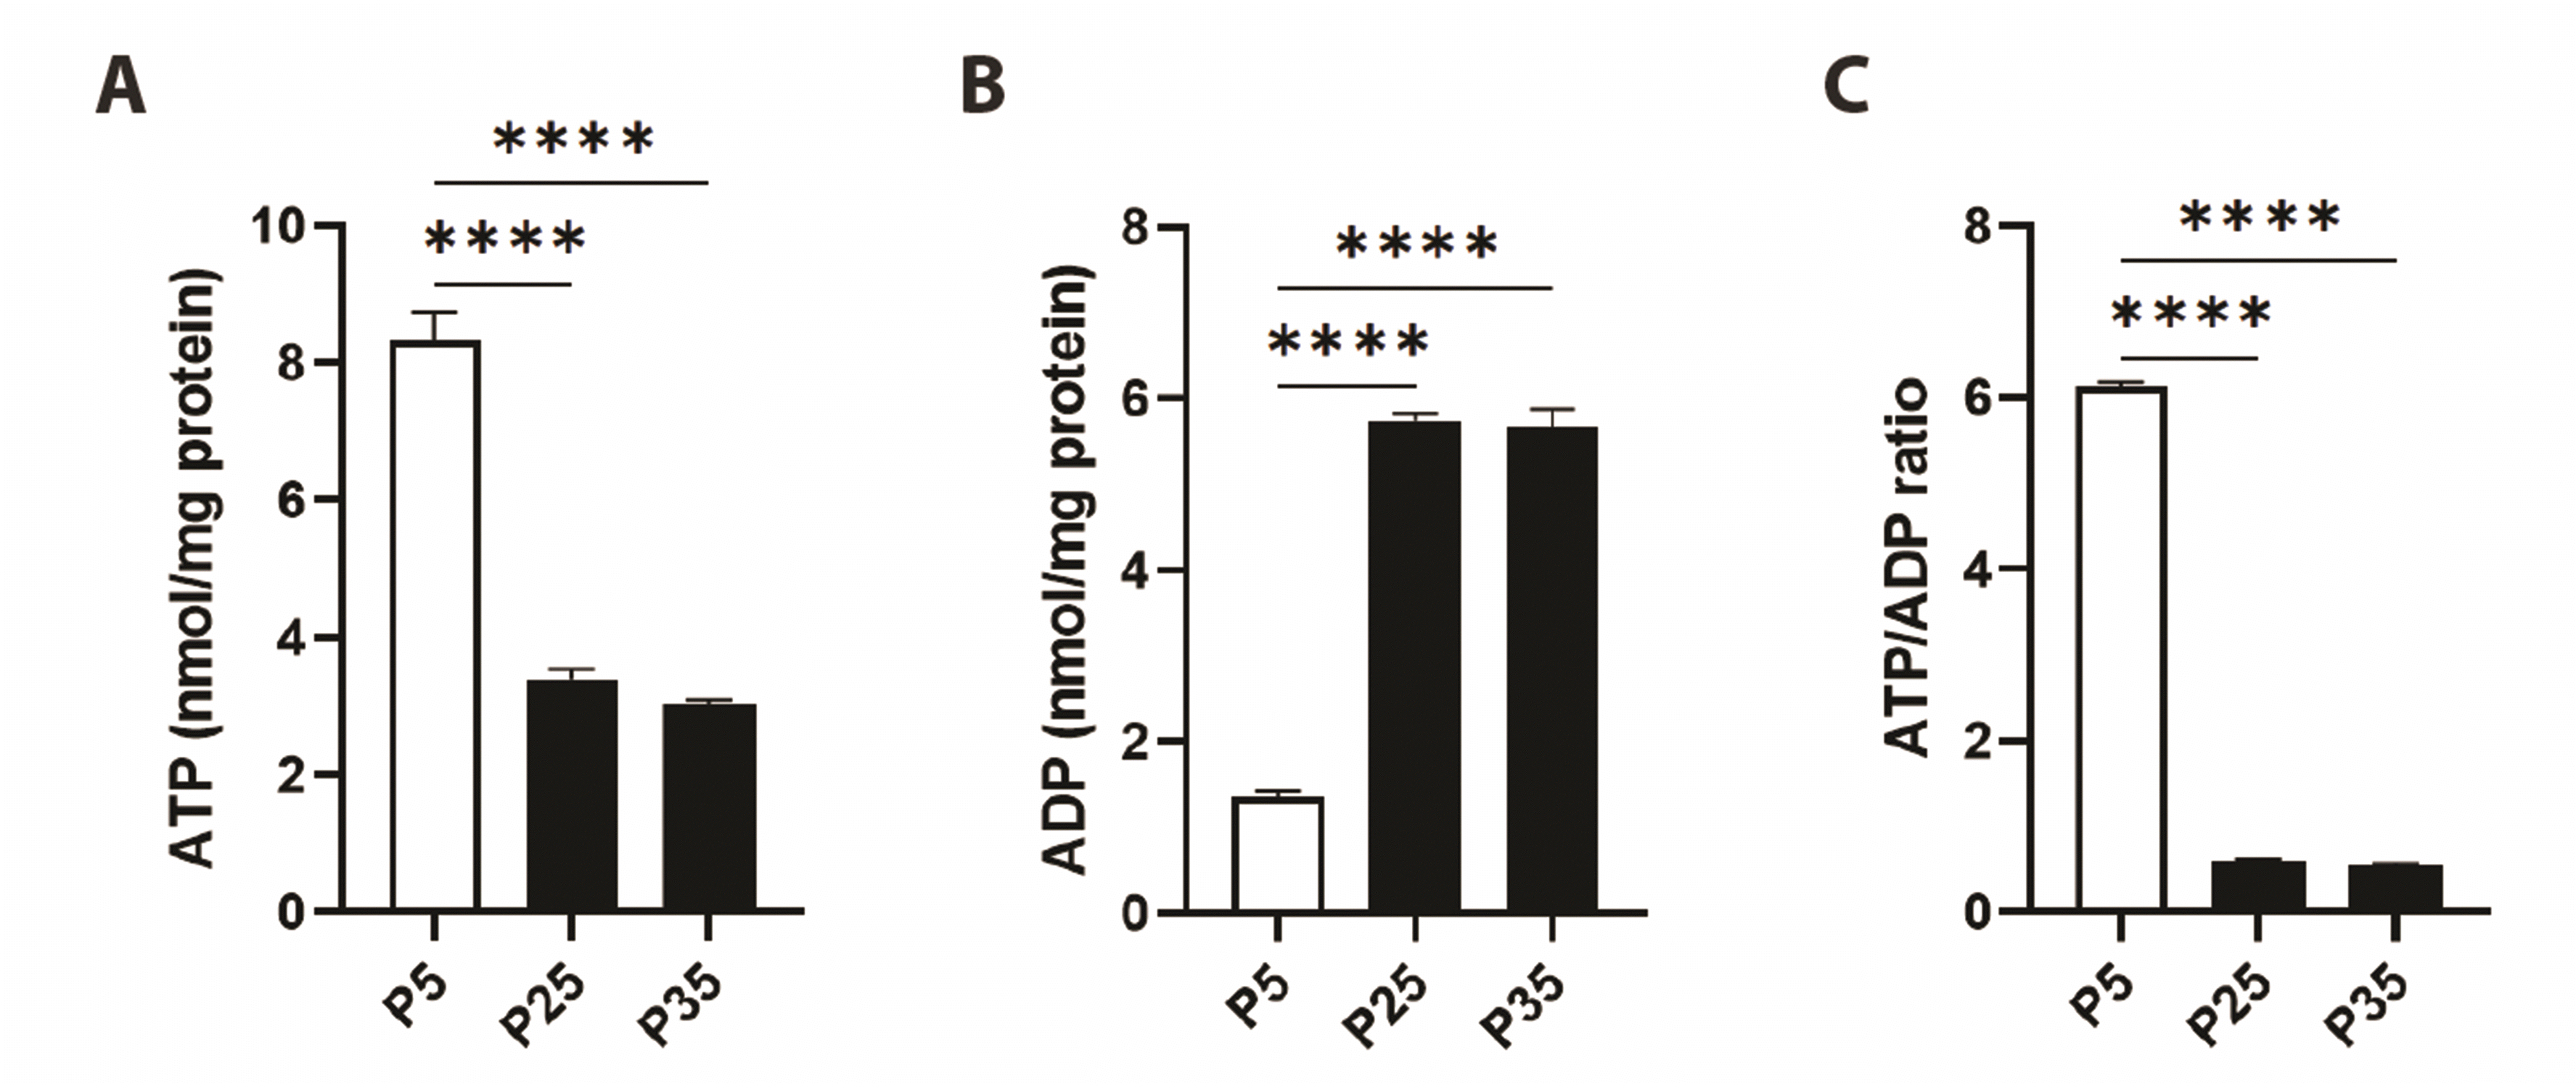
Senescence promotes metabolic exhaustion
DISCUSSION
 | Fig. 8A working model of mitochondrial senescence [65].Replicative senescence induces metabolic changes in mitochondria evident as accumulation of ROS, shutdown of TCA and ETC pathways, glutathione depletion, and energy exhaustion. ROS, reactive oxygen species; ETC, electron transport chain; PFK, phosphofructokinase; LDH, lactate dehydrogenase; GP, glycogen phosphorylase; H2O2, hydrogen peroxide; SA, superoxide anions; LPO, lipid peroxides; PCC, protein carbonyl content; GSSG, oxidized glutathione; TrxR2, thioredoxin reductase 2; SOD2, superoxide dismutase 2; GPx1, glutathione peroxidase 1; GR, glutathione reductase; GSH, reduced glutathione.
|


 PDF
PDF Citation
 Print
Print


 XML Download