INTRODUCTION
METHODS
Preparation of neutrophils
Assay of intracellular killing of E. coli by human neutrophils
Clearance of intraperitoneally injected E. coli
Measurement of 36CI– Uptake
Nitrogen cavitation
Subcellular fractionation
Flow cytometry
ROS measurement
Fluorescence measurement of Fluo-3
Transfection with microRNA-adapted shRNA of TRPM2
Measurement of Lucifer yellow uptake
Fusion of azurophil granules and zymosan
Statistical analysis
RESULTS
Glycine enhancement of neutrophil bactericidal activity
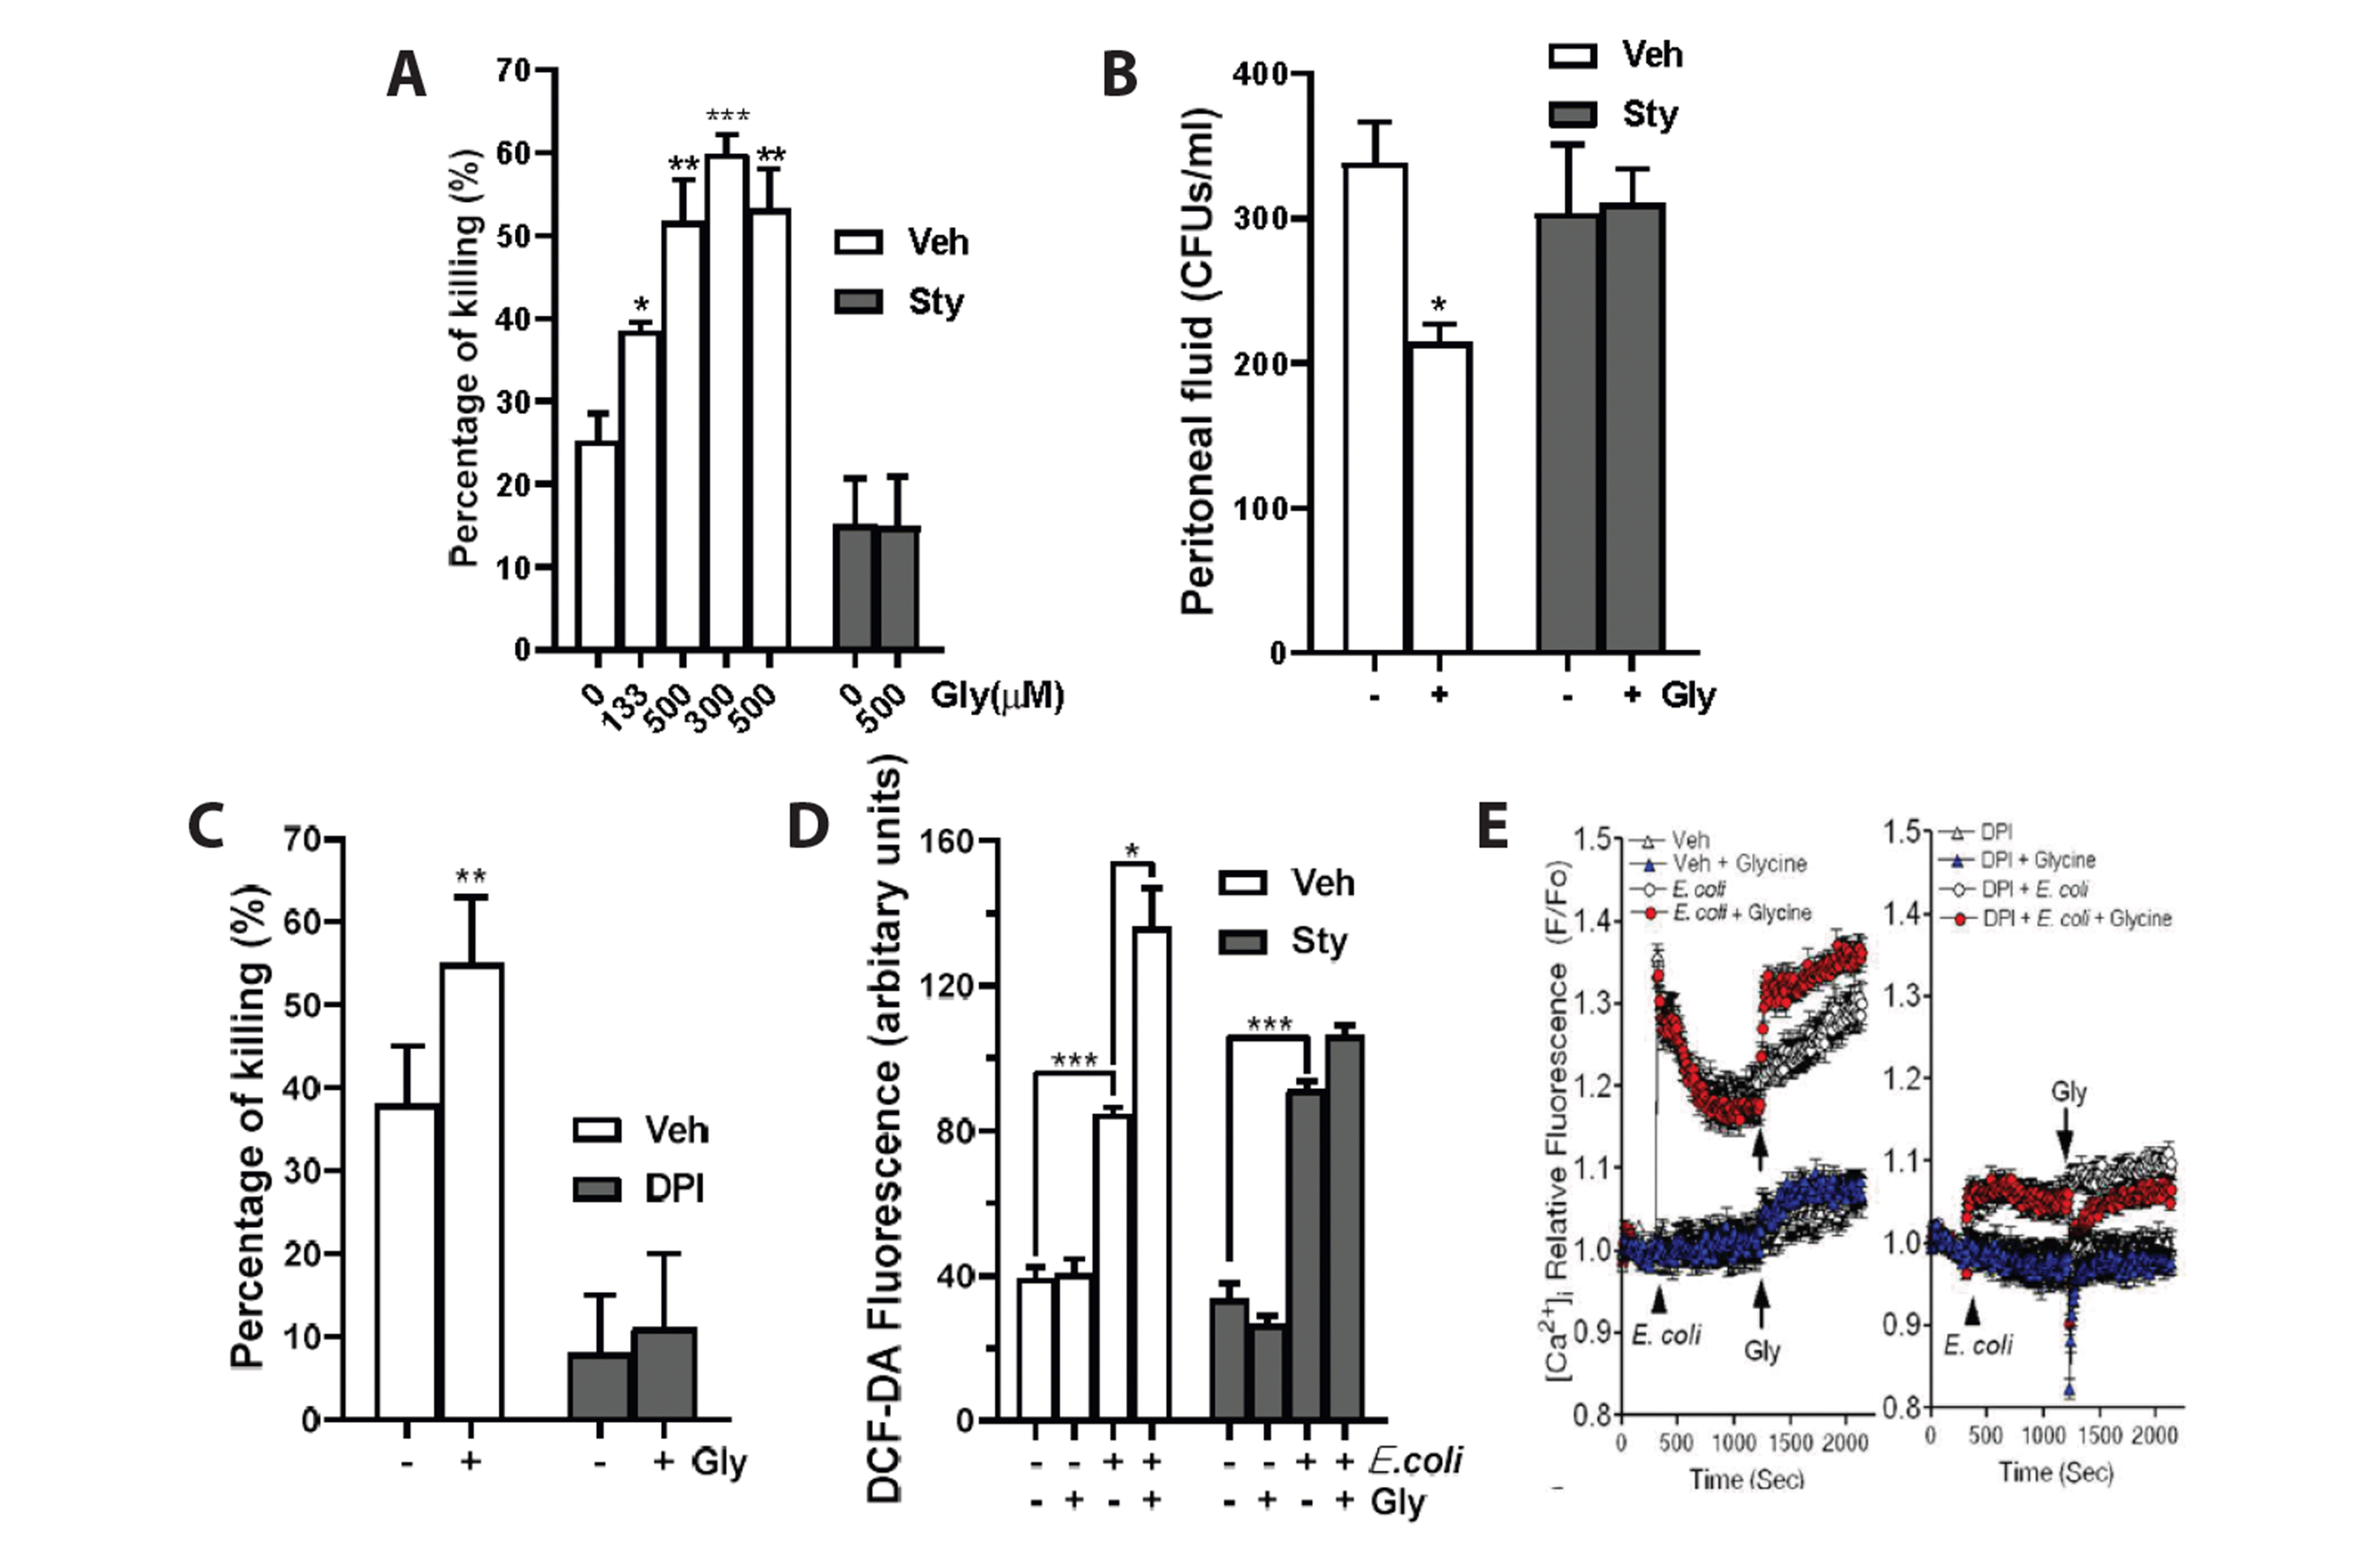 | Fig. 1Glycine increases neutrophil bactericidal activity via enhanced intracellular reactive oxygen species (ROS) production.(A) Glycine concentration-dependently increases neutrophil bactericidal activity. Various concentrations of glycine were added to HBSS. Strychnine blocked glycine-induced enhancement of neutrophil bactericidal activity. The average of three experiments is shown (mean ± SE). (B) Glycine increases the clearance of intraperitoneally injected E. coli in mice. Mice were pretreated subcutaneously with PBS or strychnine (0.4 mg/kg) 30 min before an i.p. injection of E. coli (5 × 10⁸). At 30 min after E. coli injection, vehicle (PBS) or glycine (30 mg/kg) was subcutaneously injected. Eight hours after E. coli injection, mice were killed and the number of CFUs in peritoneal lavage fluid was counted. n = 9−10 per group. *p < 0.05; **p < 0.01; ***p < 0.001 by Student’s t-test. (C) Effect of DPI on glycine-induced enhancement of bactericidal activity. Neutrophils were pretreated with DPI (1 μM) for 1 h before glycine (500 μM) treatment in HBSS medium. (D) Effects of glycine on ROS generation in neutrophils. Neutrophils were exposed to E. coli for 20 min. Unphagocytosed E. coli was washed away and neutrophils were further incubated with or without glycine (500 μM) for 15 min. ROS production in neutrophils was measured with DCF-DA. (E) GIyR-ROS-Ca2+ signaling pathway. (Left) Effect of glycine on [Ca2+]i in neutrophils exposed to E. coli. Neutrophils were exposed to E. coli for 20 min, and further incubated with or without glycine (1 mM). (Right) Neutrophils were pretreated with DPI (1 μM) for 15 min before E. coli exposure. CFUs, colony forming units; DPI, diphenylene iodonium; DCF-DA, 2’,7’-dichlorodihydrofluorescein diacetate; Gly, glycine; GlyR, glycine receptor.
|
Glycine-induced enhancement of neutrophil bactericidal activity is dependent on enhanced intracellular ROS production
GIyR-ROS-Ca2+ signaling pathway
Glycine induces 36CI– uptake and [Ca2+]i increase in neutrophils pretreated with PMA
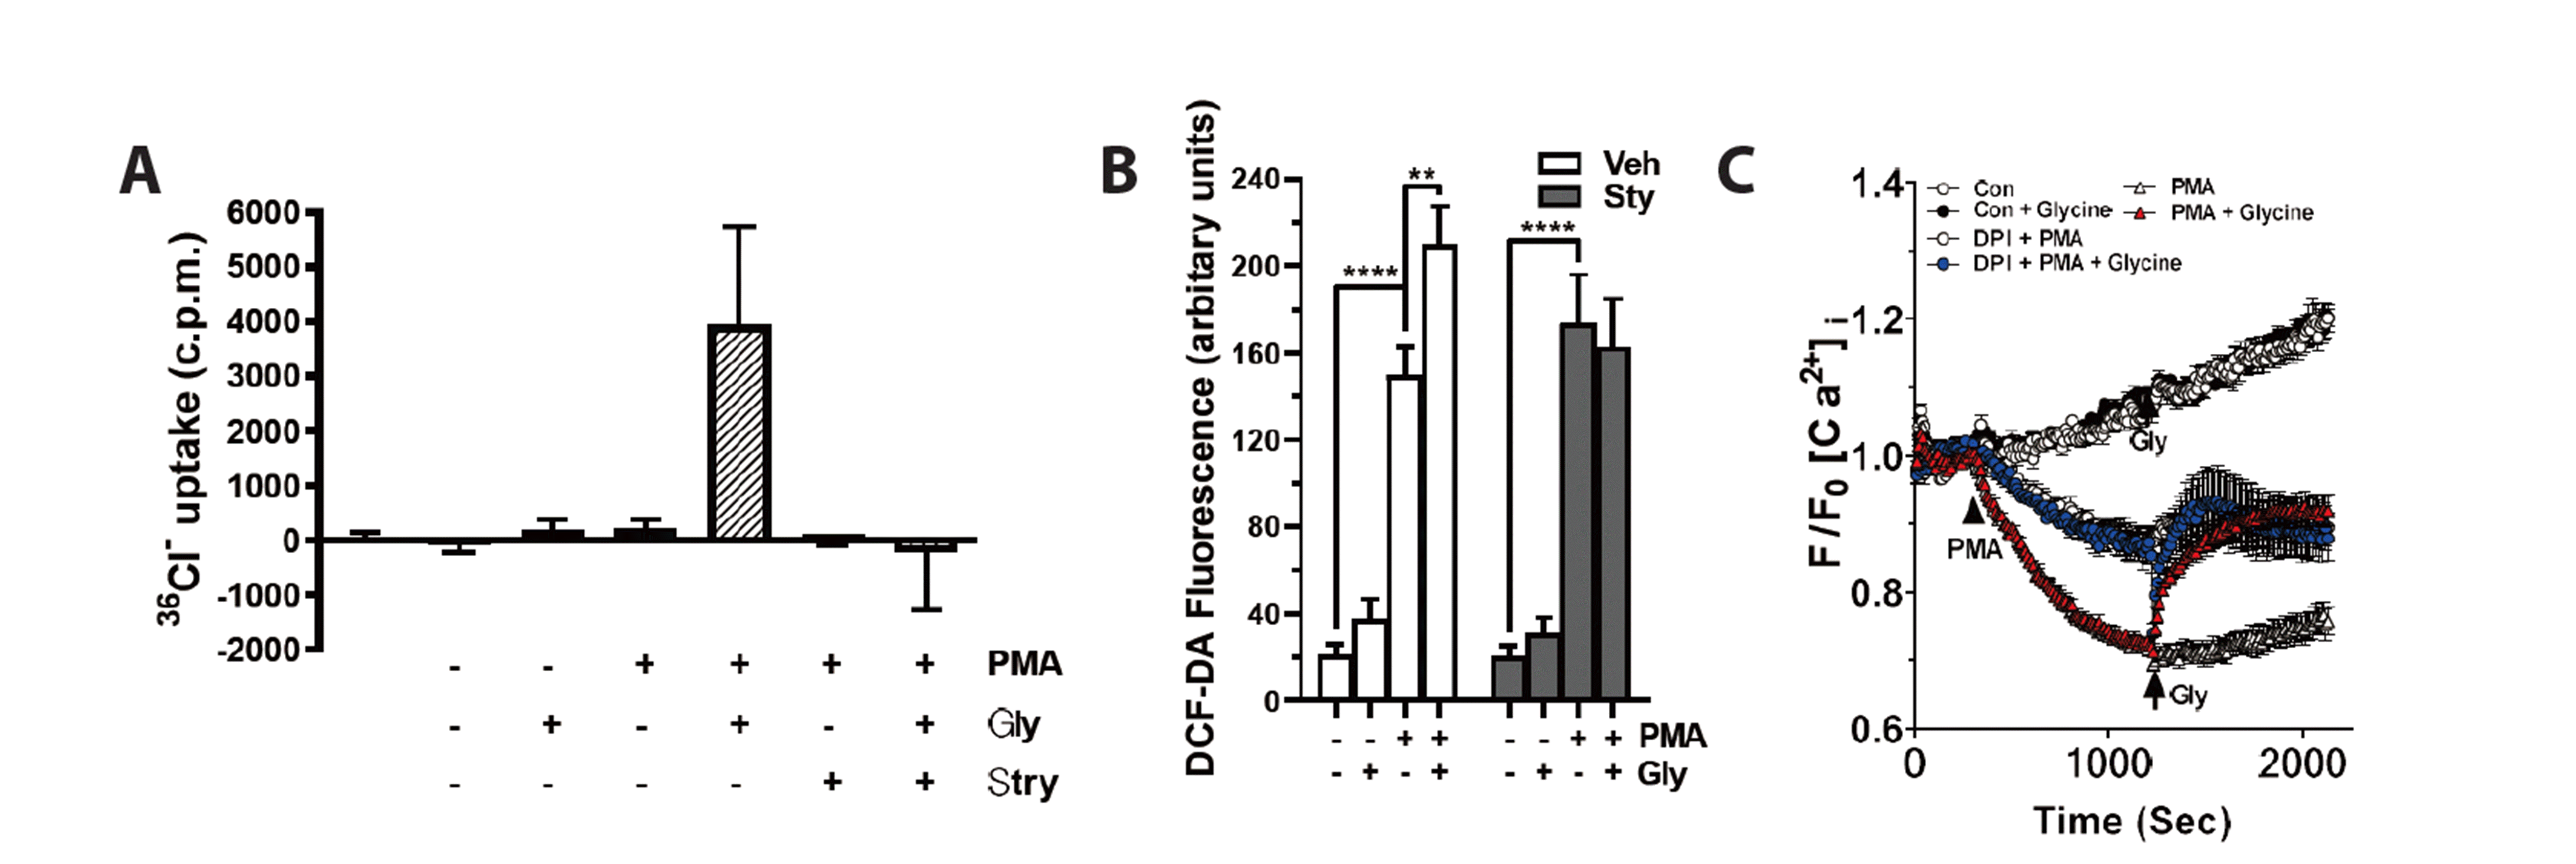 | Fig. 2Glycine induces 36CI– uptake and [Ca2+]i increase in neutrophils pretreated with phorbol myristate acetate (PMA).(A) 36CI– influx in response to glycine (1 mM) in neutrophils. Neutrophils were incubated with 2 μg/ml PMA for 20 min. Uptake was initiated by adding 36CI– solution and influx was terminated by the addition of 4 ml of ice-cold HEPES butter and rapid filtration. Neutrophils were placed in scintillation vials and solubilized with 0.2 N NaOH for 2 h. EcoLume was added and radioactivity was measured with a Beckman LS-5801 liquid scintillator. (B) Neutrophils were pretreated with 2 μg/ml PMA for 20 min, and glycine (500 μM)-induced reactive oxygen species (ROS) generation was measured. (C) Effect of glycine (1 mM) on [Ca2+]i in vehicle- or PMA-pretreated neutrophils. Neutrophils were pretreated with diphenylene iodonium (DPI) (1 μM) for 15 min before PMA exposure. (A–C) The average of three experiments is shown (mean ± SE). *p < 0.05; **p < 0.01;***p < 0.001 by Student’s t-test. DCF-DA, 2’,7’-dichlorodihydrofluorescein diacetate.
|
Effects of TRPM2-specific shRNA on glycine (1 mM)-induced increase in [Ca2+]i in neutrophils, and on glycine (500 μM)-induced enhancement of bactericidal activity
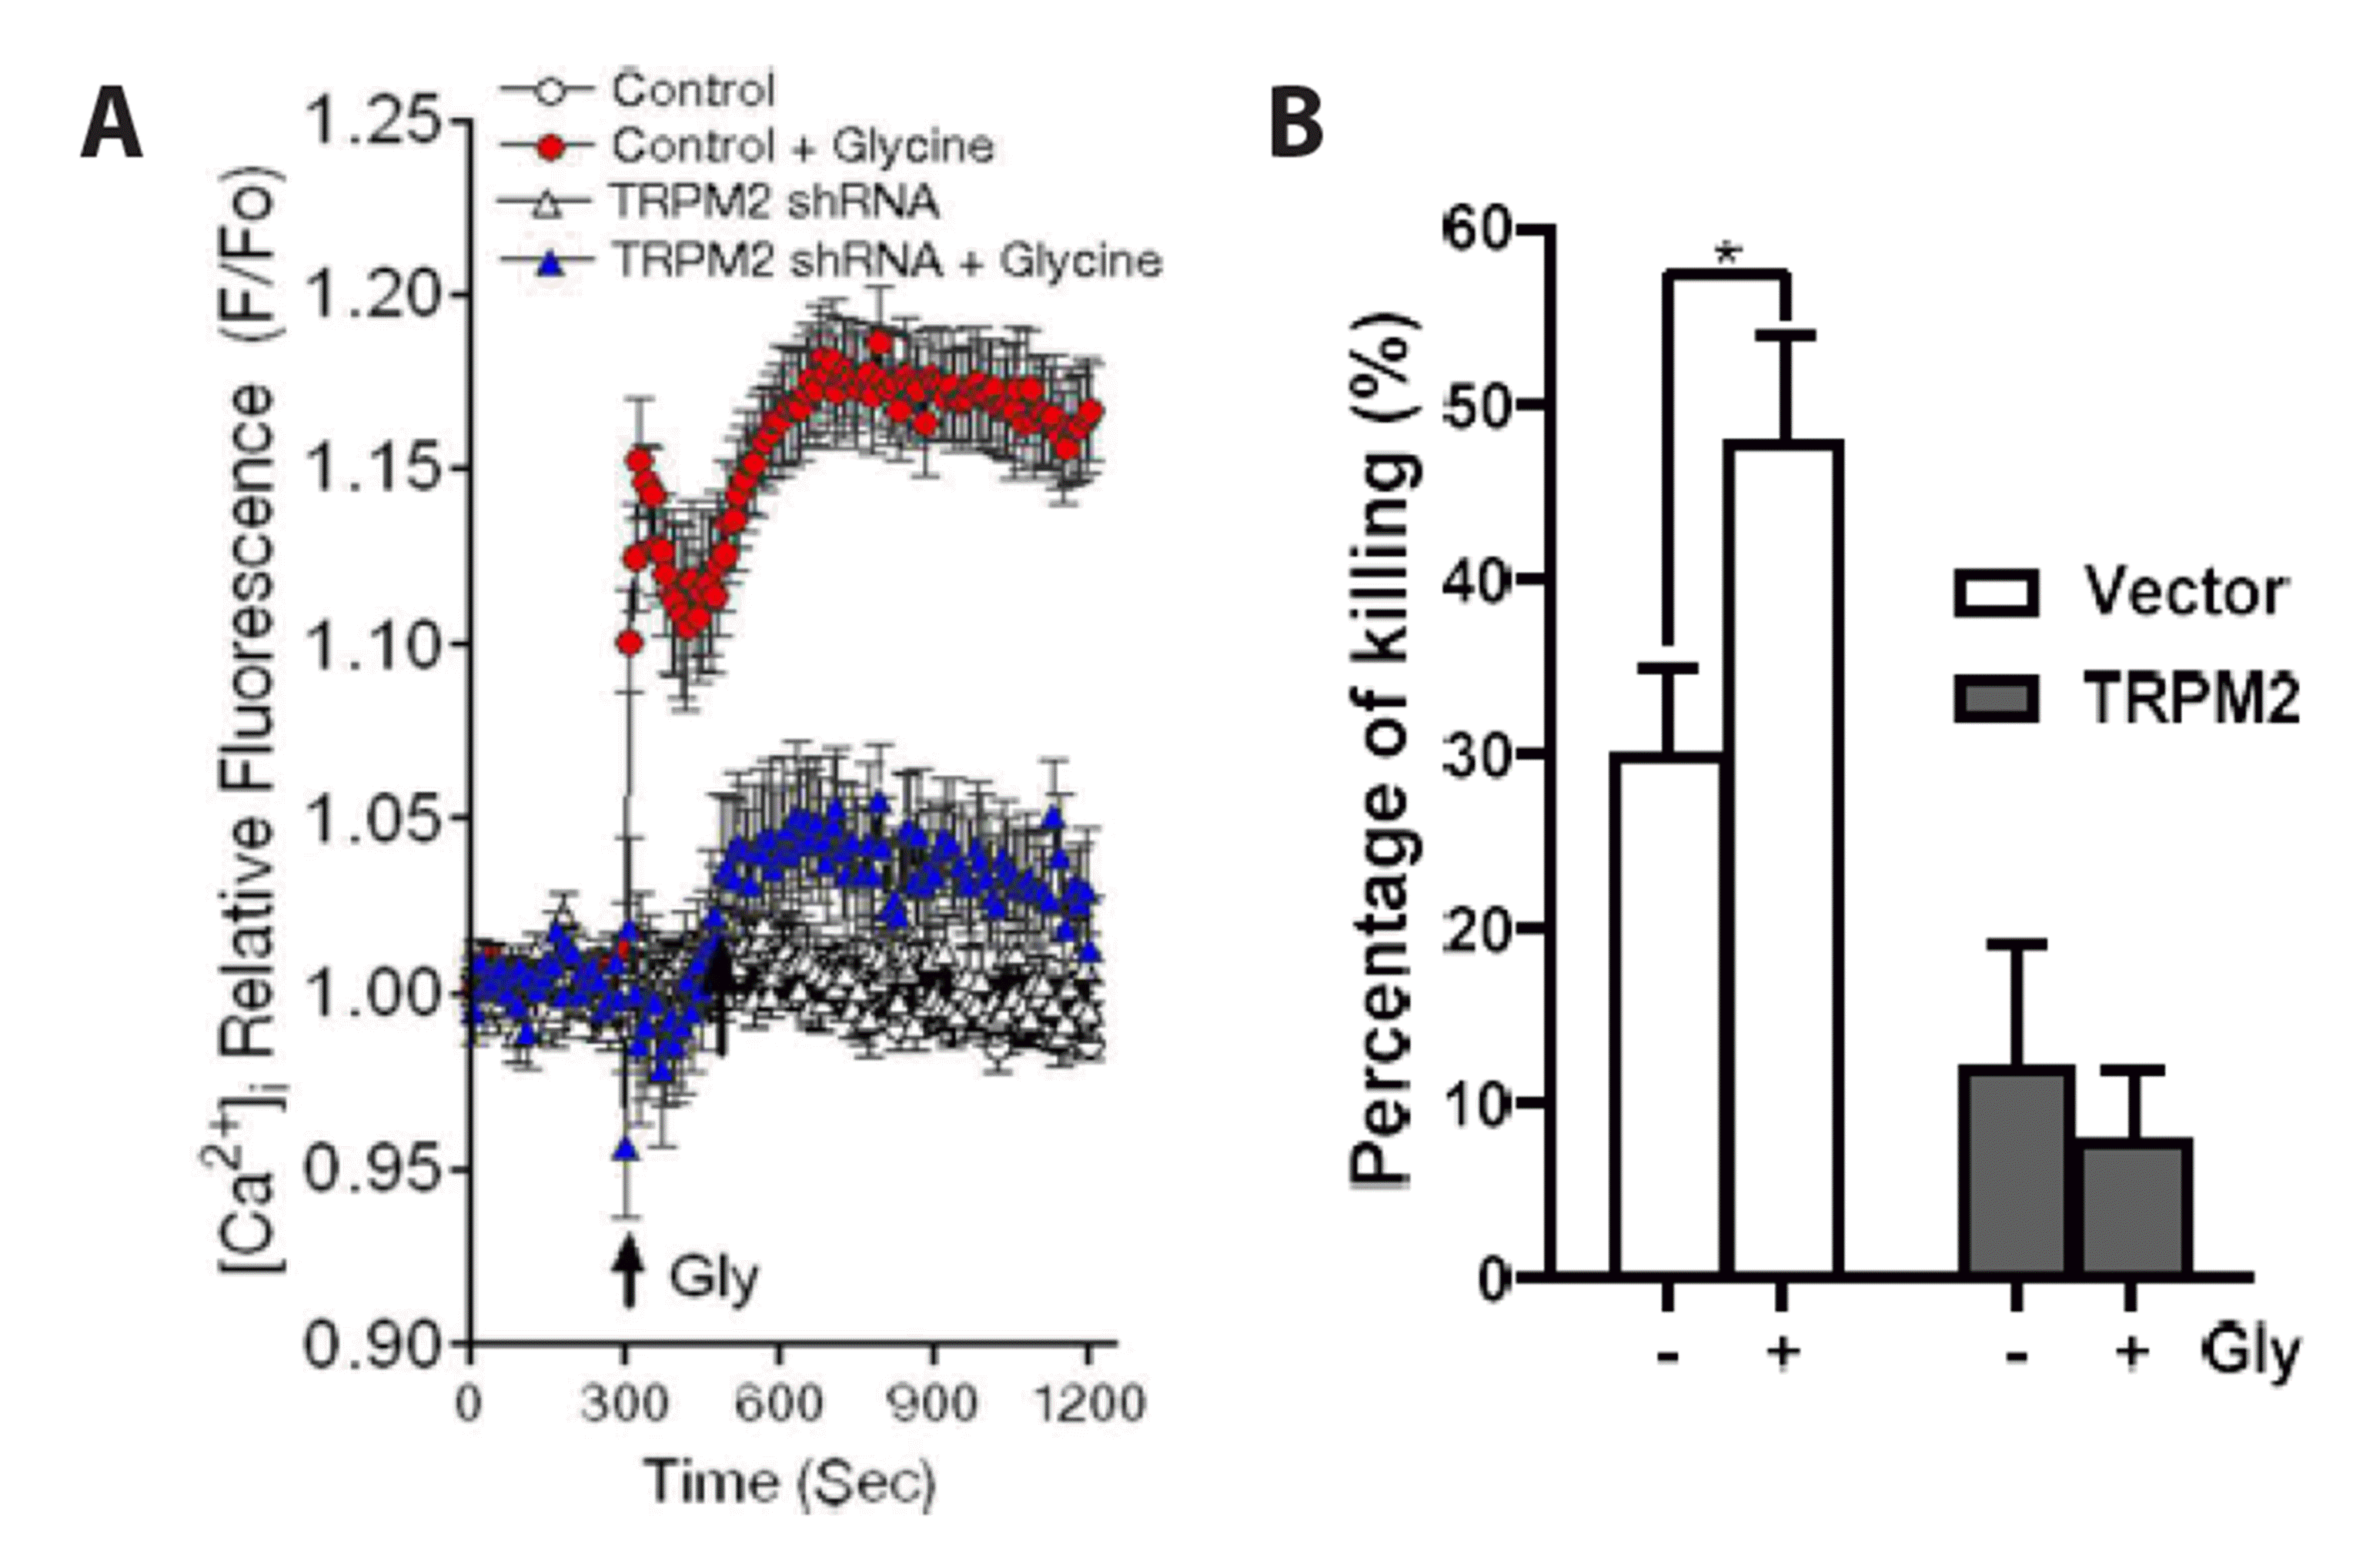 | Fig. 3Effects of TRPM2-specific shRNA on glycine (1 mM)-induced increase in [Ca2+]i in neutrophils (A), and on glycine (500μM)-induced enhancement of bactericidal activity (B).Neutrophils were transfected with shRNA against TRPM2. After 24 h, the effects of glycine on [Ca2+]i. in neutrophils (A) and bactericidal activity (B) were assayed. The average of three experiments is shown (mean ± SE). *p < 0.05 by Student’s t-test.
|
Subcellular localization of GlyRα2 in human neutrophils
 | Fig. 4Subcellular localization of glycine receptor (GlyR)α2 in human neutrophils.(A) Isolated neutrophils were pressurized with N2 gas for 20 min at 350 psi, and cavitated neutrophils were loaded onto three separate Percoll density gradients. After centrifugation, four distinct bands were observed from the bottom, designated as α-band (azurophil granules), β1-band (specific granules), β2-band (tertiary granules), and γ-band (secretory vesicles and plasma membranes). For negative controls, non-transfected HEK 293 cells were used. For positive controls, neutrophils and GlyRα2-transfected HEK 293 cells (HEK+α2) were used. Western blot revealed the localization of GlyRα2 in the γ-band (secretory vesicles and plasma membranes), with or without blocking peptide against GlyRα2. Exposure of neutrophils to E. coli or phorbol myristate acetate (PMA) effectively translocated GlyR to the plasma membrane. Representative fluorescein isothiocyanate (FITC) histograms on membrane expression of GlyRα2 in response to E. coli (B) or PMA (C). Neutrophils were treated with E. coli or PMA for 5 min. After fixation, neutrophils were stained with FITC-conjugated anti-GlyRα2 antibody for 30 min. (D) A representative FACS histogram on membrane expression of flavocytochrome b588 in response to E. coli. Neutrophils were exposed to E. coli for 20 min.
|
Glycine enhances azurophil granule-phagosome fusion via p38 MAPK
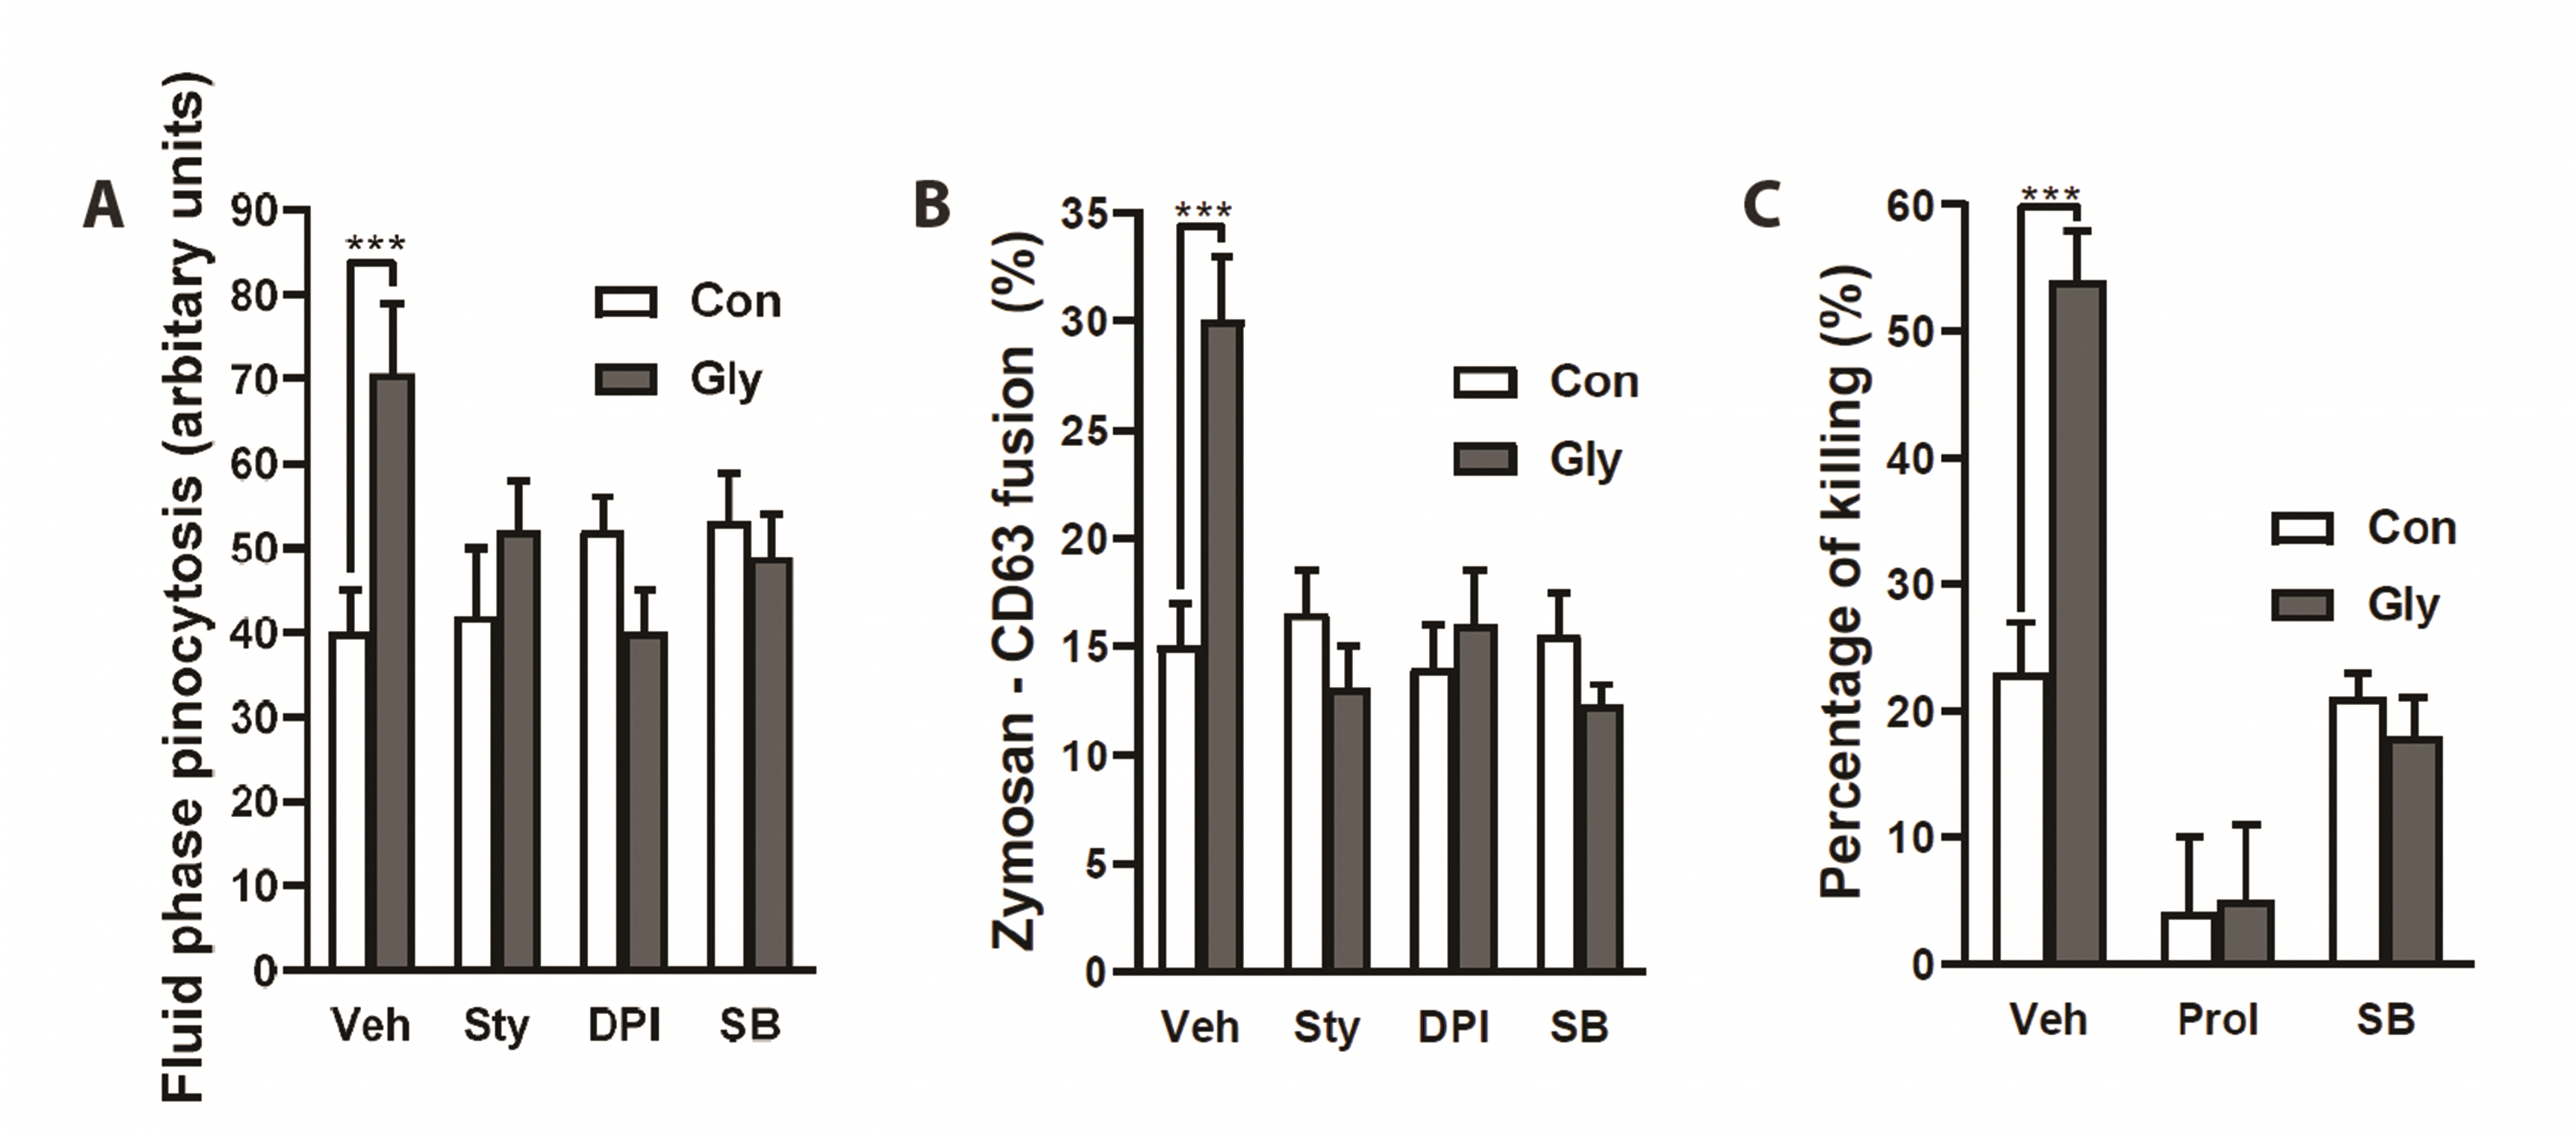 | Fig. 5Glycine enhances azurophil granule-phagosome fusion via p38 mitogen-activated protein kinase (MAPK).(A) Effects of strychnine, diphenylene iodonium (DPI) and SB203580 on glycine-induced enhancement of fluid-phase pinocytosis. Uptake of Lucifer yellow in neutrophils was measured as fluid-phase pinocytosis. Neutrophils were exposed to E. coli for 20 min. Unphagocytosed E. coli was washed away and neutrophils were further incubated with glycine (500 μM) for 15 min in the presence of 0.5 mg/ml Lucifer yellow. Strychnine (1 μM), DPI (1 μM) or SB203580 (10 μM) was added during 15 min of incubation. Neutrophils were lysed with ice-cold distilled water for 1 h and fluorescence was measured. (B) Effects of strychnine, DPI, and SB203580 on zymosan-CD63 fusion. Neutrophils were allowed to ingest Texas Red-conjugated zymosan for 20 min. Unphagocytosed zymosan particles were washed away and neutrophils were further incubated with glycine in the presence of strychnine, DPI, or SB203580. Neutrophils were fixed and stained with anti-CD63 antibody. Stacks of 12–16 confocal images were collected with an LSM 510 laser-scanning confocal microscope (Carl Zeiss, Jena, Germany) and analyzed by LSM Image Examiner software (Carl Zeiss). The fusion of CD63 and zymosan particles was analyzed by measuring the area of co-localization between CD63 and zymosan particles, which was divided by total intracellular zymosan area in confocal images of neutrophils at each slice of 0.52 μm in thickness. (C) Effects of protease inhibitor cocktail and SB203580 on glycine-induced enhancement of bactericidal activity. Neutrophils were pretreated with a protease inhibitor cocktail or SB203580 for 1 h before E. coli exposure. (A–C) The average of three experiments is shown (mean ± SE). ***p < 0.001 by Student’s t-test.
|


 PDF
PDF Citation
 Print
Print


 XML Download