

 PDF
PDF Citation
 Print
Print


INTRODUCTION
MATERIALS AND METHODS
Subjects
Table 1
![]()
Treatment modality
Cephalometric analysis
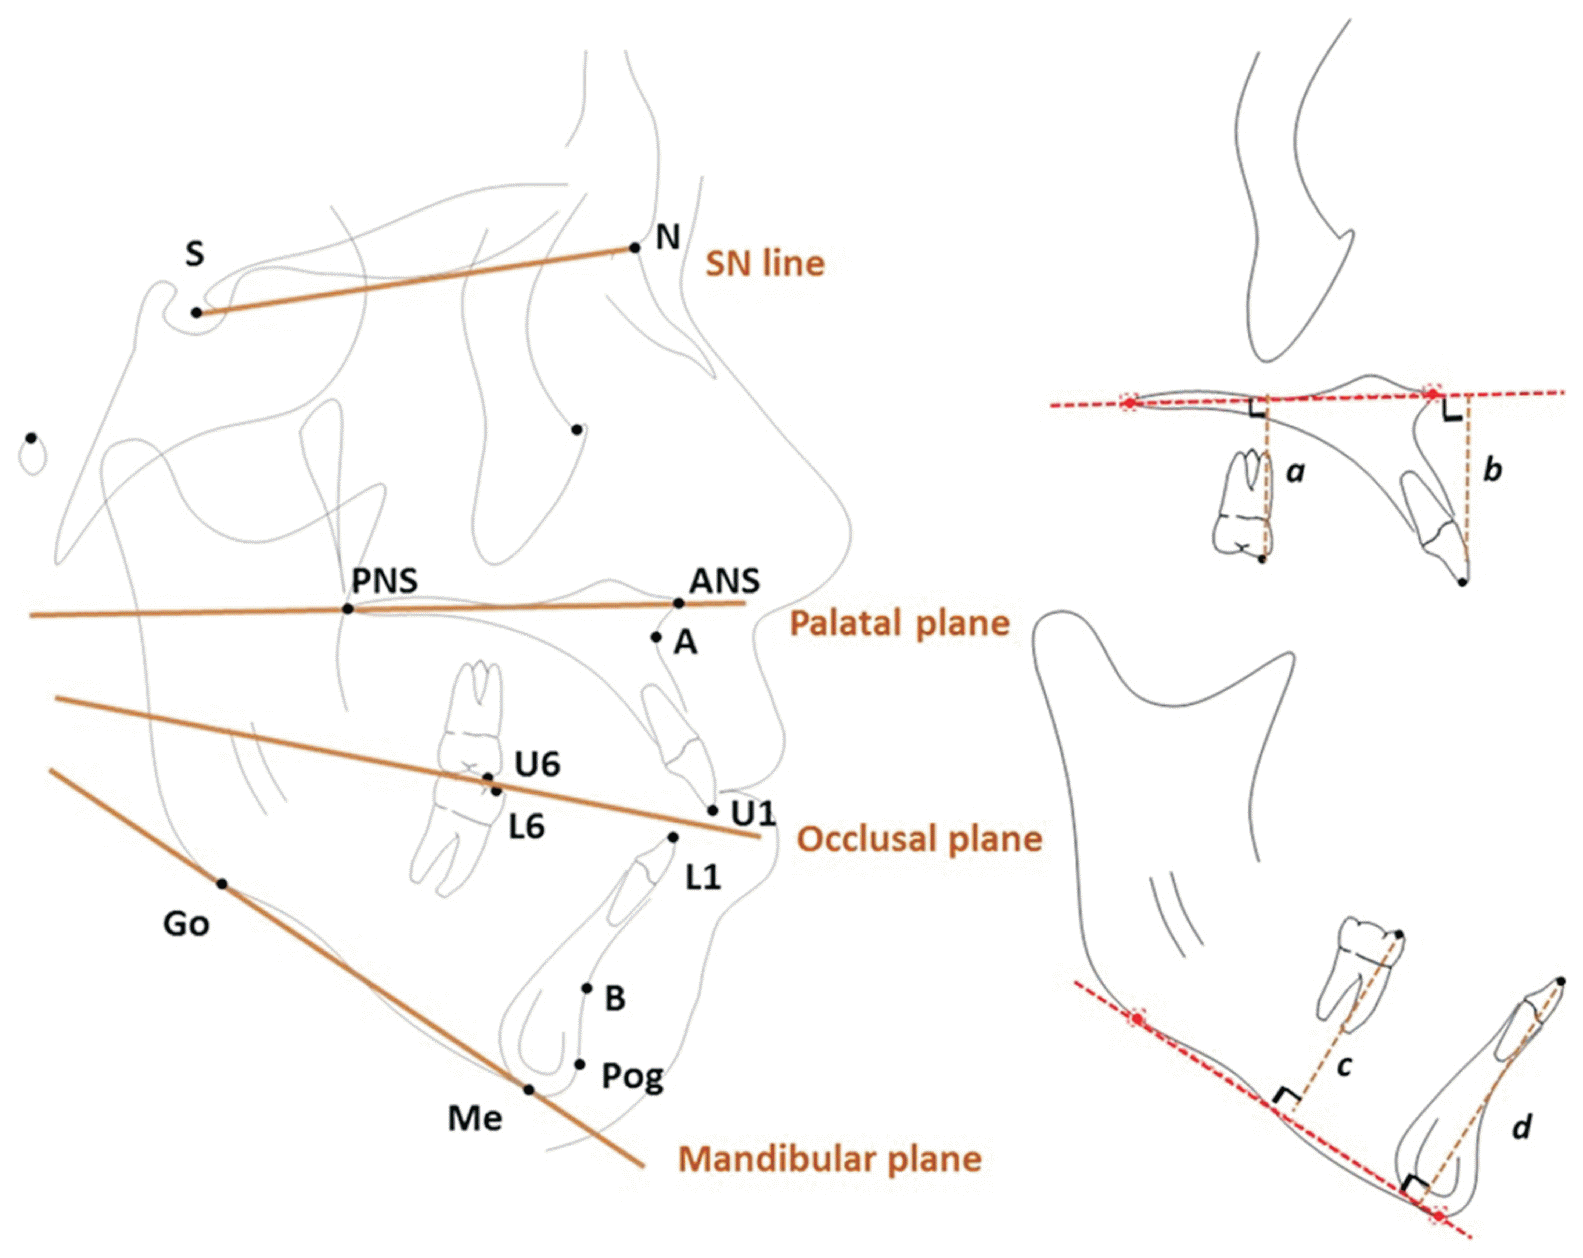 | Figure 1Cephalometric landmarks, reference planes, and dentoalveolar linear measurements used in this study. Measurements were measured using the same reference planes at T1 and T2 tracings. a (U6-PP), perpendicular distance between mesiobuccal cusp of maxillary 1st molar and palatal plane (ANS-PNS) (mm); b (U1-PP), perpendicular distance between incisal edge of maxillary central incisor and palatal plane (mm); c (L6-MP), perpendicular distance between mesiobuccal cusp of mandibular 1st molar and mandibular plane (Go-Me) (mm); d (L1-MP), perpendicular distance between incisal edge of mandibular central incisor and mandibular plane (mm).
T1, before treatment; T2, after treatment; S, sella; N, nasion; A, A point; B, B point; Pog, pogonion; Go, gonion; Me, menton; ANS, anterior nasal spine; PNS, posterior nasal spine.
|
Evaluation of programmed tooth movements in ClinCheck®
Statistical analysis
RESULTS
Cephalometric analysis
Table 2
| Measurement | T1 | T2 | Changes (T2-T1) | ||||||||||||
|---|---|---|---|---|---|---|---|---|---|---|---|---|---|---|---|
| Mean | SD | Min | Max | Mean | SD | Min | Max | Mean | SD | Min | Max | p-value | |||
| ANB (°) | 4.21 | 2.65 | −1.60 | 9.90 | 4.10 | 2.66 | −1.95 | 9.40 | −0.11 | 0.46 | −2.00 | 0.80 | 0.05 | ||
| SNA (°) | 79.47 | 4.05 | 71.70 | 90.30 | 79.51 | 4.13 | 71.70 | 90.65 | 0.04 | 0.20 | −0.75 | 0.65 | 0.07 | ||
| SNB (°) | 75.26 | 4.67 | 65.70 | 88.65 | 75.42 | 4.63 | 66.90 | 88.50 | 0.16 | 0.44 | −1.00 | 1.40 | 0.004** | ||
| OPA (°) | 20.68 | 5.42 | 5.00 | 34.40 | 21.23 | 5.88 | 3.45 | 32.65 | 0.54 | 2.21 | −3.35 | 8.05 | 0.05 | ||
| MPA (°) | 41.07 | 7.41 | 22.75 | 57.75 | 40.64 | 7.41 | 23.20 | 57.65 | −0.42 | 0.95 | −2.35 | 3.40 | 0.004** | ||
| LFH (mm) | 72.64 | 5.41 | 59.30 | 87.15 | 72.04 | 5.64 | 59.30 | 86.50 | −0.60 | 1.10 | −3.05 | 3.40 | < 0.001*** | ||
| IIA (°) | 122.78 | 9.13 | 100.95 | 143.35 | 132.80 | 8.42 | 112.90 | 152.80 | 10.02 | 6.40 | −5.55 | 30.25 | < 0.001*** | ||
| U1SNA (°) | 102.04 | 6.81 | 89.30 | 120.40 | 96.35 | 7.30 | 83.00 | 116.95 | −5.69 | 4.38 | −21.75 | 3.95 | < 0.001*** | ||
| IMPA (°) | 94.11 | 7.11 | 75.60 | 109.10 | 90.22 | 7.67 | 67.40 | 104.20 | −3.89 | 4.55 | −16.00 | 13.55 | < 0.001*** | ||
| OB (mm) | −2.21 | 1.39 | −6.55 | −0.55 | 1.09 | 0.80 | −0.85 | 2.85 | 3.30 | 1.43 | 0.70 | 7.05 | < 0.001*** | ||
| OJ (mm) | 3.22 | 2.05 | −2.75 | 10.75 | 2.64 | 0.69 | 0.80 | 5.75 | −0.59 | 1.94 | −8.85 | 4.65 | 0.01* | ||
| U6-PP (mm) | 24.99 | 2.38 | 20.35 | 31.30 | 24.63 | 2.44 | 19.70 | 31.80 | −0.36 | 0.58 | −1.85 | 1.25 | < 0.001*** | ||
| U1-PP (mm) | 29.80 | 2.83 | 23.65 | 38.35 | 31.01 | 2.92 | 24.40 | 38.40 | 1.20 | 0.93 | −0.45 | 3.90 | < 0.001*** | ||
| L6-MP (mm) | 33.85 | 2.78 | 28.90 | 42.80 | 33.73 | 2.82 | 28.80 | 42.05 | −0.12 | 0.47 | −1.00 | 1.35 | 0.04* | ||
| L1-MP (mm) | 37.39 | 3.37 | 30.50 | 43.85 | 38.75 | 3.85 | 32.15 | 47.70 | 1.36 | 1.30 | −1.60 | 4.70 | < 0.001*** | ||
ANB, point A-nasion-poing B angle; SNA, sella-nasion-point A angle; SNB, sella-nasion-point B angle; OPA, occlusal plane angle; MPA, mandibular plane angle; LFH, lower facial height; IIA, interincisal angle; U1SNA, upper incisor to sella-nasion angle; IMPA, incisor mandibular plane angle; OB, overbite; OJ, overjet.
Paired sample t-tests were performed to compare T1 and T2 difference. *p < 0.05; **p < 0.01; ***p < 0.001.
See Figure 1 for definitions of the other measurement.
![]()
Table 3
| Measure-ment | Class I (n = 44) | Class II (n = 16) | Class III (n = 9) | p-value‡ | |||||||||||
|---|---|---|---|---|---|---|---|---|---|---|---|---|---|---|---|
| T1 | T2 | T2-T1 | p-value† | T1 | T2 | T2-T1 | p-value† | T1 | T2 | T2-T1 | p-value† | ||||
| ANB (°) | 4.30 ± 2.37 | 4.17 ± 2.47 | −0.14 ± 0.39 | 0.02* | 5.51 ± 2.75 | 5.32 ± 2.75 | −0.20 ± 0.65 | 0.25 | 1.43 ± 1.78 | 1.58 ± 1.74 | 0.15 ± 0.35 | 0.24 | 0.21 | ||
| SNA (°) | 79.20 ± 3.79 | 79.24 ± 3.85 | 0.04 ± 0.13 | 0.05 | 78.72 ± 4.06 | 78.75 ± 4.17 | 0.03 ± 0.33 | 0.74 | 82.08 ± 4.72 | 82.17 ± 4.8 | 0.09 ± 0.16 | 0.14 | 0.78 | ||
| SNB (°) | 74.90 ± 3.99 | 75.08 ± 4.02 | 0.18 ± 0.41 | 0.006** | 73.22 ± 4.04 | 73.44 ± 4.02 | 0.22 ± 0.57 | 0.15 | 80.64 ± 5.2 | 80.58 ± 5.14 | −0.06 ± 0.27 | 0.51 | 0.16 | ||
| OPA (°) | 20.96 ± 5.09 | 21.36 ± 4.86 | 0.40 ± 1.57a | 0.10* | 22.11 ± 4.94 | 24.50 ± 5.52 | 2.40 ± 2.51b | 0.002** | 16.83 ± 6.58 | 14.76 ± 6.41 | −2.07 ± 1.28c | 0.001** | < 0.001*** | ||
| MPA (°) | 40.82 ± 7.36 | 40.42 ± 7.53 | −0.45 ± 0.67ac | 0.001** | 44.63 ± 6.35 | 43.84 ± 6.60 | −0.80 ± 0.91a | 0.003** | 35.91 ± 6.61 | 36.07 ± 5.93 | 0.16 ± 1.46c | 0.76 | 0.04* | ||
| LFH (mm) | 72.52 ± 5.66 | 71.87 ± 5.80 | −0.65 ± 0.93ac | < 0.001*** | 71.90 ± 4.93 | 70.95 ± 5.10 | −0.95 ± 1.00a | 0.002** | 74.57 ± 5.09 | 74.8 ± 5.44 | 0.23 ± 1.67c | 0.69 | 0.02* | ||
| IIA (°) | 122.33 ± 8.25 | 130.70 ± 8.14 | 9.38 ± 4.88 | < 0.001*** | 121.19 ± 10.61 | 132.95 ± 8.73 | 11.77 ± 9.73 | < 0.001*** | 127.81 ± 9.87 | 137.84 ± 8.26 | 10.04 ± 5.85 | < 0.001*** | 0.61 | ||
| U1SNA (°) | 101.94 ± 6.20 | 96.70 ± 6.23 | −5.24 ± 3.36a | < 0.001*** | 100.79 ± 6.49 | 92.02 ± 6.91 | −8.76 ± 5.71b | < 0.001*** | 104.75 ± 9.88 | 102.31 ± 8.74 | −2.44 ± 2.99a | 0.04* | 0.003** | ||
| IMPA (°) | 94.91 ± 7.05 | 91.19 ± 7.80 | −3.72 ± 3.29a | < 0.001*** | 93.38 ± 7.55 | 91.20 ± 6.04 | −2.18 ± 6.39a | 0.19 | 91.53 ± 6.56 | 83.78 ± 7.09 | −7.75 ± 4.31c | < 0.001*** | 0.005** | ||
| OB (mm) | −2.20 ± 1.50 | 1.10 ± 0.71 | 3.30 ± 1.46 | < 0.001*** | −2.55 ± 1.36 | 1.08 ± 0.96 | 3.63 ± 1.43 | < 0.001*** | −1.66 ± 0.56 | 1.06 ± 0.98 | 2.72 ± 1.17 | < 0.001*** | 0.48 | ||
| OJ (mm) | 3.28 ± 1.46 | 2.71 ± 0.70 | −0.57 ± 1.41a | 0.01* | 4.63 ± 2.26 | 2.63 ± 0.64 | −2.00 ± 2.22b | 0.003** | 0.43 ± 1.34 | 2.26 ± 0.7 | 1.83 ± 1.29c | 0.003** | < 0.001*** | ||
| U6-PP (mm) | 24.88 ± 2.23 | 24.49 ± 2.23 | −0.39 ± 0.51a | < 0.001*** | 24.35 ± 2.50 | 23.79 ± 2.55 | −0.56 ± 0.51a | < 0.001*** | 26.66 ± 2.35 | 26.81 ± 2.22 | 0.14 ± 0.74c | 0.58 | 0.01* | ||
| U1-PP (mm) | 29.72 ± 2.84 | 30.89 ± 2.91 | 1.16 ± 0.86ac | < 0.001*** | 29.44 ± 2.65 | 31.20 ± 2.97 | 1.76 ± 1.00a | < 0.001*** | 30.85 ± 3.16 | 31.27 ± 3.2 | 0.42 ± 0.48c | 0.03* | 0.002** | ||
| L6-MP (mm) | 33.98 ± 2.94 | 33.82 ± 2.92 | −0.16 ± 0.47 | 0.03* | 33.12 ± 2.47 | 33.07 ± 2.58 | −0.05 ± 0.39 | 0.62 | 34.49 ± 2.47 | 34.47 ± 2.8 | −0.03 ± 0.62 | 0.90 | 0.59 | ||
| L1-MP (mm) | 37.46 ± 3.25 | 38.81 ± 3.43 | 1.35 ± 0.94a | < 0.001*** | 35.67 ± 3.15 | 36.28 ± 3.23 | 0.61 ± 1.53a | 0.13 | 40.07 ± 2.62 | 42.84 ± 3.47 | 2.77 ± 1.37c | < 0.001*** | < 0.001*** | ||
![]()
Table 4
| Predictors | ∆Overbite (mm) | |||
|---|---|---|---|---|
| Estimates | CI | p-value | ||
| Model 1 | Intercept | 0.57 | 0.22 to 0.91 | 0.002** |
| ∆U1-PP (mm) | 1.01 | 0.84 to 1.17 | < 0.001*** | |
| ∆L1-MP (mm) | 0.83 | 0.71 to 0.95 | < 0.001*** | |
| ∆MPA (°) | −0.92 | −1.08 to −0.75 | < 0.001*** | |
| R2 | 0.831 | |||
| Model 2 | Intercept | 0.42 | 0.05 to 0.79 | 0.028* |
| ∆U1-PP (mm) | 1.08 | 0.91 to 1.24 | < 0.001*** | |
| ∆L1-MP (mm) | 0.78 | 0.66 to 0.91 | < 0.001*** | |
| ∆U6-PP (mm) | −1.2 | −1.49 to −0.91 | < 0.001*** | |
| ∆L6-MP (mm) | −0.74 | −1.07 to −0.42 | < 0.001*** | |
| R2 | 0.836 | |||
![]()
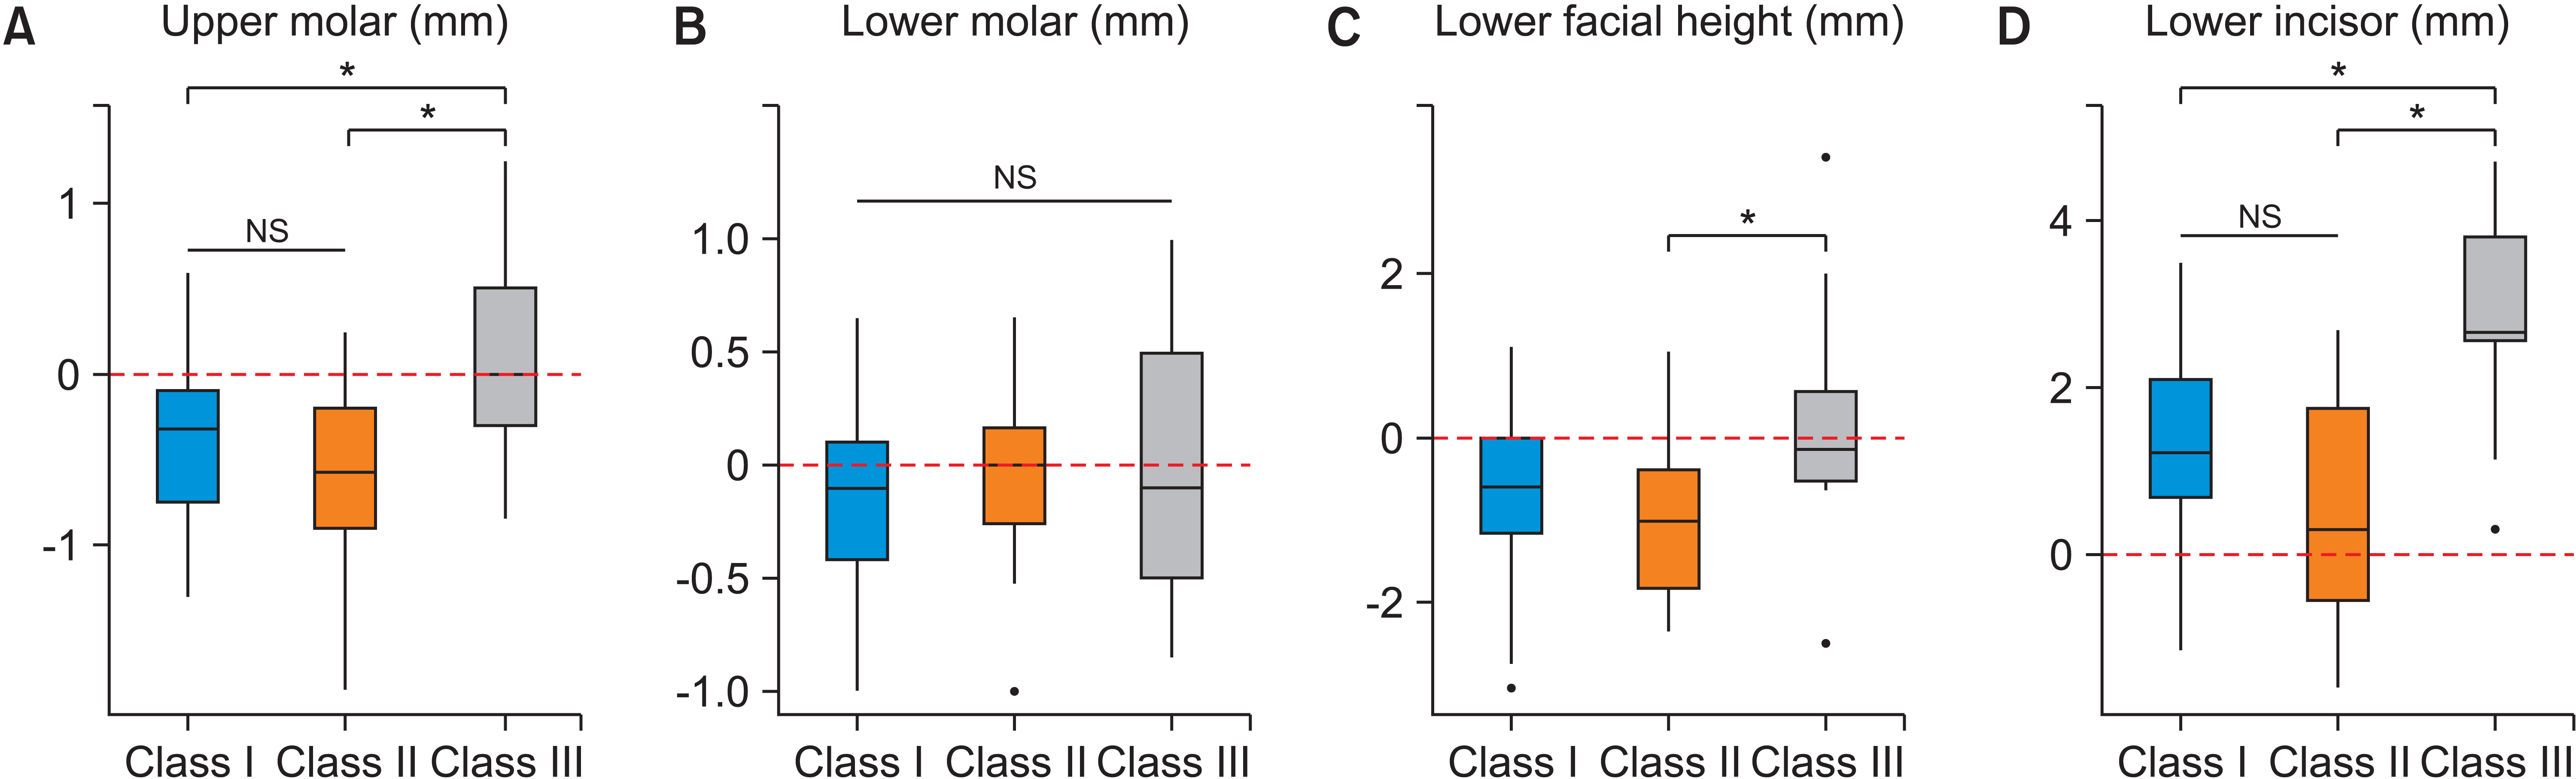 | Figure 2Vertical changes by Angle class groups. A, U6-PP change; B, L6-MP change; C, lower facial height change; D, L1-MP change. Dental intrusion presented as negative value; dental extrusion presented as positive value.
NS, not significant.
* Represents significant difference between the groups. Statistical significance set at p < 0.05.
See Figure 1 for definitions of each measurement.
|
Table 5
| Changes (T1-T2) | Dental open bite group (n = 19) | Skeletal open bite group (n = 50) | |||
|---|---|---|---|---|---|
| Correlation coefficient (r) | p-value | Correlation coefficient (r) | p-value | ||
| ANB | −0.49 | 0.03* | −0.32 | 0.01* | |
| SNA | −0.05 | 0.83 | 0.21 | 0.14 | |
| SNB | 0.51 | 0.03* | 0.44 | 0.001** | |
| OPA | −0.11 | 0.66 | −0.14 | 0.33 | |
| MPA | −0.29 | 0.23 | −0.53 | < 0.001*** | |
| LFH | −0.36 | 0.13 | −0.52 | < 0.001*** | |
| IIA | 0.15 | 0.53 | 0.35 | 0.01* | |
| U1SNA | −0.24 | 0.32 | −0.16 | 0.26 | |
| IMPA | 0.10 | 0.68 | −0.25 | 0.04* | |
| OJ | −0.31 | 0.20 | 0.01 | 0.92 | |
| U6-PP | 0.00 | 0.99 | −0.33 | 0.01* | |
| U1-PP | 0.76 | < 0.001*** | 0.32 | 0.01* | |
| L6-MP | −0.53* | 0.02 | −0.35 | 0.01* | |
| L1-MP | 0.37 | 0.12 | 0.45 | 0.001** | |
![]()
Comparison of planned and actual incisor and molar movements
Table 6
| Vertical movements | Planned movement | Actual movement | ||||||
|---|---|---|---|---|---|---|---|---|
| Class I (n = 44) | Class II (n = 16) | Class III (n = 9) | p-value‡ | Dental open bite group (n = 19) | Skeletal open bite group (n = 50) | p-value‡ | ||
| U6 (mm) | −0.71 ± 0.52a | −1.45 ± 0.78bc | −0.79 ± 0.66ac | < 0.001 | −0.77 ± 0.53 | −0.93 ± 0.72 | 0.34 | |
| L6 (mm) | −0.63 ± 0.56 | −0.48 ± 0.63 | −0.60 ± 0.54 | 0.54 | −0.42 ± 0.45 | −0.66 ± 0.60 | 0.13 | |
| U1 (mm)* | 0.69 ± 1.00 | 0.49 ± 1.05 | 0.31 ± 0.37 | 0.48 | 0.80 ± 1.16 | 0.52 ± 0.86 | 0.29 | |
| L1 (mm)* | 0.11 ± 0.86 | 0.13 ± 0.58 | −0.42 ± 0.99 | 0.19 | 0.08 ± 1.15 | 0.02 ± 0.69 | 0.79 | |
![]()
DISCUSSION
CONCLUSION
Using nonextraction Clear aligner therapy, open bite correction (positive overbite) was achieved in 94% adult patients with anterior open bite.
Clear aligners alone can provide limited but consistent maxillary molar intrusion with maintenance of the vertical position of the mandibular molars. This, in turn, offered reasonable vertical control.
The mechanism of open bite correction using clear aligners in Class III patients was significantly different from that in Class I and Class II patients.
Maxillary incisor extrusion in dental open bite group and MPA reduction with mandibular incisor extrusion in skeletal open bite group are the most significant contributing factors for open bite closure.
 XML Download