

 PDF
PDF Citation
 Print
Print


A laboratory quality system can be built upon a multilayer, interlinking electronic rule system (e.g. delta check, autoverification rules, linearity range check, serum indices check) to minimize the risk of errors and ensure patient safety. The quality system may include autoverification limits that check for gross errors at the individual result level [1-5]. Additionally, it may include delta checks, in which the current patient result is compared to the preceding one for significant differences, indicating an error [6–10]. Patient-based quality control can be applied for the detection of population-level shifts and/or drifts [11-14].
Laboratory practitioners must understand the clinical sensitivity and specificity of implemented autoverification rules to make an informed decision pertaining to the clinical risk. Currently, there exists a paucity of evidence-based approach on defining the clinical sensitivity and specificity of autoverification rules. We describe a simple approach to objectively define the clinical performance of laboratory-specific autoverification limits. This study was undertaken as part of an effort to optimize the autoverification limits and was exempted from ethics approval (Domain-Specific Review Board, Singapore; reference number: 2016/01115).
The definitions of autoverification limits and clinical performance are provided below:
Autoverification limits: Numerical threshold values within which the laboratory results are assumed to not contain significant/gross errors and are safe to be released without scientific or clinical review.
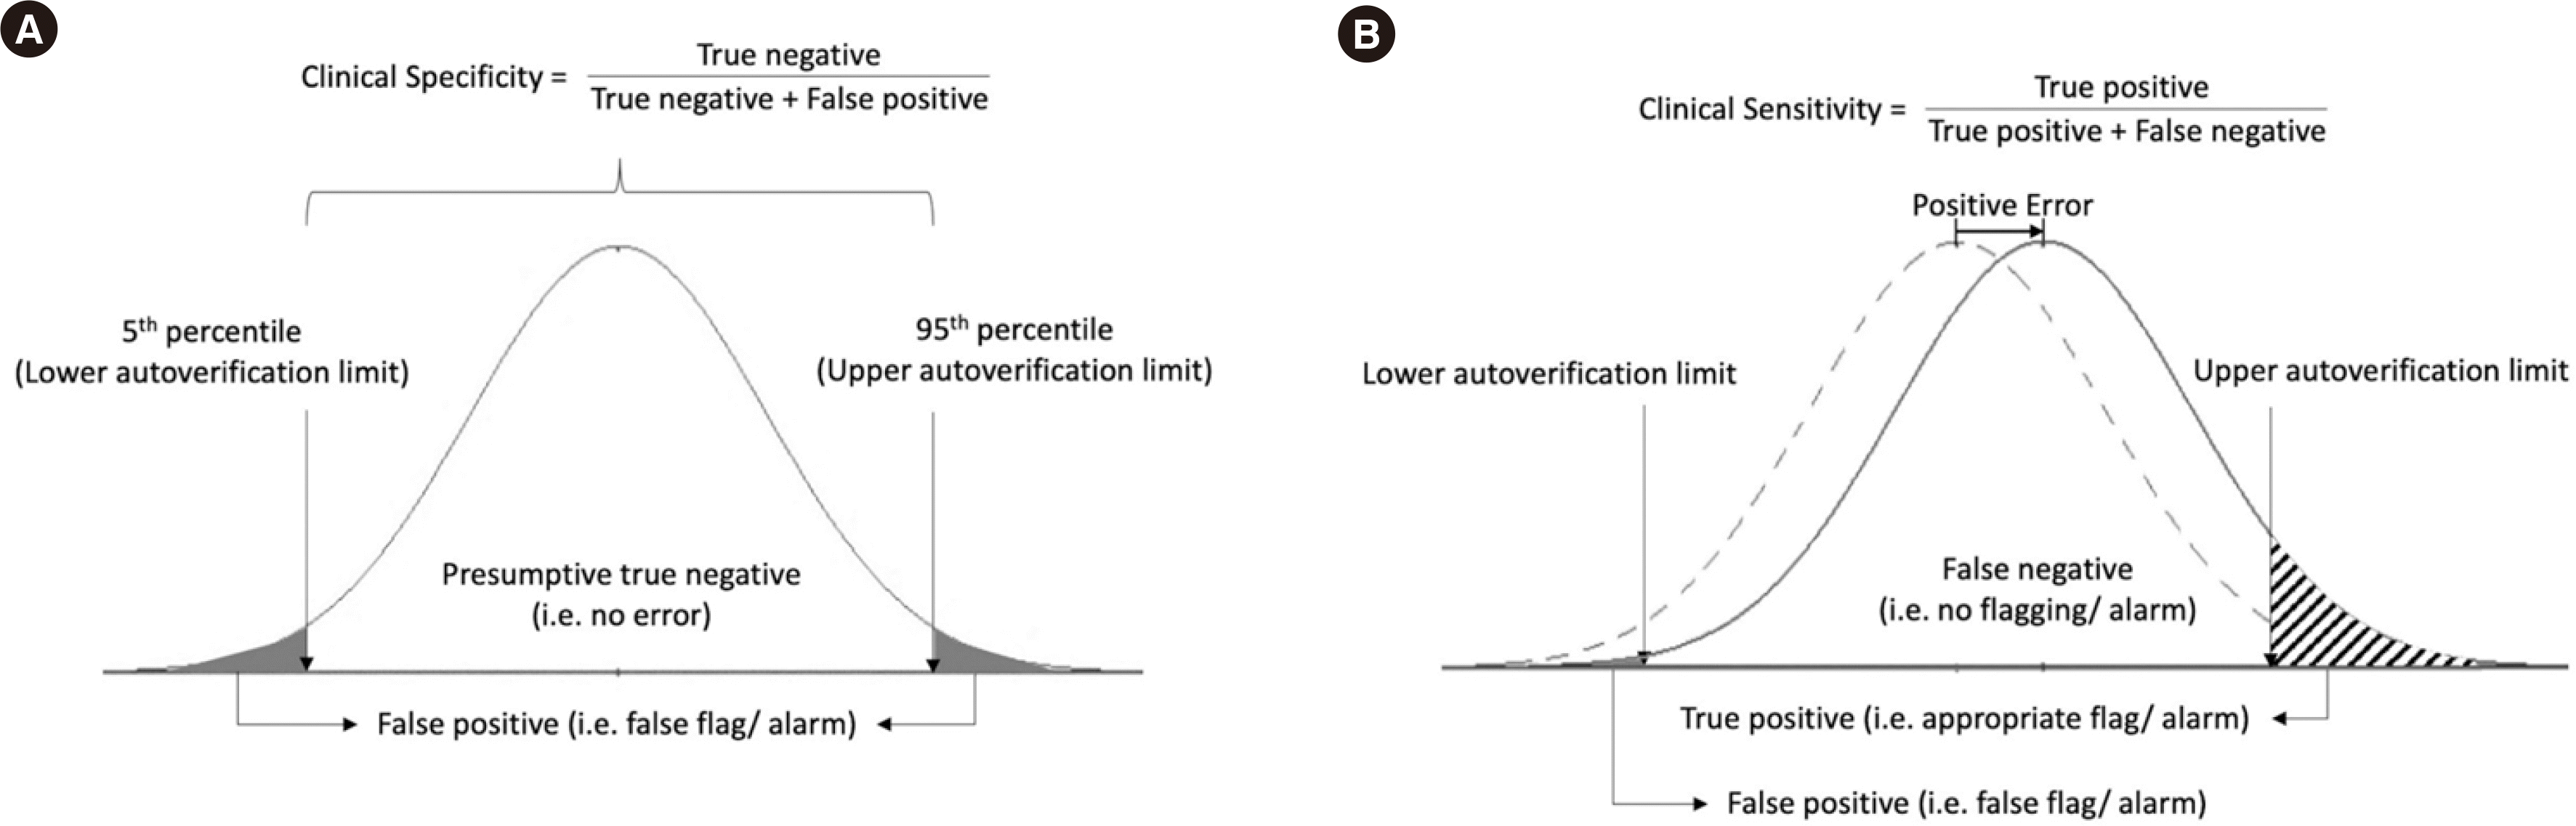
Clinical specificity: Probability of the chosen set of autoverification limits to correctly identify results without errors, calculated as: true negatives/(true negatives + false positives).
Clinical sensitivity: Probability of the chosen set of autoverification limits to correctly identify results with a predefined magnitude of bias, calculated as: true positives/(true positives + false negatives).
Anonymized historical data for 12 general biochemistry serum measurands from a laboratory serving community-ambulatory subjects (National University Hospital, Kent Ridge, Singapore) were collected as previously described [15]. The data were assumed to be error-free and were Box-Cox-transformed to approximate a Gaussian distribution using an automated online tool with default settings (http://www.wessa.net/rwasp_boxcoxnorm.wasp) [16].
As the laboratory data were assumed to be error-free, results falling within any selected autoverification limits were considered true negatives, whereas those falling outside the limits were considered false positives (Fig. 1A). When the percentile values of the overall data distribution are used as autoverification limits, this coincides with the clinical specificity. For example, if the 5th and 95th percentile values of the overall data distribution are taken as the autoverification limits, the clinical specificity of this set of autoverification limits will be 90%. If only one side of the autoverification limit is set, e.g., the 95th percentile value, the clinical specificity will be 95% [6, 7]. We selected a clinical specificity of 90% to maintain the false alarm rate at 10%.
Once the autoverification limits fulfilling the predefined clinical specificity have been determined and the magnitude of tolerable total error for the autoverification rules to be assessed against has been defined, the clinical sensitivity can be determined. The analytical performance specifications of the Royal College of Pathologists Australasia Quality Assurance Program were selected as the source of tolerable total error for 12 measurands [17]. The total error was applied to the extracted laboratory data before being Box-Cox transformed. The transformed laboratory data exceeding the autoverification limits were considered true positive, whereas those falling within the limits were considered false negative (Fig. 1B).
For a standard normal distribution with a positive bias, the clinical sensitivity for a one-tailed detection can be obtained by examining the probability of observing a Z-value that is higher than the Z-value corresponding to the autoverification limit for the error-free distribution. This is mathematically represented as:
clinical sensitivity (one-tailed)=probability
[Z>critical Z-value at upper autoverification limits].
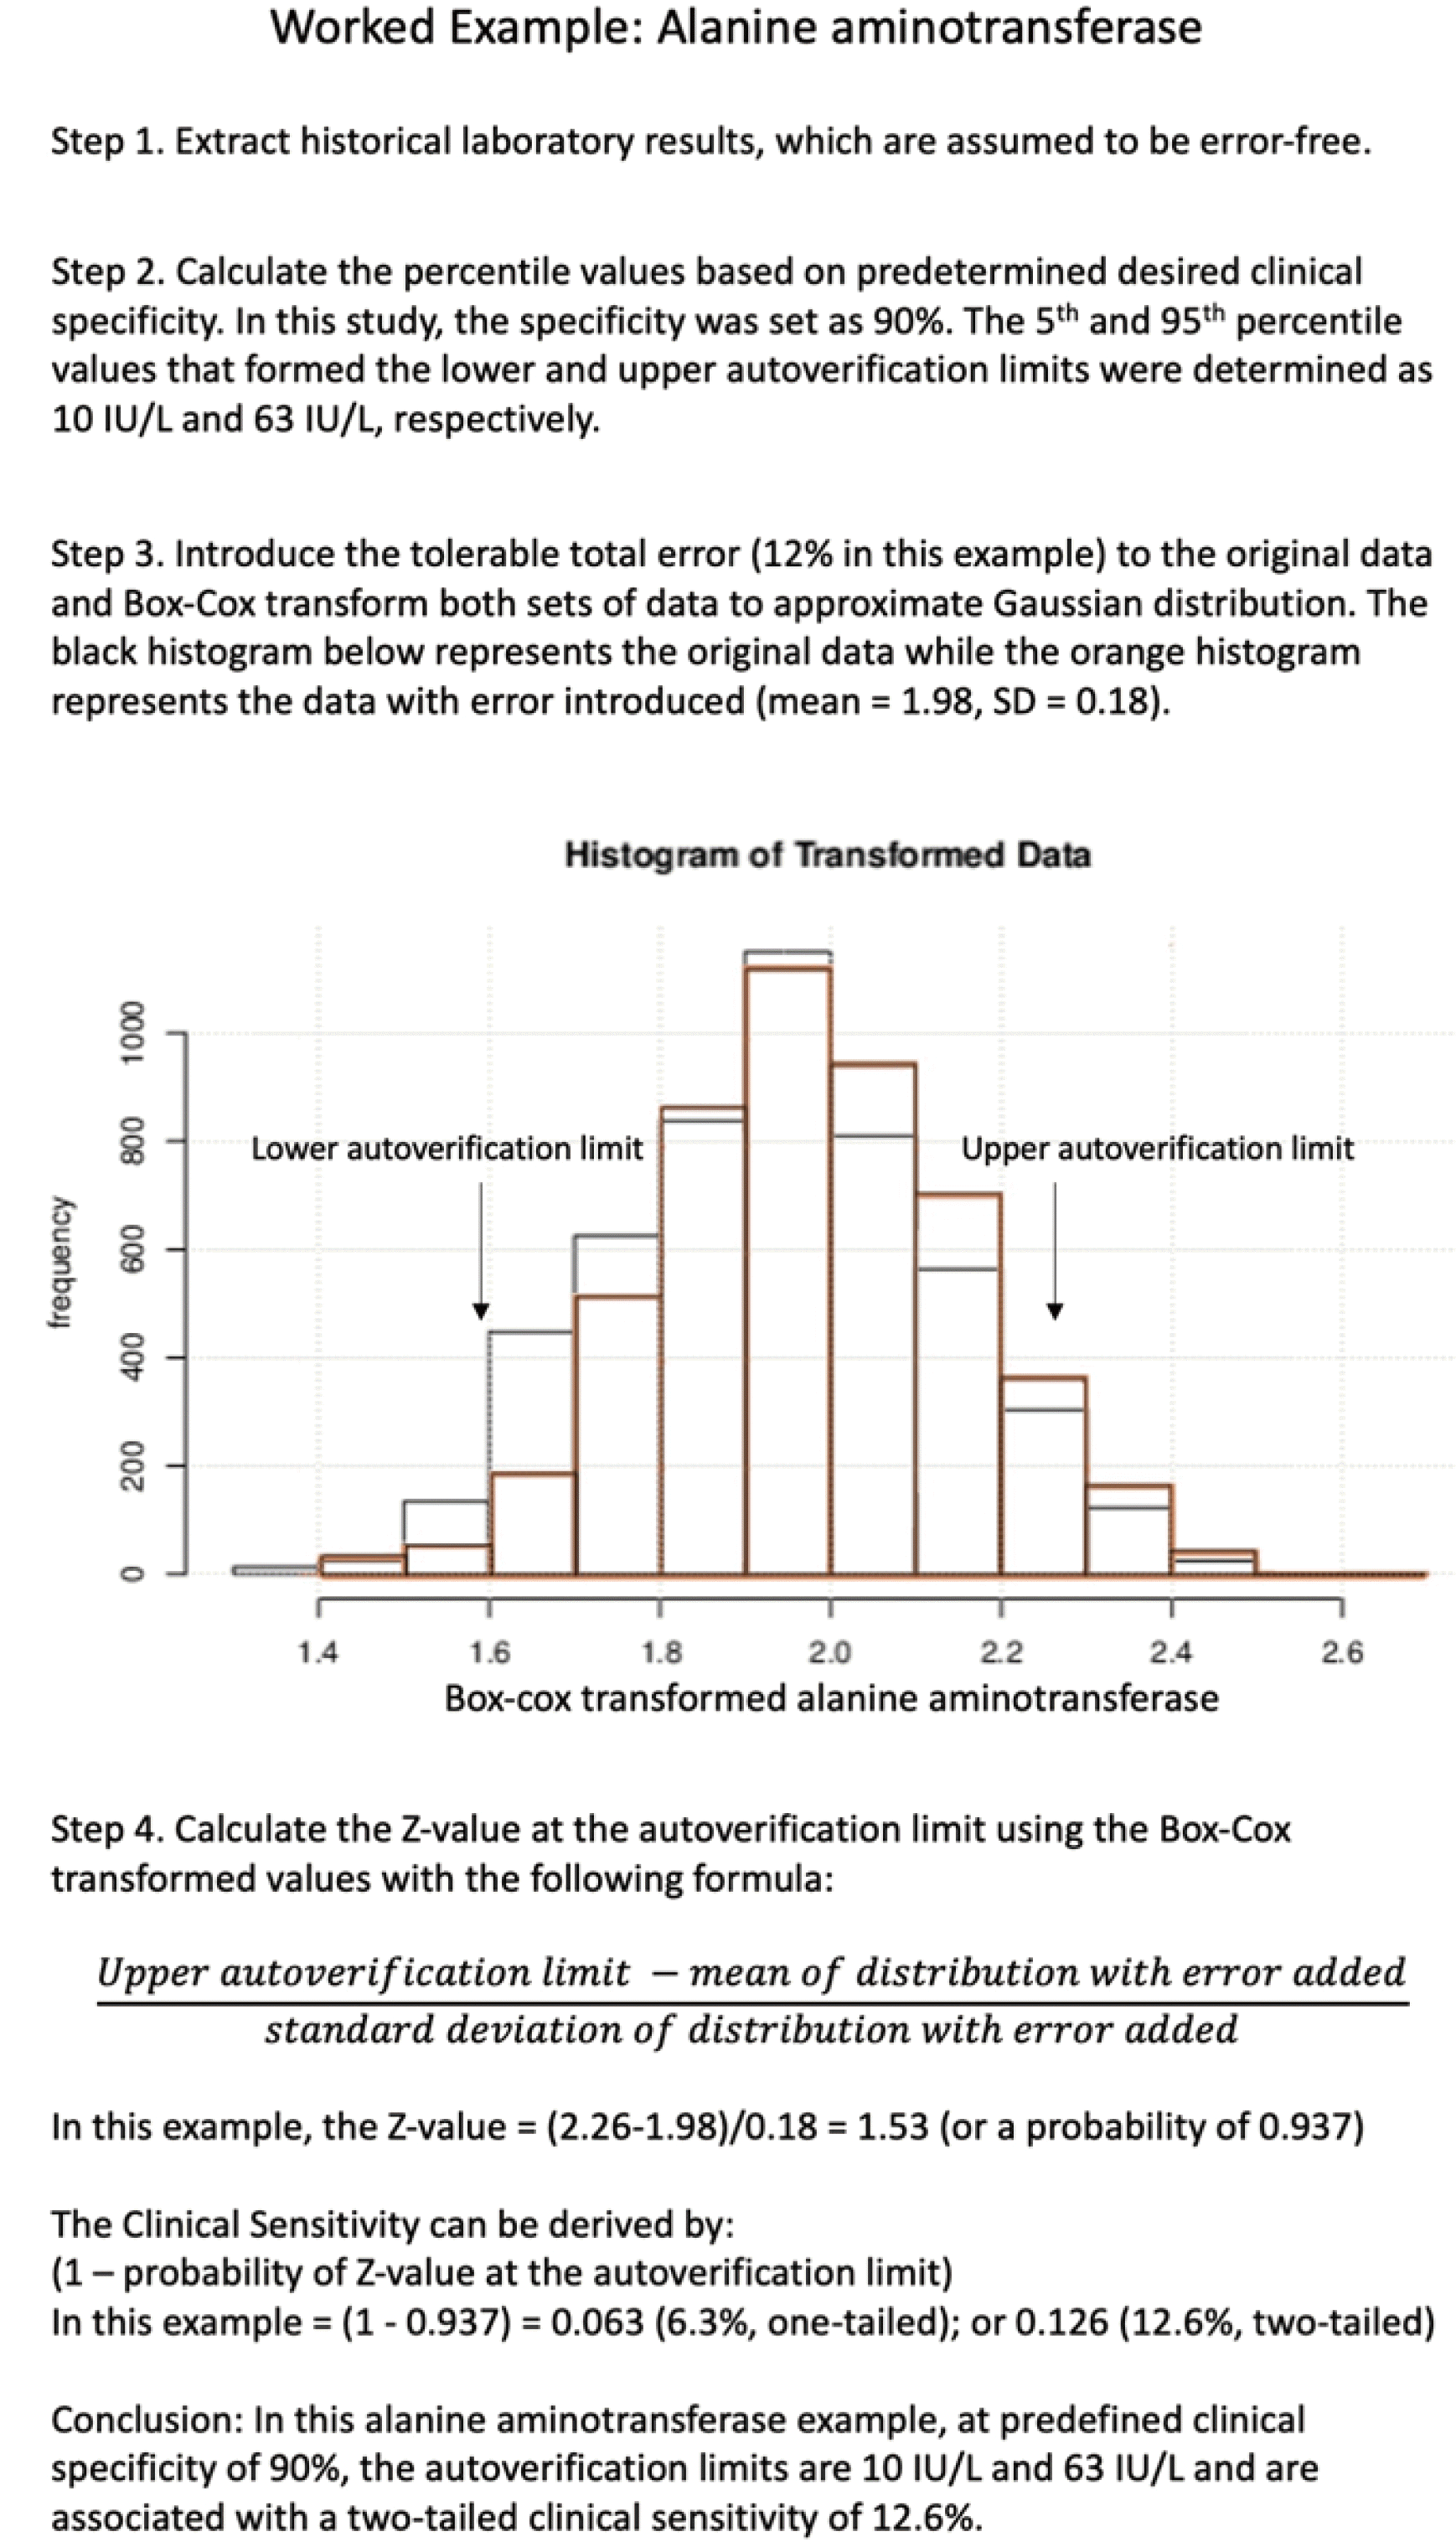
For a two-tailed detection, the probability is multiplied by two as the positive and negative bias can be detected by the upper and lower autoverification limits, respectively. A step-by-step protocol for alanine aminotransferase as an example is provided in Fig. 2. The other 11 measurands were analyzed in the same manner. The data for the 12 general biochemistry measurands required variable degrees of Box-Cox transformation, with optimal lambdas ranging from –0.66 to 2.00 (Table 1) [16]. The 5th and 95th percentile values (corresponding to a clinical specificity of 90%) of the transformed distribution were determined (Table 1). The clinical sensitivities at the autoverification limits derived from the laboratory data after the application of the tolerable total error are summarized in Table 1.
In general, the clinical sensitivities were inversely correlated with between-subject biological variation (Supplemental Data Fig. S1). Serum chloride, with the smallest between-subject biological variation (1.3%), had the highest (two-tailed) clinical sensitivity (100%), whereas γ-glutamyltransferase, with the largest between-subject biological variation (44.5%), had the lowest clinical sensitivity (6.1%). A relatively high clinical sensitivity is required for the autoverification limits (e.g., 80%–95%) to maintain a low false-negative (missed-detection) rate [18].
The combination of an increasingly sophisticated laboratory information technology, the ability to generate large volumes of laboratory data using automation, and the increasing clinical demands for ever shorter sample-to-result times, necessitating a means to release patient results in a timely manner, while ensuring patient safety. In response, autoverification limits have been conceived as an electronic means to release patient results efficiently, without prior scientific or clinical review. The application of autoverification limits has gained significant traction in laboratory practice and is one of the most commonly implemented electronic laboratory rules [1–5].
Several approaches have been described to determine autoverification limits, with the most simplistic approach being setting the reference interval as the autoverification limits [1–5]. The assumption here is that any laboratory results within this interval should not elicit a significant clinical reaction, and they are considered sufficiently benign to be released without manual review. These limits are used primarily to rule out results that may be associated with significant errors. There are also approaches that extend the autoverification limits beyond reference intervals into what could be regarded physiologically extreme ranges, e.g., critical values or physiologically improbable ranges [19]. The latter includes values that are generally not compatible with life (e.g., potassium >8 mmol/L). In this case, the autoverification is geared toward identifying results that likely are associated with gross significant errors. Lastly, autoverification limits can be set based on professional opinion.
The above approaches do not directly inform laboratory practitioners of the clinical performance of the applied autoverification rules, particularly, the clinical sensitivity and its associated false-negative rate. This may lead to the setting of autoverification rules that do not match the acceptable clinical risk profile of the laboratory. The approach described here leverages on the simple concept of probability theory and Z-values, which we have previously applied in the context of delta checks [7]. Clinical specificity and sensitivity have an inverse relationship, and careful tradeoffs must be considered when deciding upon the limits. The need for operational efficiency to return results in a timely manner has often led to laboratories adopting wider autoverification limits (i.e., favoring higher specificity). This study clearly demonstrated the impact of between-subject biological variation on clinical sensitivity. For measurands that have a wide between-subject biological variation, the implementation of wider autoverification limits (i.e., higher specificity) may translate into poorer clinical sensitivity and the inability to direct results with potential errors for manual review.
Our simple approach should help laboratory practitioners consider the risk profile and clinical impacts in the selection and implementation of autoverification limits. A Microsoft Excel tool for determining clinical specificity and clinical sensitivity is included in the Supplemental Data.
 XML Download