

 PDF
PDF Citation
 Print
Print


INTRODUCTION
The ability to maintain bone and skeletal muscle quality is important for leading a long, healthy life. Bone and muscle mass and function are well-known predictors of health outcomes, such as the risk bone of fracture, osteoporosis, sarcopenia, and other muscular dystrophic diseases [1-4]. Of many musculoskeletal dysfunctions, sarcopenia, the aging-related loss of muscular strength and mass is well known and is correlated with loss of bone density [5]. Osteoporosis is characterized by an excessive loss of bone density [6]. Aging-related decreases in muscle and bone mass are accompanied by altered cellular conditions and increased inflammatory conditions [7-9]. Sarcopenia and osteoporosis share physical [10] and biochemical pathophysiological mechanisms [11].
Resistance exercise training (RET) is an effective measure to counter the functional loss of bone and muscle during aging [12]. However, previous studies have demonstrated that some individuals show blunted gain from training adaptation in terms of muscle mass and strength [13], and prevention of bone loss [14,15].
Fibroblast growth factor (FGF) and its receptor, FGFR, can modulate muscle and bone quality because FGF2 has the potential to enhance bone formation via osteoblast-related mechanisms [16,17]. Stimulation with FGFR activates PLCγ/PKCα/Runx2 signaling cascades and promotes osteoblast differentiation [17]. Bone cells secrete signaling molecules such as FGF23 and osteocalcin, which are speculated to act on skeletal muscle to modulate physical performance [18,19]. Previous studies have shown decreased expression of FGF and FGFR signaling with aging [20-23]. Genetic knockdown of FGF-23 showed an aging-like phenotype [24] and the enhancement of FGFR signaling via FGF21 overexpression in a transgenic model increased the lifespan [25]. Despite evidence showing the importance of FGFR signaling in bone and muscle quality with aging, its role in physical performance and RET adaptation related to bone and skeletal muscle still remain unclear.
Therefore, our aim in this study was to investigate the role of FGFR signaling in physical performance using an FGFR antagonist NVP-BGJ398. Furthermore, we evaluated the role of FGFR signaling during 8 weeks of RET and demonstrated that inhibition of this signaling reduced muscle and bone quality, leading to decreased physical performance in mice, which was partly overcome by the 8 weeks of RET.
METHODS
Animal
C57BL/6n mice (male, 8–9 weeks old) were purchased from Orient Bio Inc. (Stock name: C57BL/6NCrljBgi; Orient Bio Inc., Seongnam, Korea), and were managed under the principles established by the college of veterinary medicine animal laboratory in Seoul National University (SNU). The mice were kept at 22°C, 40%–50% humidity and on a 12:12-h light-dark cycle, fed with Rodent chow 5057 (Purina Korea, Seoul, Korea). The food intake was recorded in consequence day. All experimental methods were approved by the SNU Institutional Animal Care and Use Committees. The certification number was SNU-150820-4-6.
The animals were randomly assigned to each of the following groups: inhibition control group (Inh) and sham control group (Sham). At least 6–7 mice were conducted with experiment for each group. FGFR inhibitor NVP-BGJ398 (50 mg/kg body weight; Novartis, Basel, Switzerland) or sham (PEG-300/Glucose 5%, 2:1 mix) were administered by oral gavage as previously described [26]. The treatment was conducted three times per week, throughout the 8 weeks of experimental period.
Exercise apparatus and protocol
Duncan et al. [27]’s ladder training apparatus was adopted in this study for rodent resistance exercise training. Our protocol consists of 8 weeks, 10 sessions a day, and 3 days per week. Before the beginning of exercise training period, 1 week of adaptation was conducted without weight to become familiar with the climbing ladder (1 m, 1 cm grid, 80-degree incline). Initial load of 50% of body weight was applied to every individual and added 3 g per every successive session. Next exercise trainings were started with 50%–75% of maximal weight lifted from the previous exercise.
The only encouragement was a gentle finger tapping on the animal’s tail. When the rodents reached the top of the ladder, they were allowed to rest for 1–2 min. After the rest period, additional 3 g was added on the previous weight, and the rodents were returned to the bottom of the ladder for the next session. If any mice were not able to climb with the attached load, one additional minute was given for further rest then placed at the bottom of ladder. This procedure was repeated until ten climbs were achieved. Every initial load was set at 50% of the maximal weight lifted of previous exercise training.
Grip strength test
Grip strength test was measured to illustrate the maximal force of grasping object and it is known to represent the strength of an individual. Animals were allowed to grasp a grid which is attached to the force gauge and pulled until they became completely detached from the grid. The force was recorded for three times with at least two minutes of rest between every trial of measurement. Only maximum force record was taken for the further analysis. The grip strength was measured with a grip strength meter (Model GS3; Bioseb, Chaville, France), and measurement method was adopted and modified from the one which was reported previously [28]. The grip strength was measured weekly, after 24–48 h of the last exercise trial of the week. The animal grasped the steel grid with its four-limb, then its tail was gently pulled with the experimenter’s fingers. Maximum force (g) was measured and recorded on the instrument.
Muscular endurance capacity test
Hanging time was measured to represent the muscular endurance capacity of a mouse. Animals were allowed to familiarize to the grid at least 1 min prior to the actual test. Every rodent conducted three trials and the maximum time was taken. Animal was placed on the 20 × 30 cm grid with 10 g weight attached on tail, and flipped over to measure the time until mouse falls. When the mouse fell within 10 sec, the animal was rested sufficiently and retested afterward. This was conducted 48 h after last intervention of 8th week of training.
Aerobic endurance capacity test
Treadmill exhaustion test was performed to test endurance capacity of animal. Rodents were forced to run until complete exhaustion and time was measured for further analysis. For the analysis, Exer. 3/6 treadmill (Columbus Instruments, Columbus, OH, USA) was used and no incline was applied throughout the test. Mice were stimulated at the tail or posterior part of the body when they were reluctant to run. Mice were indicated to run for 5 min with 5 m/min and thereafter speed was increased by 1 m/min every minute until exhaustion. Exhaustion was defined when mice were unable to run although mice were continuously stimulated more than 15 sec.
RNA isolation and Real Time-PCR
Total RNA from mouse tissues and organ was extracted by using an RNA purification system (Introgen) following the manufacturer’s protocol. mRNA was reverse-transcribed using AccuPower CycleScript RT PreMix (Bioneer, Daejeon, Korea) and RT-PCR was performed using SYBR Green and an ABI StepOne Real Time PCR instrument (Applied Biosystems, Cheshire, UK). Target gene expression was normalized with the control gene (Gapdh), and relative expression was quantified by the comparative Ct method ∆∆Ct. The primer used for PCR are listed in Table 1.
Table 1
Primers for Real-time PCR using SensiFAST SYBR Lo-ROX Mix protocol
![]()
Body composition analysis
Body composition was measured with Minispec live mice TD NMR analyzer (Bruker LF50, Ettlingen, Germany) [29]. This was conducted without anesthetics, and live mice were placed into cylindrical tube and inserted to scan for less than two minutes. After the scan procedure, mice were anesthetized with isoflurane gas inhalation for sample collection.
MicroCT and PetCT analysis
Bone quality was measured with in vivo NaF18-PET/CT (Positron Emission Tomography/Computed Tomography) by NanoPET/CT in vivo pre-clinical imager (Mediso, Budapest, Hungary). All procedures were conducted under supervision of the department of nuclear medicine in Seoul National University Bundang Hospital. All mice were anesthetized during scanning procedure with isoflurane gas inhalation.
Statistical analysis
Data organization and statistical analysis were performed using Microsoft Excel (Microsoft, Redmond, WA, USA) and SPSS 23.0 software (IBM Co., Armonk, NY, USA). All data were represented as mean ± SEM. Significant differences between two groups were determined using two-tailed Student’s t-test. p-values lower than 0.05 were considered they were significantly difference.
RESULTS
Effect of FGFR inhibitor on physical performance
Oral administration of the FGFR inhibitor NVP-BGJ398 (50 mg/kg/day) for 8 weeks did not induce significant differences in body weight (b.w.) between the vehicle-treated sham and inhibitor-treated (Inh) groups (Fig. 1A). Nevertheless, there was a tendency of a lower ∆b.w. in the Inh group than in the sham group (3.7 ± 0.45 g vs. 4.8 ± 0.36 g, n = 7 per group, p = 0.09, Fig. 1B). In addition, the analysis of body composition by using Minispec live mice TD NMR showed that the Inh group had lower percentages of lean body mass that those of the sham group (54.9 ± 0.94% vs. 60.0 ± 0.71%, respectively, p < 0.01, Fig. 1C) as well as reduced percentages of fat mass (7.2 ± 0.64% vs. 11.1 ± 0.94%, respectively, p < 0.01, Fig. 1D).
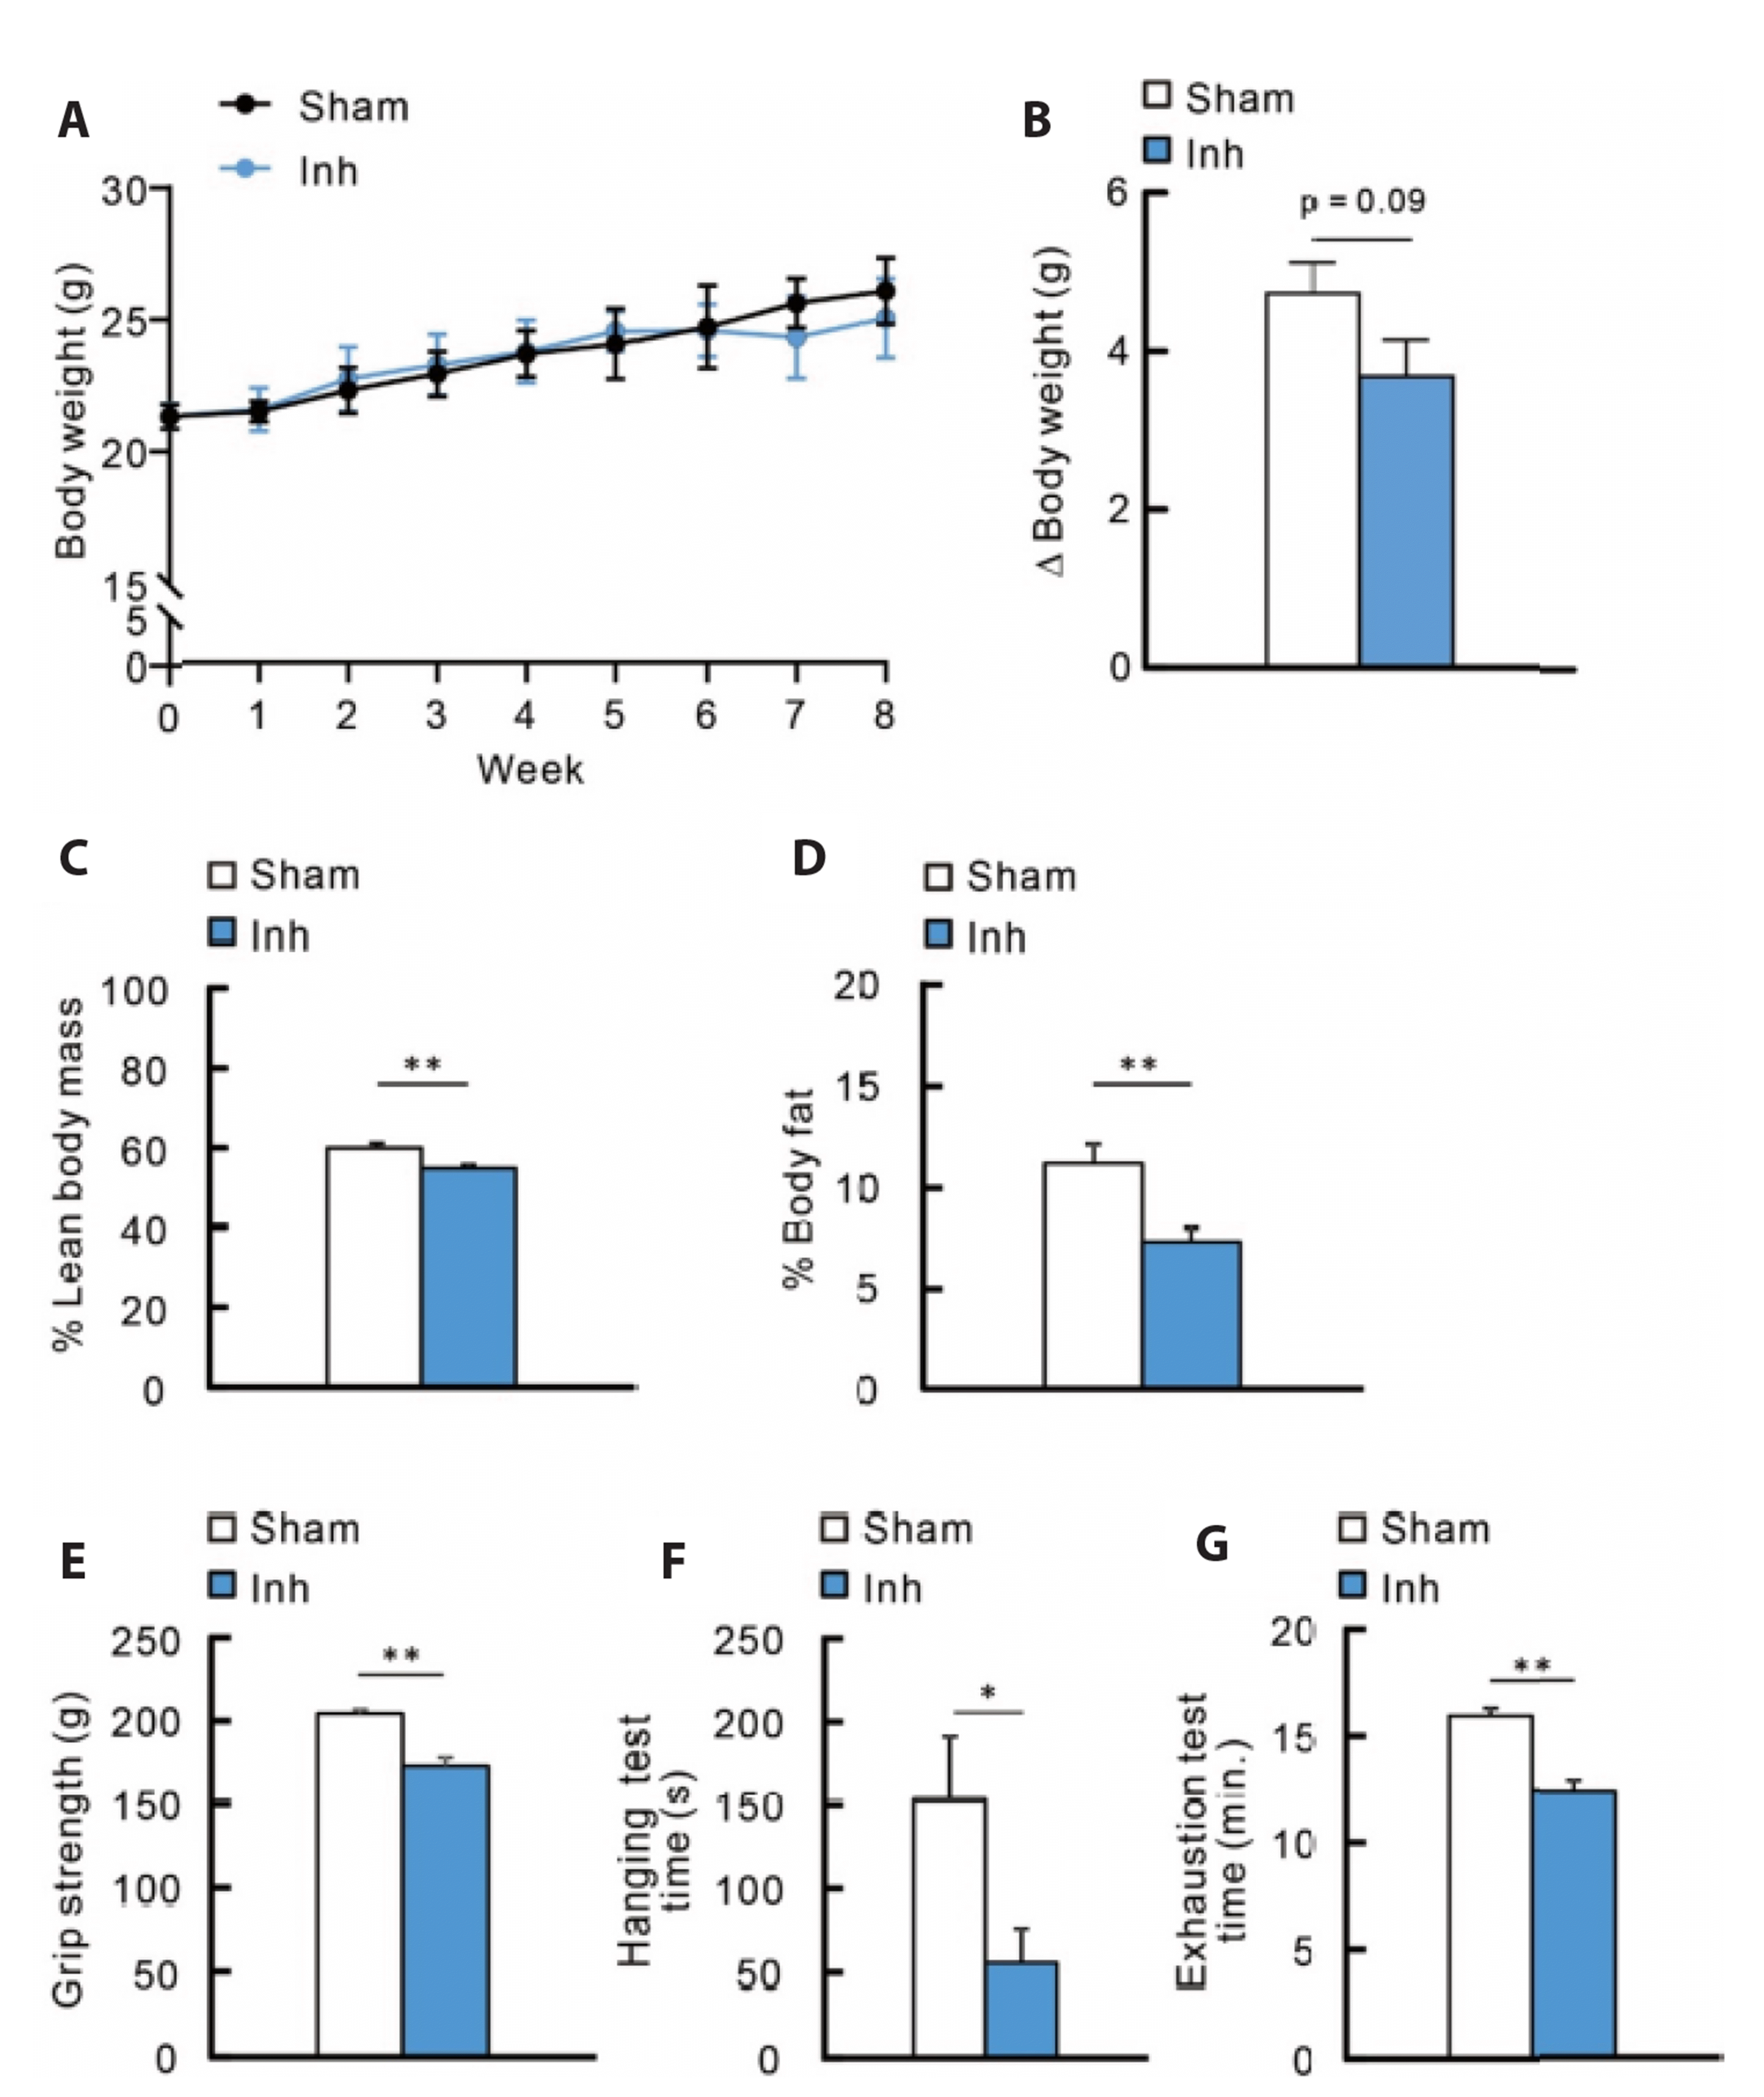
Fig. 1
Effect of FGFR inhibition on body composition and physical performance.
FGFR inhibitor treatment (NVP-BGJ398, 50 mg/kg b.w.) was administrated daily up to 8 weeks through oral gavage on Inh group (n = 7) while Sham group (n = 7) was treated with same amount of vehicle (PEG 300: glucose 5% 2:1 mix; n = 7). The b.w. were measured (A) weekly and (B) before sacrificed. Body composition analysis was taken before dissection and represented with (C) lean body mass and (D) body fat percentage of b.w. Physical performance test was conducted 48 h after intervention. General phenotype tests are such as (E) grip strength, (F) hanging and (G) treadmill exhaustion test. All values are presented as mean ± SEM. FGFR, fibroblast growth factor receptor; b.w., body weight. *p < 0.05, **p < 0.01.
![]()
To elaborate on the effects of FGFR inhibition on physical performance in the mice, we conducted grip strength, hang time, and exhaustion tests 48 h after the final treatment with either NVP-BGJ398 or vehicle control. Decreased grip strength was demonstrated in the Inh mice compared to that in the sham group (172.9 ± 5.34 g vs. 204.3 ± 2.42 g, respectively, p < 0.01, Fig. 1E). Similar decreases were observed in the hang test (55.6 ± 19.87 sec vs. 152.8 ± 38.64 sec, respectively, p < 0.05, Fig. 1F) as well as in the exhaustion test (747.9 ± 29.90 sec vs. 967.1 ± 23.42 sec, respectively, p < 0.01, Fig. 1G).
Effects of FGFR inhibitor on bone density and metabolism
Since a close relationship exists between changes in grip strength and bone density [30,31], we further examined bone density and metabolic activity to understand the decrease in physical performance during FGFR signaling inhibition. The micro/PET CT in vivo scan analysis revealed decreased bone density in the Inh group compared to that in the sham group (Fig. 2A, left), which was quantified and summarized in Hounsfield unit (HU) (861.2 ± 50.82 HU vs. 1,124.9 ± 57.94 HU, respectively, p < 0.05, Fig. 2A, right). Additionally, the Inh group exhibited and increase in bone metabolism. The standardized uptake values (SUV) from the PET/CT imaging showed that the Inh mice exhibited increased bone metabolism compared to that in the sham group (2.0 ± 0.15 g/ml vs. 1.5 ± 0.14 g/ml, respectively, p < 0.05, Fig. 2B).
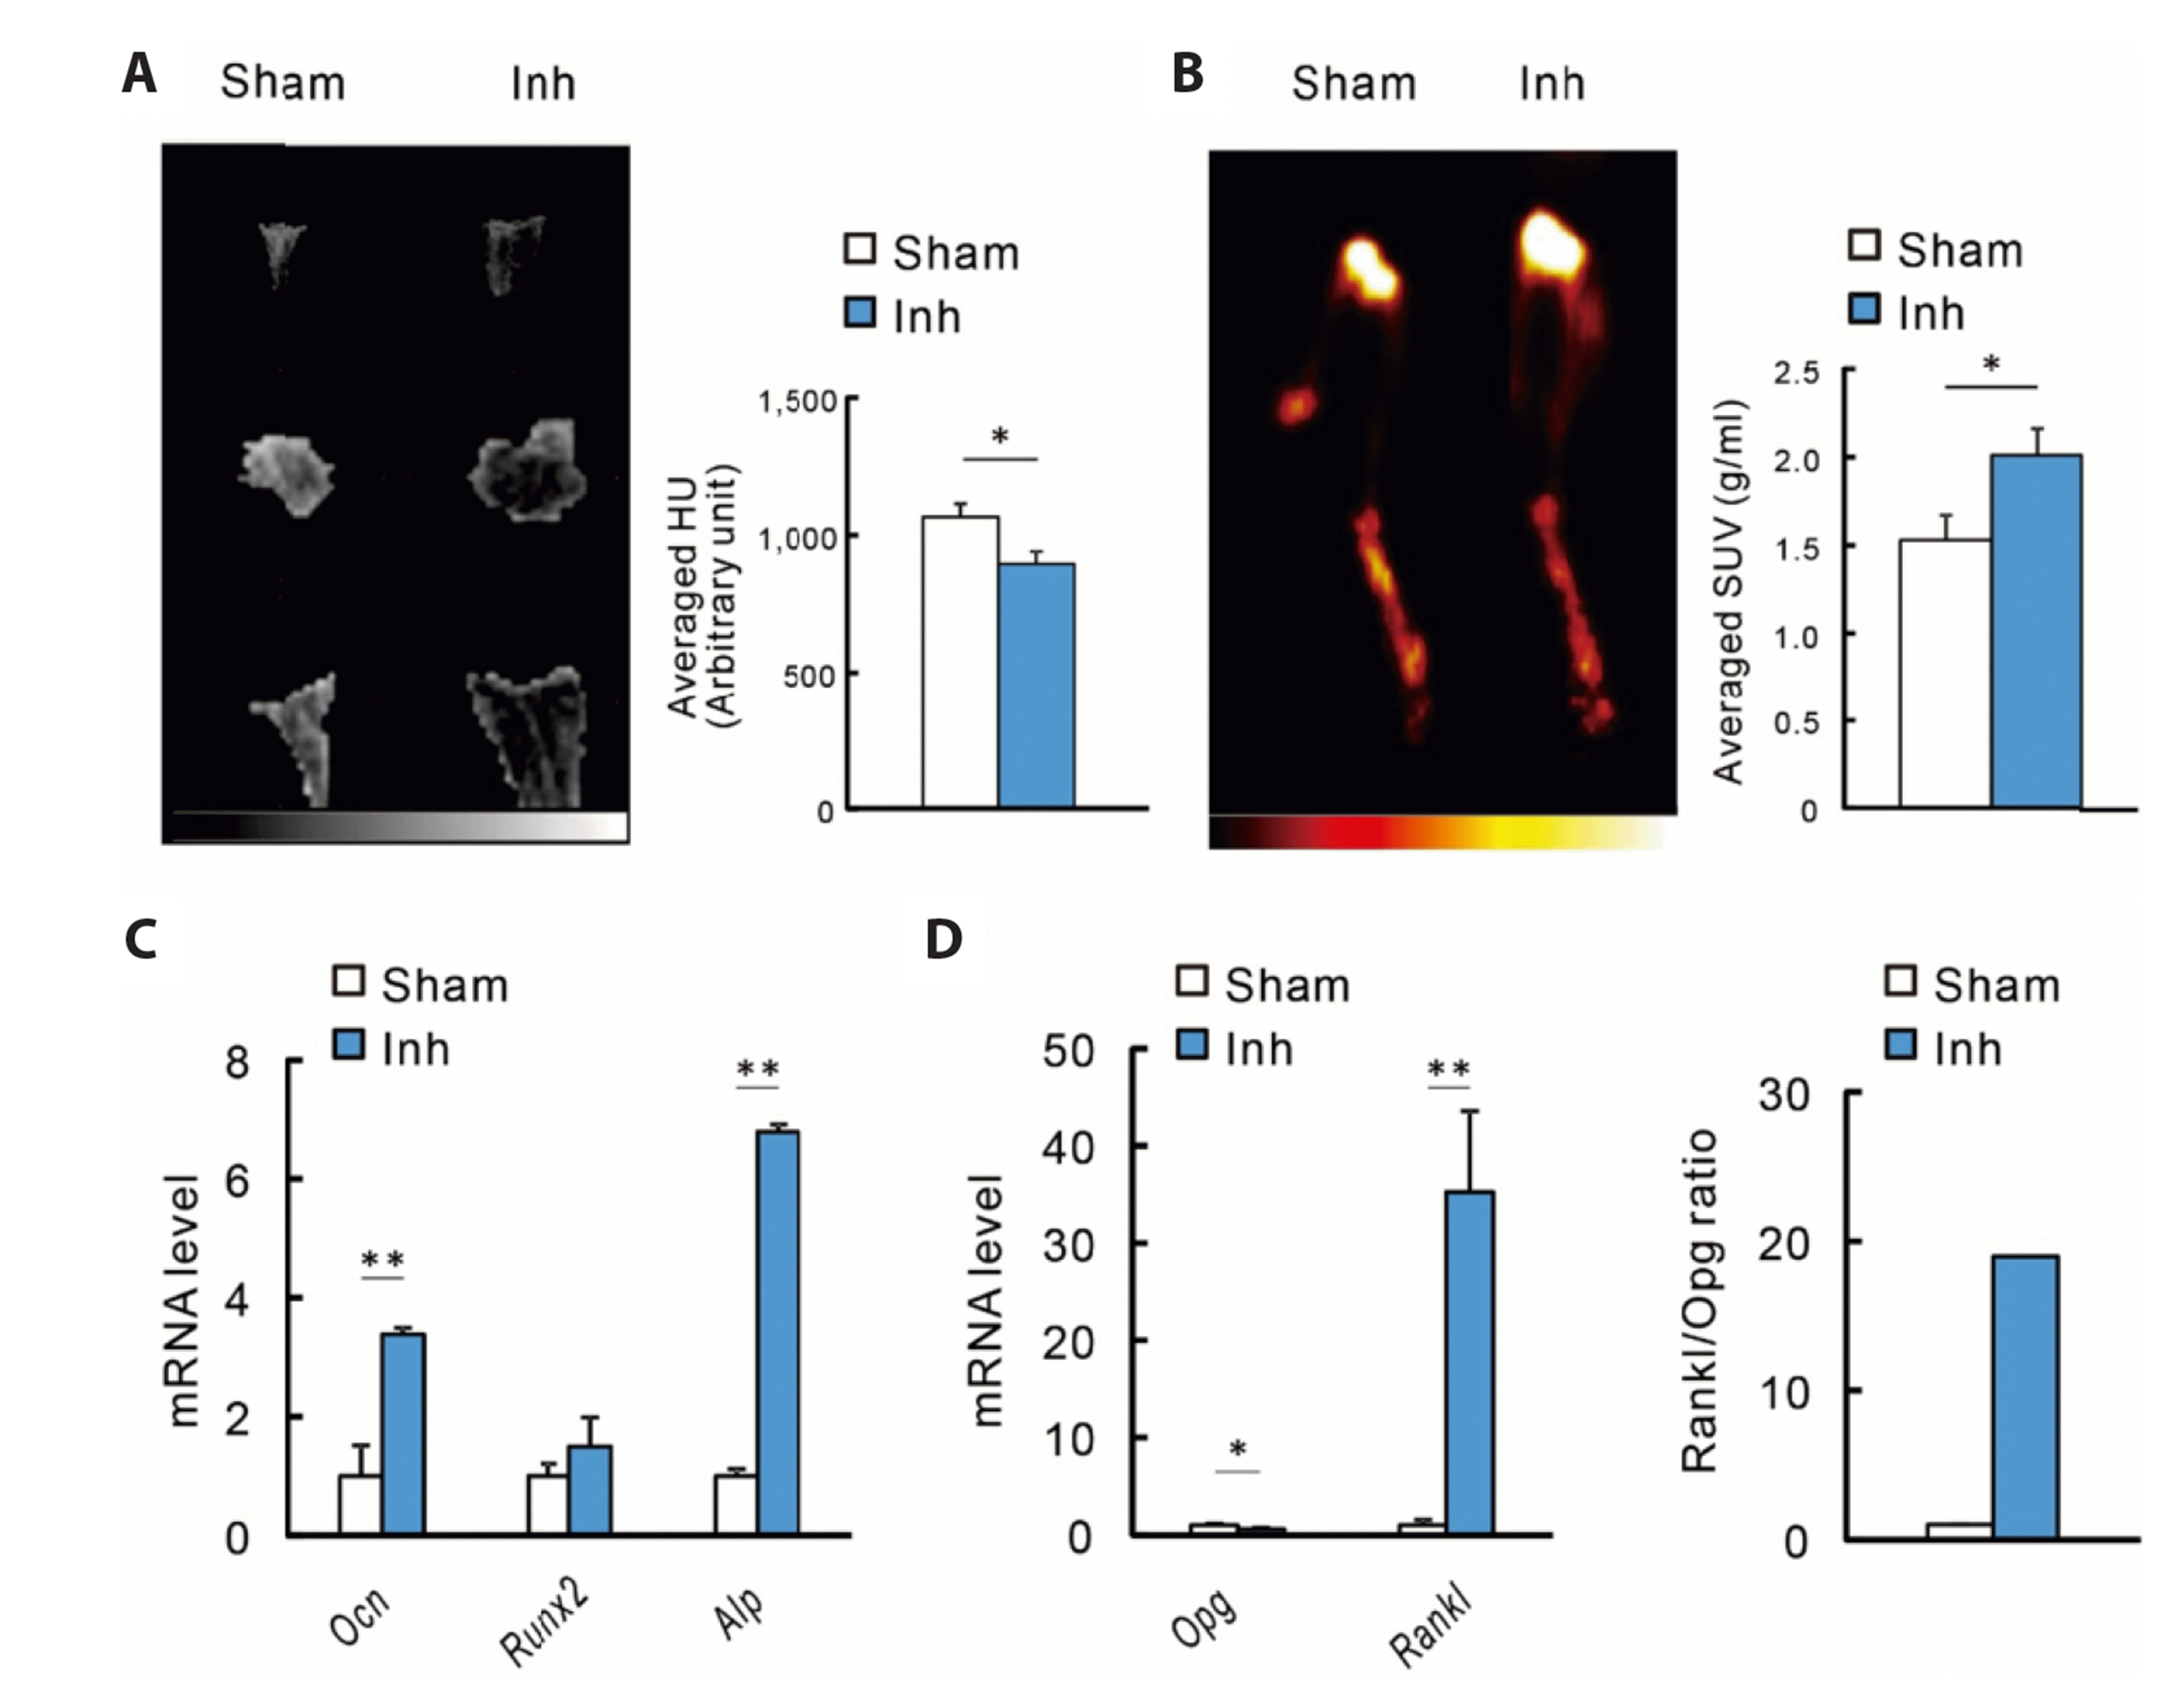
Fig. 2
Effect of FGFR inhibition on bone quality and turnover markers.
Micro/PET-CT mage scan was conducted after FGFR inhibitor (Inh) treatment. (A) Micro-CT scan image of representative animals from each group and summary statistics of averaged HU value. (B) PET-CT scan image of representative animals from each group and summary statistics of averaged SUV (g/ml). Bone turnover markers were measured with qRT-PCR. Gene expression level of (C) osteogenic genes (Osteocalcin, Runx2, and Alp) and (D) osteoclastogenic genes (Opg and Rankl) was normalized with Gapdh. All values are presented as mean ± SEM. FGFR, fibroblast growth factor receptor; PET-CT, positron emission tomography/computed tomography; HU, Hounsfield unit; SUV, standardized uptake values. *p < 0.05, **p < 0.01.
![]()
To explain the attenuated bone quality from micro-CT and NaF18-PET/CT scan data, we examined the expression of genes related to bone formation and resorption. The Osteocalcin (Ocn), and alkaline phosphatase (Alp) level increased significantly in the Inh mice compared to those in the sham group (Fig. 2C). Rankl, a well-known osteoclastogenic marker, was markedly increased, while osteoprotegerin (Opg) expression was slightly decreased in the Inh group (Fig. 2C). These changes resulted in an increased Rankl-to-Opg ratio, suggesting upregulated osteoclastic activity in the tibial bone.
Effect of FGFR Inhibitor (NVP-BGJ398) on hindlimb skeletal muscle mass and atrophy markers
Limb skeletal muscle mass is a major factor that contributes to physical performance. The weights of the soleus, gastrocnemius, tibialis anterior and extensor digitorum longus were normalized to b.w. and compared between the sham and Inh groups. However, the summarized results did not show any differences between the two groups (Fig. 3A). To assess the muscle quality, grip strength was adjusted based on the total mass of lower limb skeletal muscle. There was clear decrease in muscle quality with FGFR inhibition (Fig. 3B).
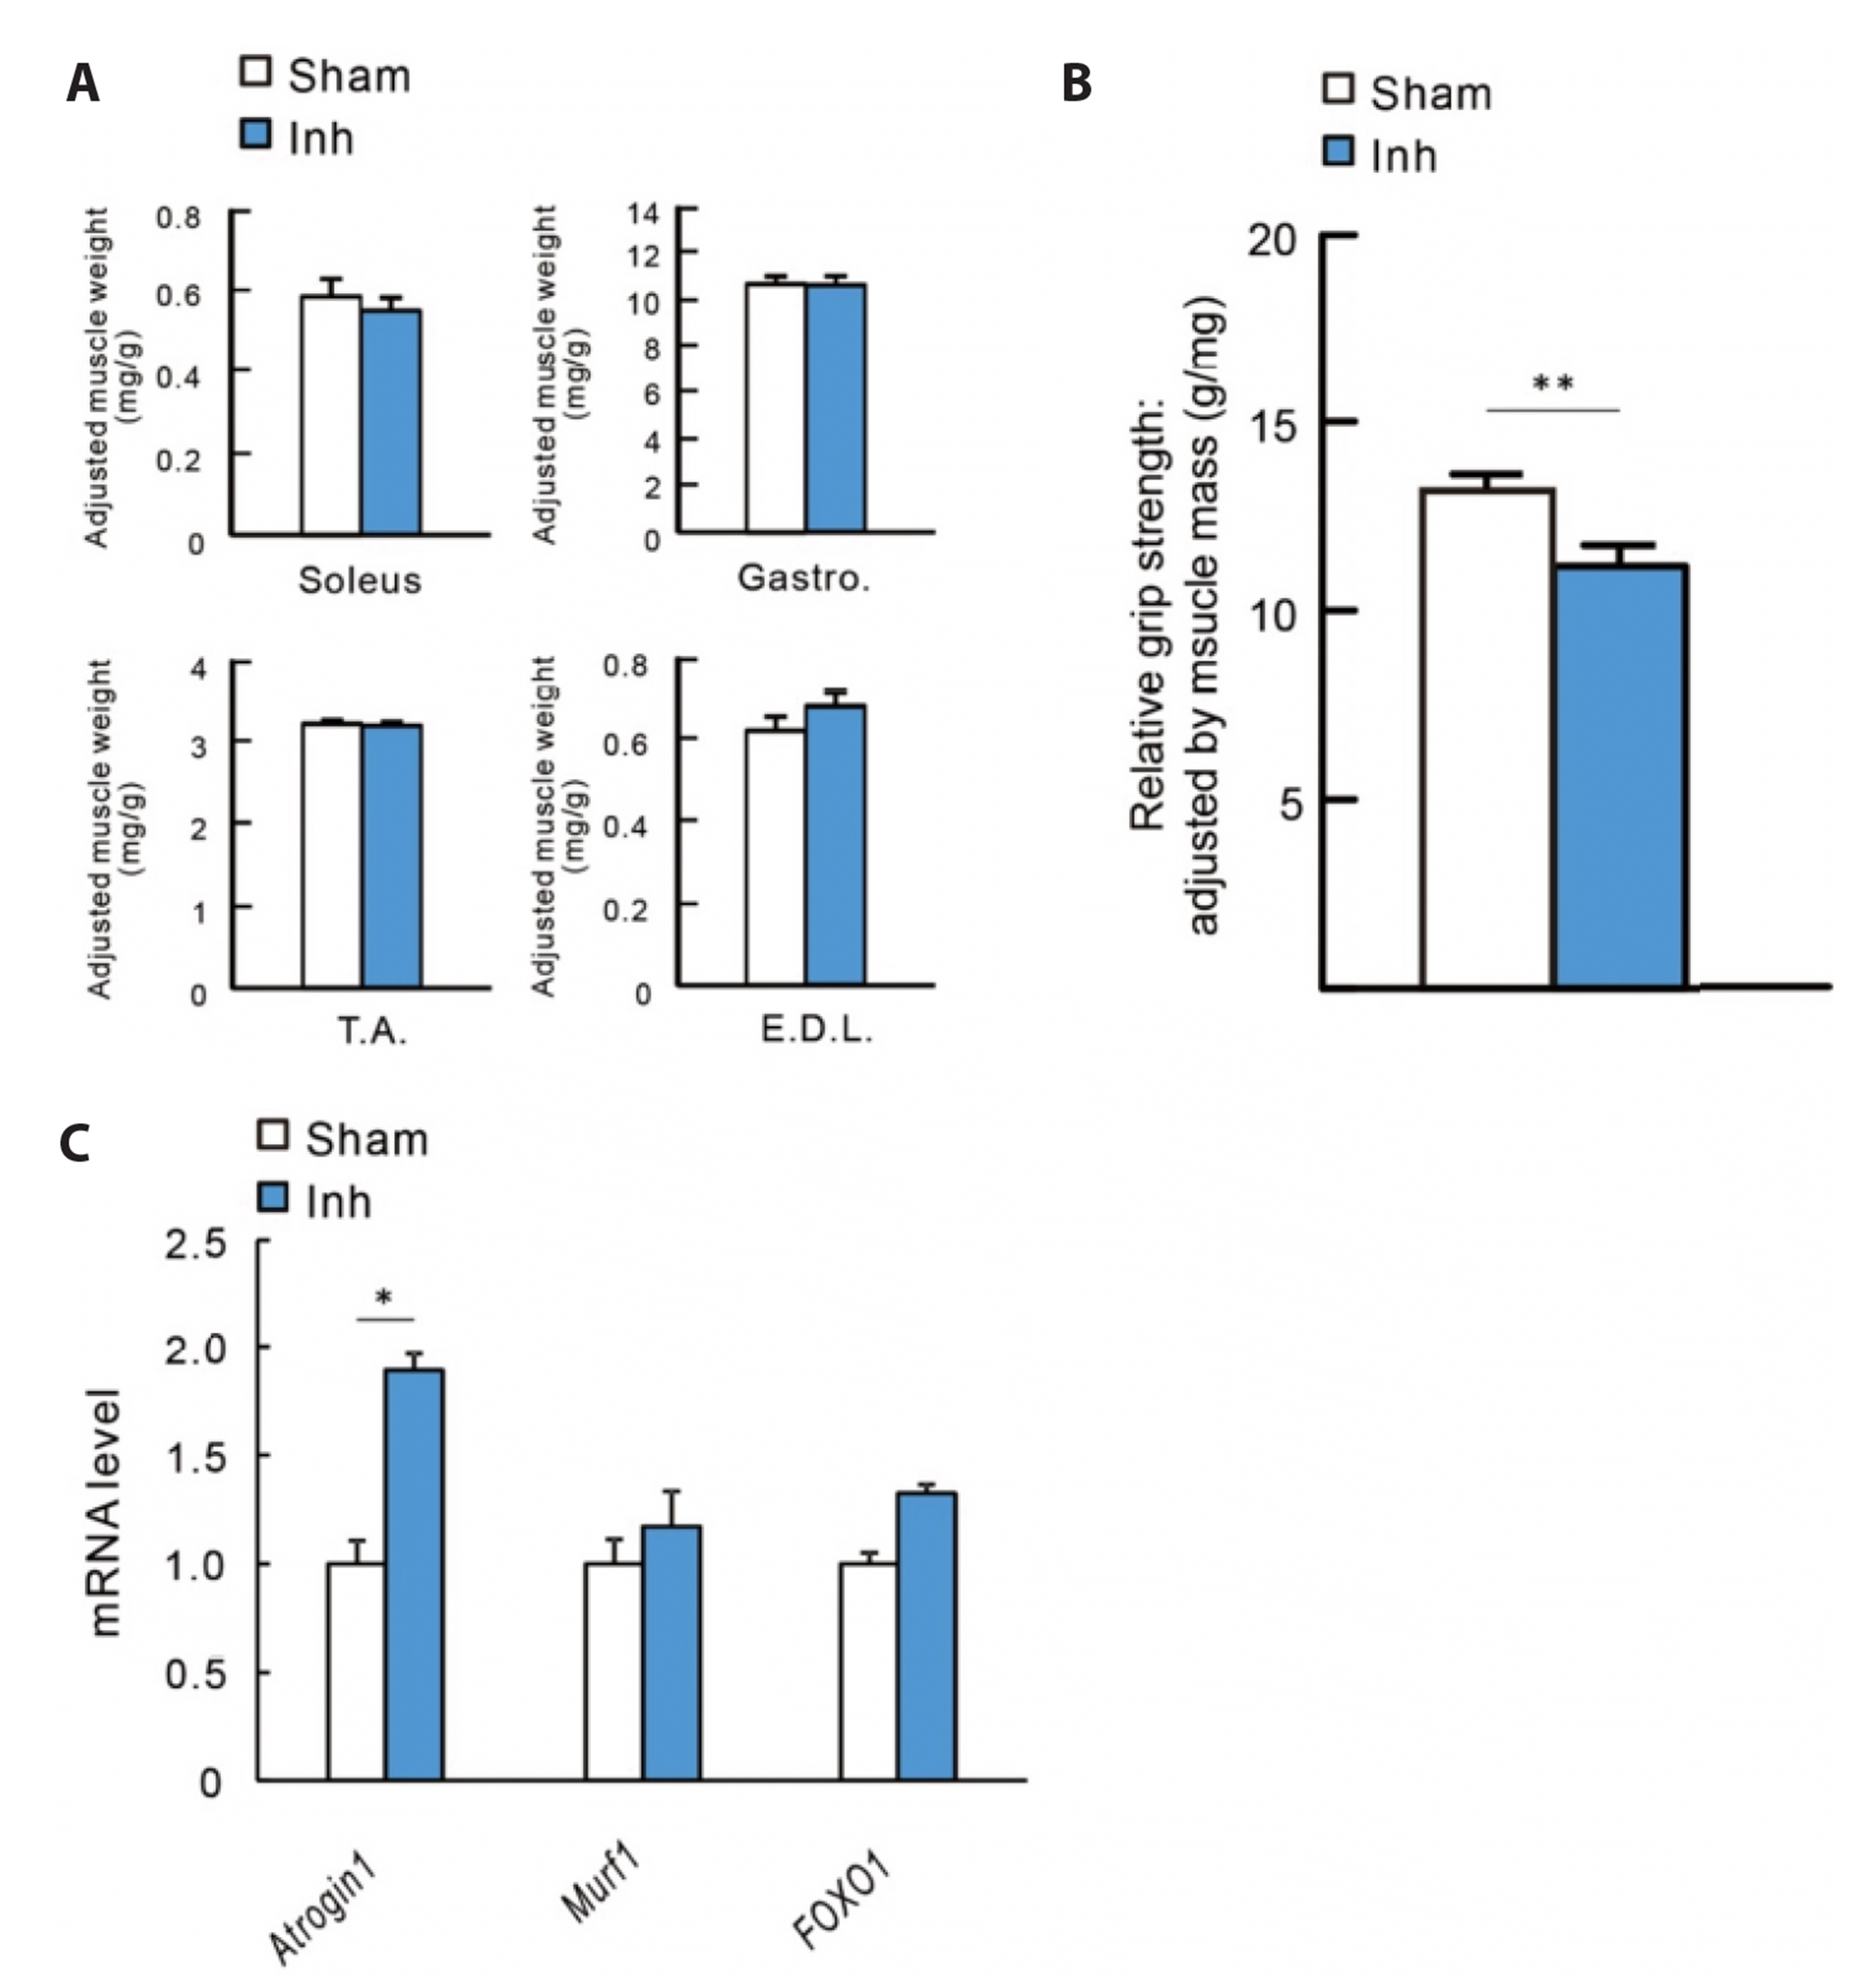
Fig. 3
Effect of FGFR inhibition on muscle quality and skeletal muscle atrophy markers.
Muscle wet weight was adjusted with body weight (A) Soleus, Gastrocnemius, Tibialis anterior and Extensor digitorum longus muscle. (B) Relative grip strength was adjusted by total lower limb muscle mass to evaluate the muscle quality. (C) mRNA expression level of gastrocnemius muscle was measured Atrophy markers were measured with qRT-PCR. Gene expression level of Atrogin1, Murf1, and Foxo1 was normalized with Gapdh. All values are presented as mean ± SEM. FGFR, fibroblast growth factor receptor. *p < 0.05, **p < 0.01.
![]()
To assess the changes in muscle quality, we analyzed muscle mRNA expression using RT-qPCR. Gene expression levels of the gastrocnemius muscle were normalized to Gapdh. Atrogin1 expression levels were elevated in the Inh group. The remaining marker genes tested did not differ between the two groups (Fig. 3C).
Effects of RET on the reduced physical performance by FGFR inhibition
As expected, RET increased grip strength, adjusted the muscle wet weight of the hind limb, and hanging time in the sham mice (Supplementary Fig. 1). We. then investigated the effects of RET on growth over 8 weeks and physical performance in the Inh mice. Growth, that is, the tendency of b.w. gain, did not show any significant differences between the RET-combined sham and Inh groups. However, the body composition analysis revealed that the extent of decreased lean body mass and body fat percentages were attenuated with RET intervention; there was no significant difference in the two parameters between the two groups (Fig. 4C, D).
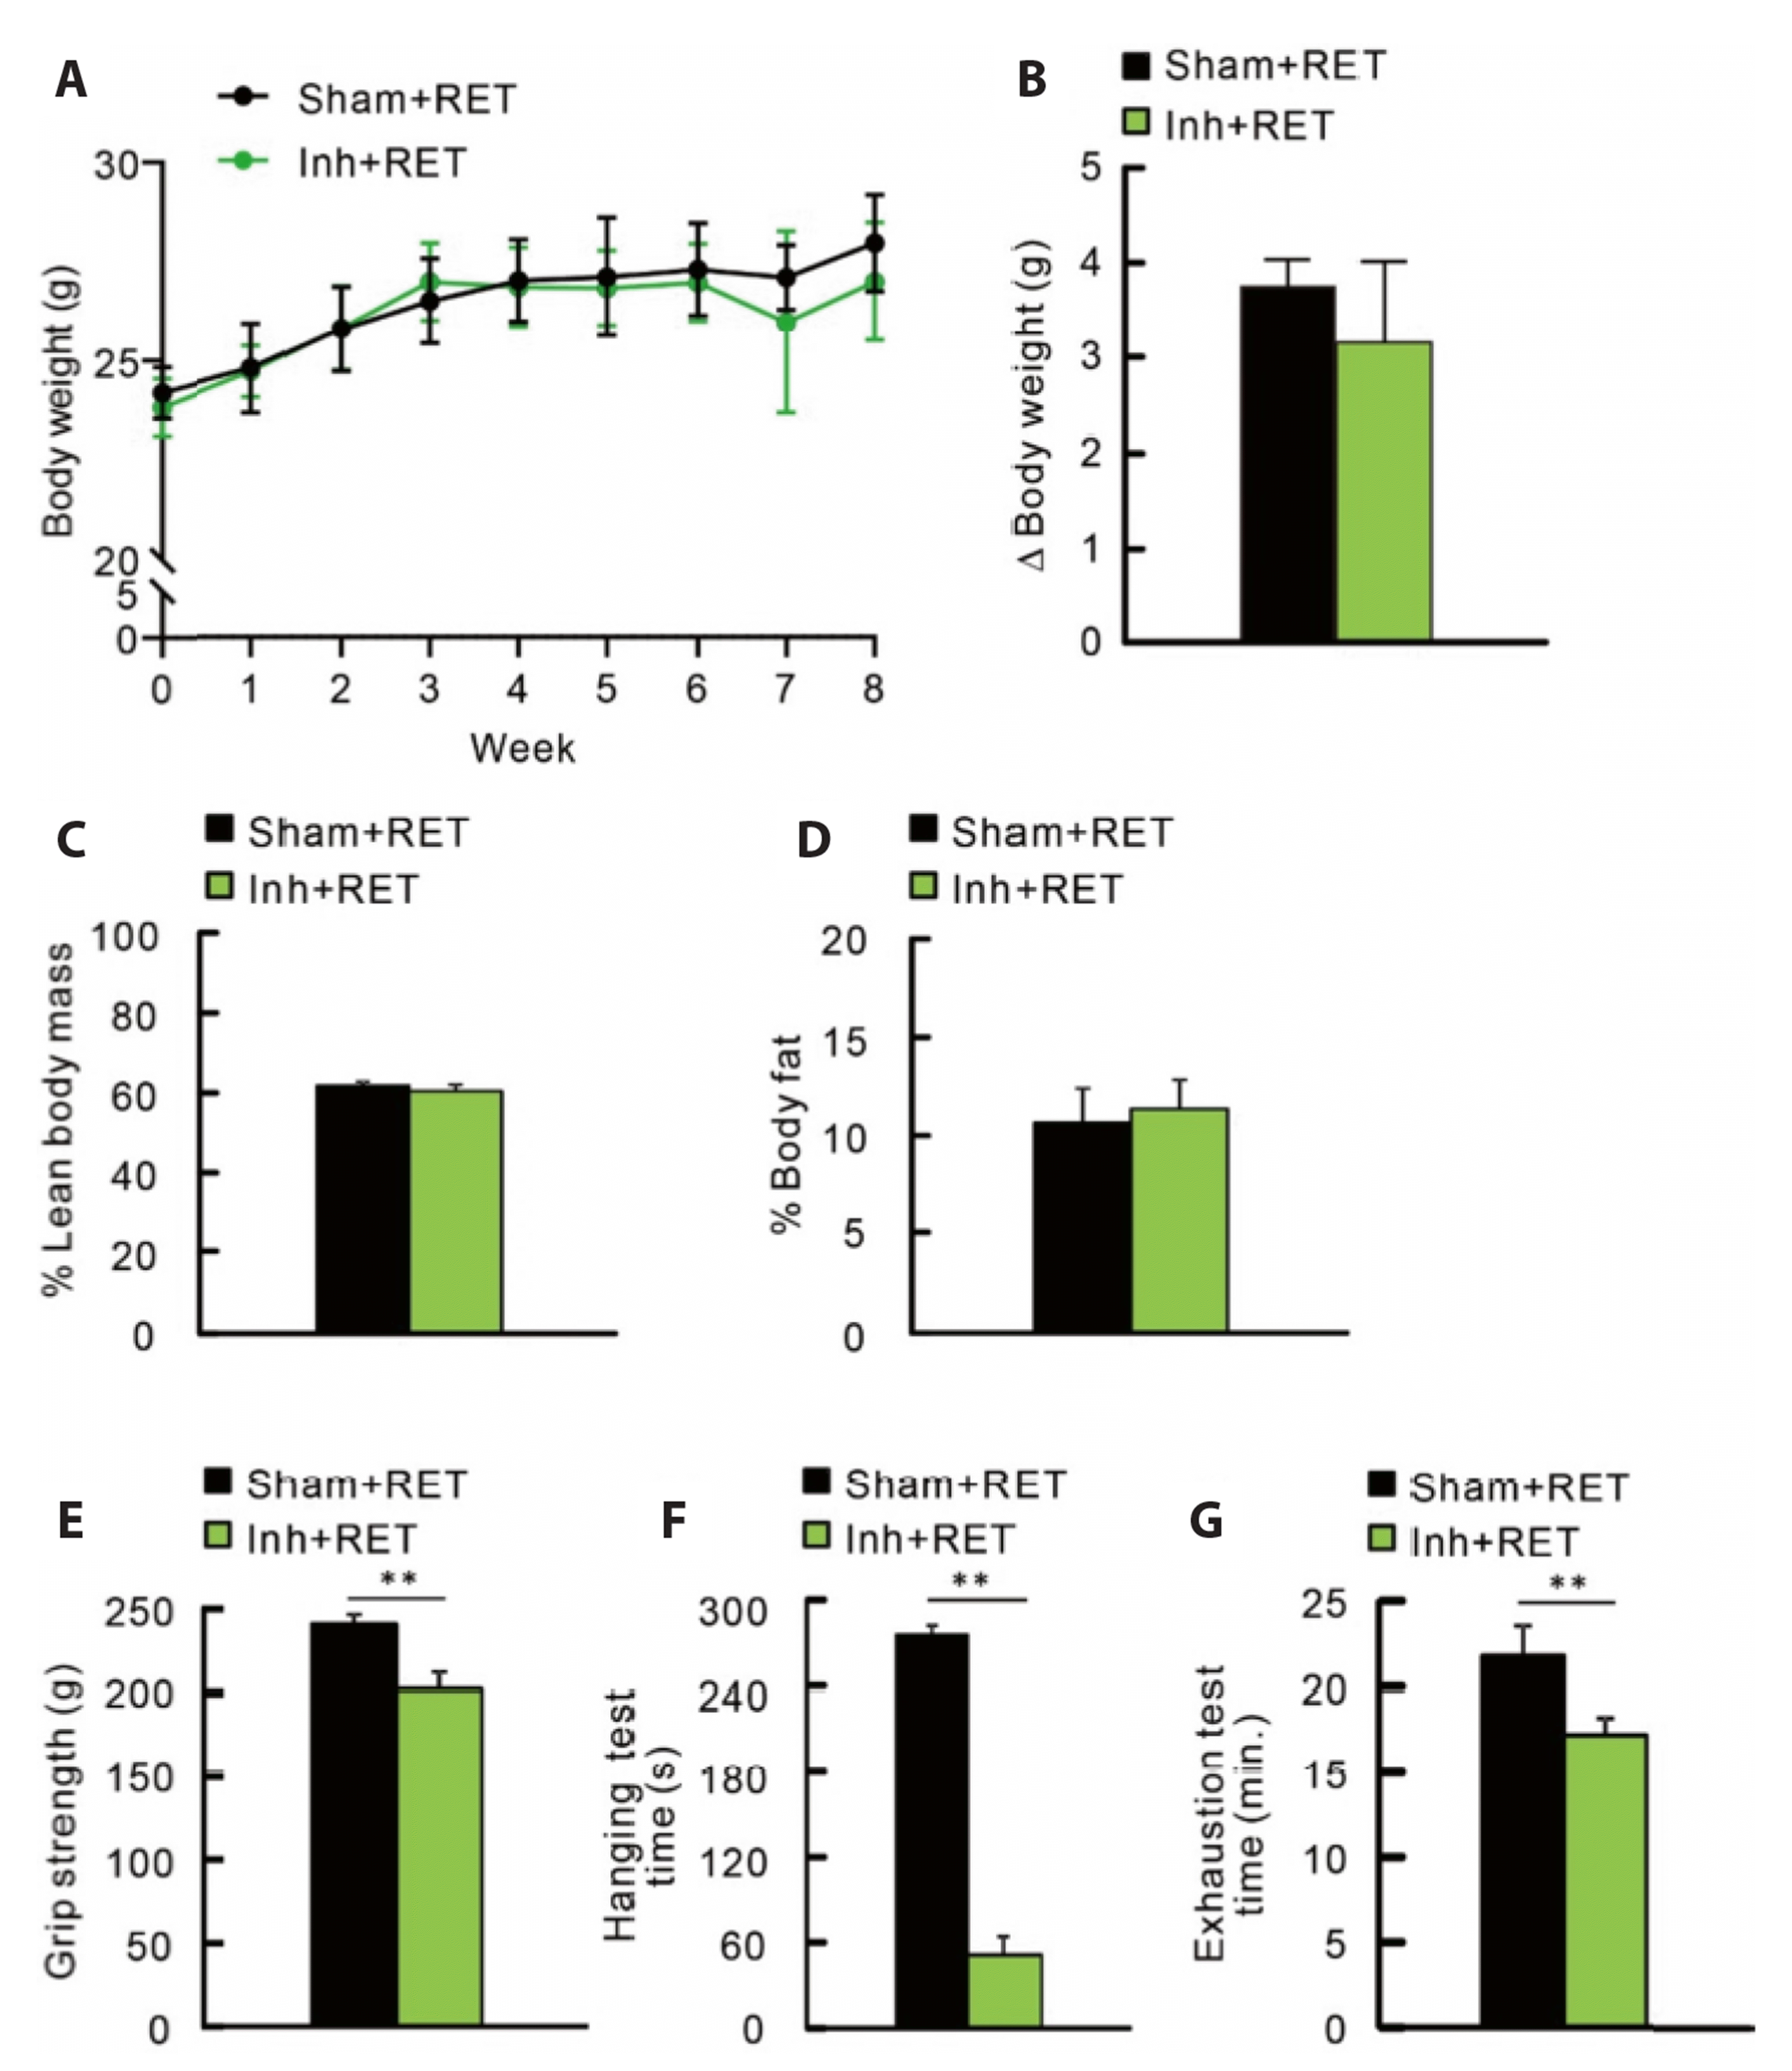
Fig. 4
Effect of RET during FGFR inhibition.
Physical performance was tested after 8 weeks of ladder climbing exercise with FGFR inhibitor treatment: Sham-RET (PEG 300: glucose 5% 2:1 mix; n = 7) vs. Inh-RET (NVP-BGJ398, 50 mg/kg b.w.; n = 7). Body weight was measured (A) weekly and (B) before sacrificed. Body composition analysis was taken before dissection and represented with (C) lean body mass and (D) body fat percentage of b.w. Physical performance test was conducted 48 h after intervention. General phenotype tests are such as (E) grip strength, (F) hanging and (G) treadmill exhaustion test. All values are presented as mean ± SEM. RET, resistance exercise training; FGFR, fibroblast growth factor receptor; b.w., body weight. **p < 0.01.
![]()
Contrary to the beneficial effect of RET on the physical performance of normal mice, the lower performance in the Inh group could not recover to the level of the sham group after 8 weeks of RET (Fig. 4E–G).
RET ameliorated increased bone resorption by FGFR inhibition
To investigate the effects of RET on reduced bone quality by FGFR inhibition, micro-CT and NaF18-PET/CT scan analyses were conducted 48 h after the final intervention. Eight weeks of RET failed to restore the decreased bone mineral density (Fig. 5A), however, the bone turnover rate was rescued, as the averaged SUV did not differ between the sham and Inh groups combined with RET (sham + RET and Inh + RET, respectively, Fig. 5B). We further examined changes in gene expression related to bone formation and resorption. Consistent with the findings from the comparable bone metabolism between the sham + RET and Inh + RET groups (Fig. 5B), there was no difference in gene expression levels of Ocn and Alp between these two groups (Fig. 5C). Furthermore, the osteoclastogenic makers Opg and Rankl showed similar expression between Sham + RET and Inh + RET mice (Fig. 5D).
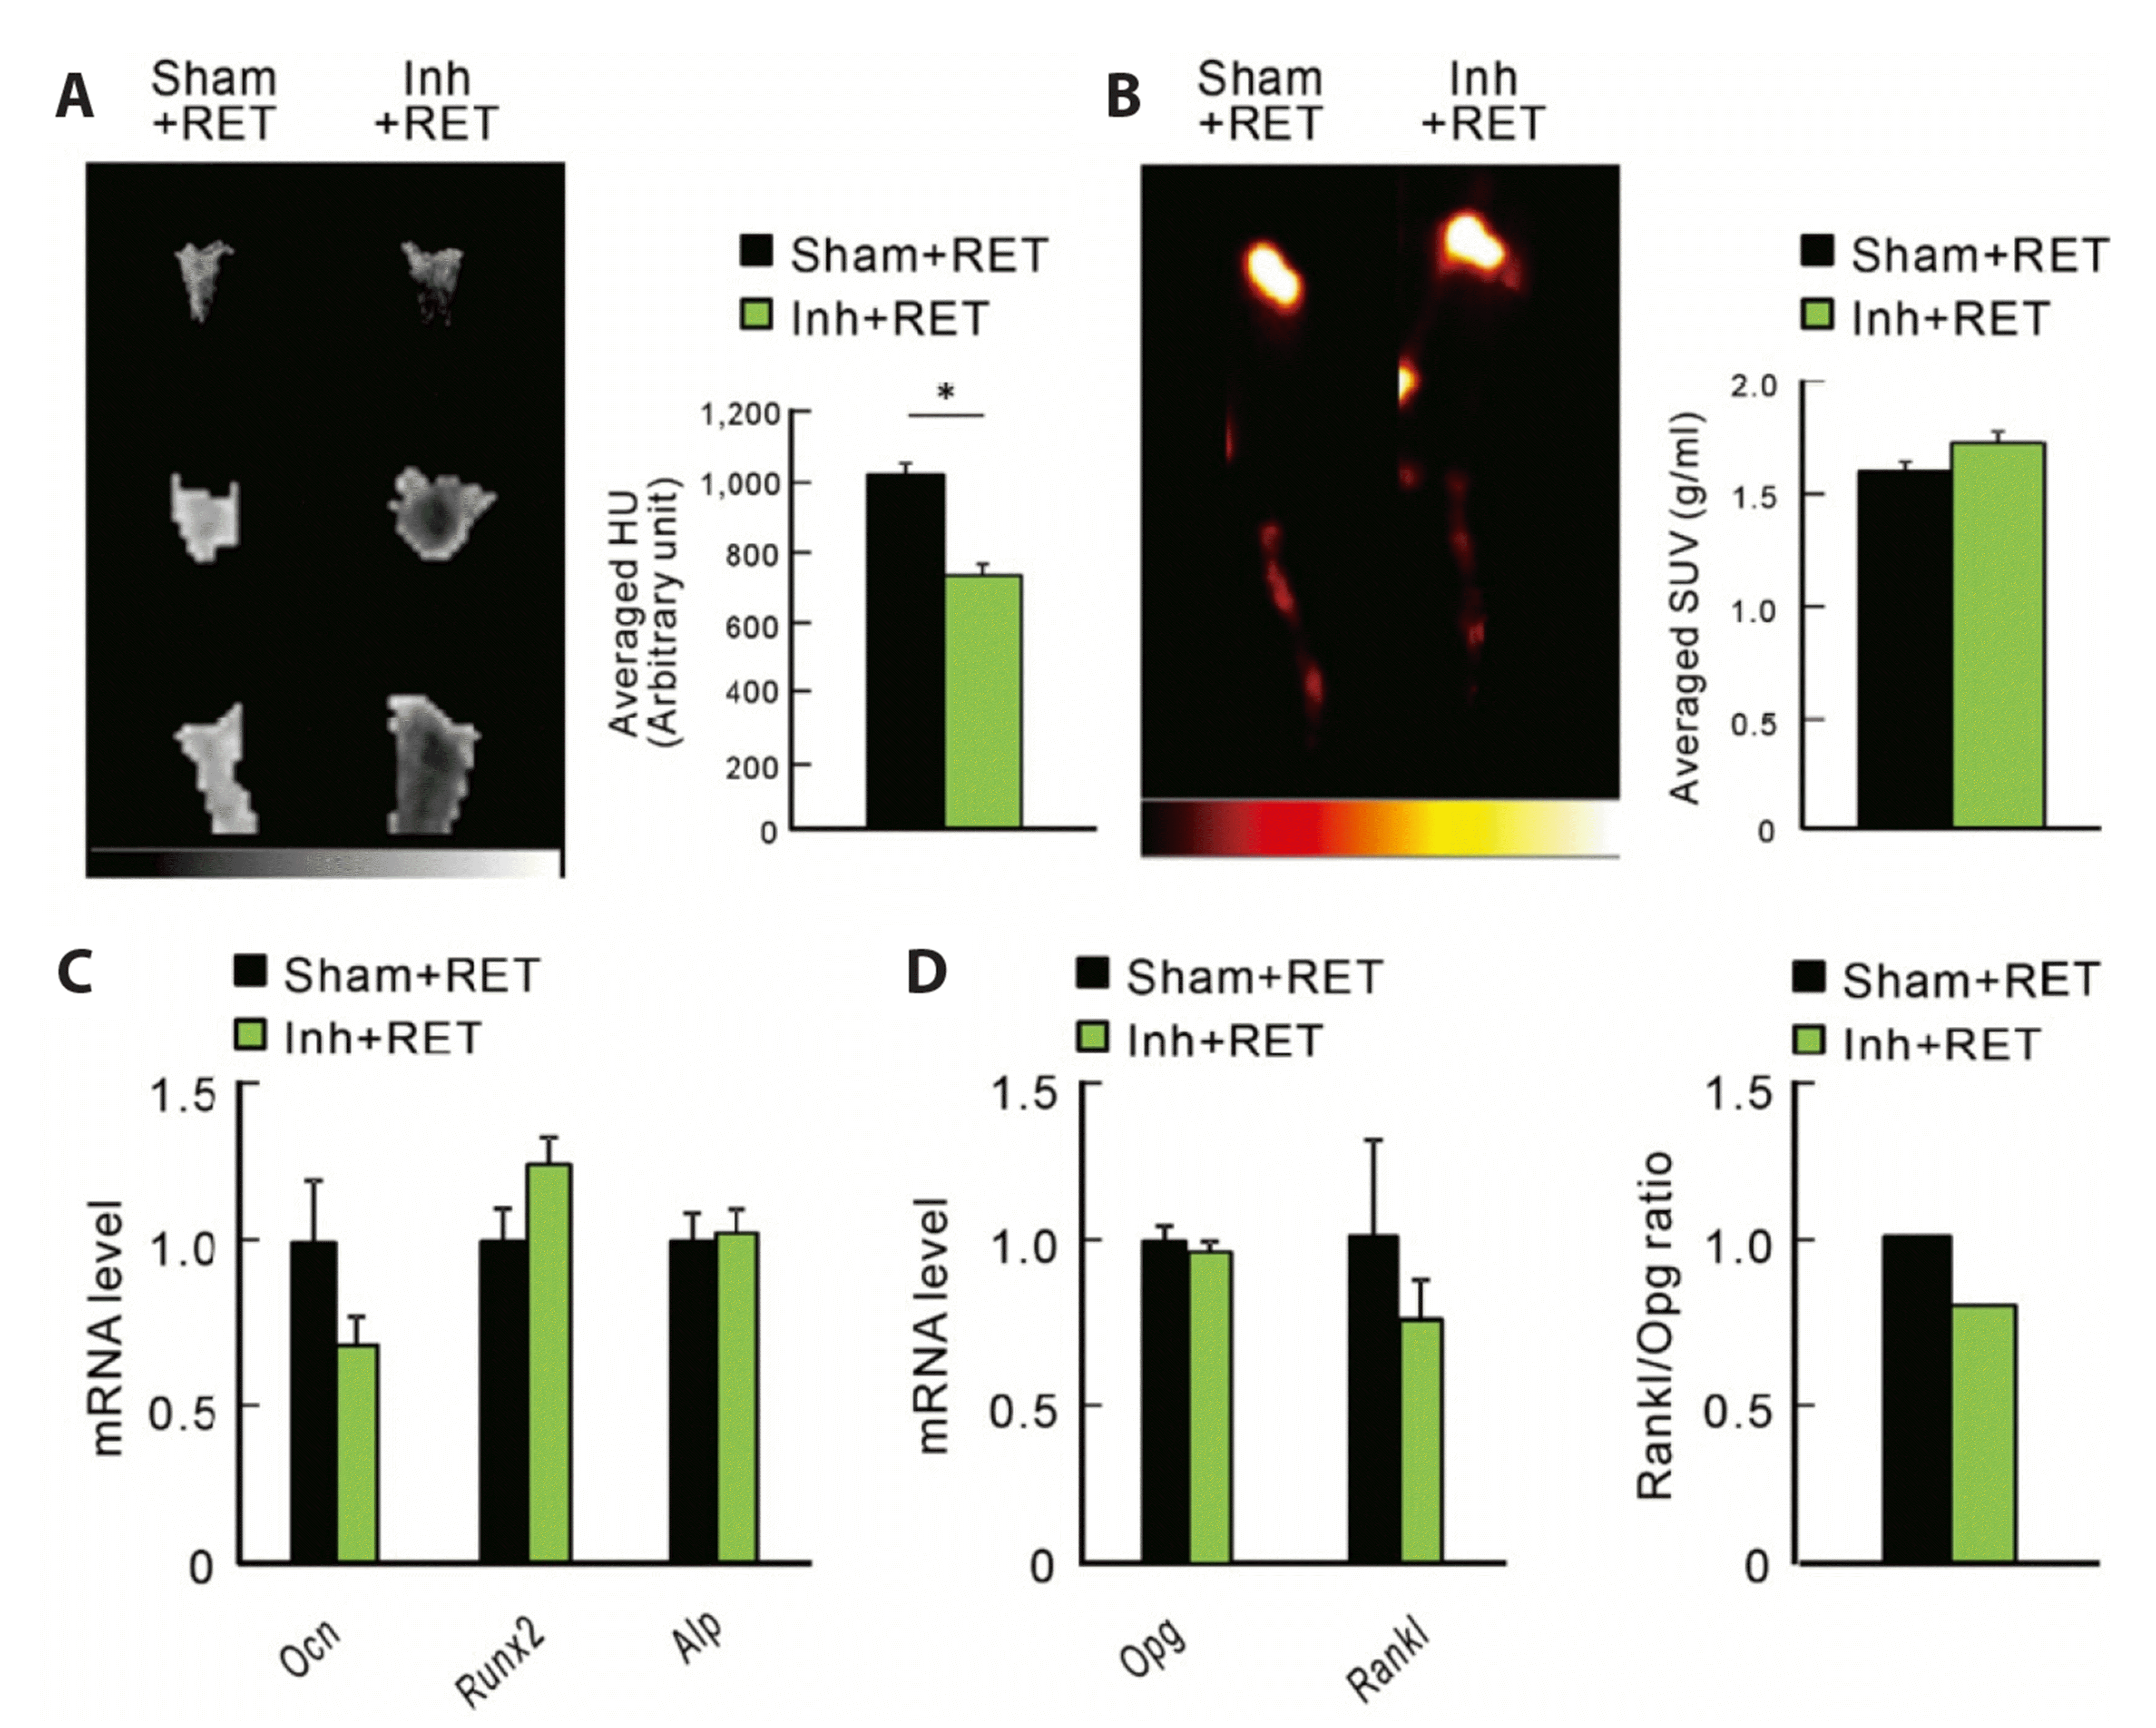
Fig. 5
Effect of resistance exercise training during FGFR inhibition on bone quality and turnover markers.
Micro/PET-CT mage scan was done after 8 weeks of ladder climbing exercise with FGFR inhibitor treatment. (A) Micro-CT scan image of representative animals from each group and summary statistics of averaged HU value. (B) PET-CT scan image of representative animals from each group and summary statistics of averaged SUV (g/ml). Bone turnover markers were measured with qRT-PCR. Gene expression level of (C) osteogenic genes (Osteocalcin, Runx2, and Alp) and (D) osteoclastogenic genes (Opg and Rankl) was normalized with GAPDH. All values are presented as mean ± SEM. FGFR, fibroblast growth factor receptor; RET, resistance exercise training; PET-CT, positron emission tomography/computed tomography; HU, Hounsfield unit; SUV, standardized uptake values. *p < 0.05.
![]()
RET attenuated atrophy markers but failed to recover muscle quality
Similar to the findings of FGFR inhibition during normal growth, FGFR inhibition did not alter the changes in the lower limb skeletal muscle groups (Fig. 6A). Although the mRNA levels of atrophy markers were similar between the sham + RET and Inh + RET groups (Fig. 6C), this did not result in an improvement in muscle quality (Fig. 6B).
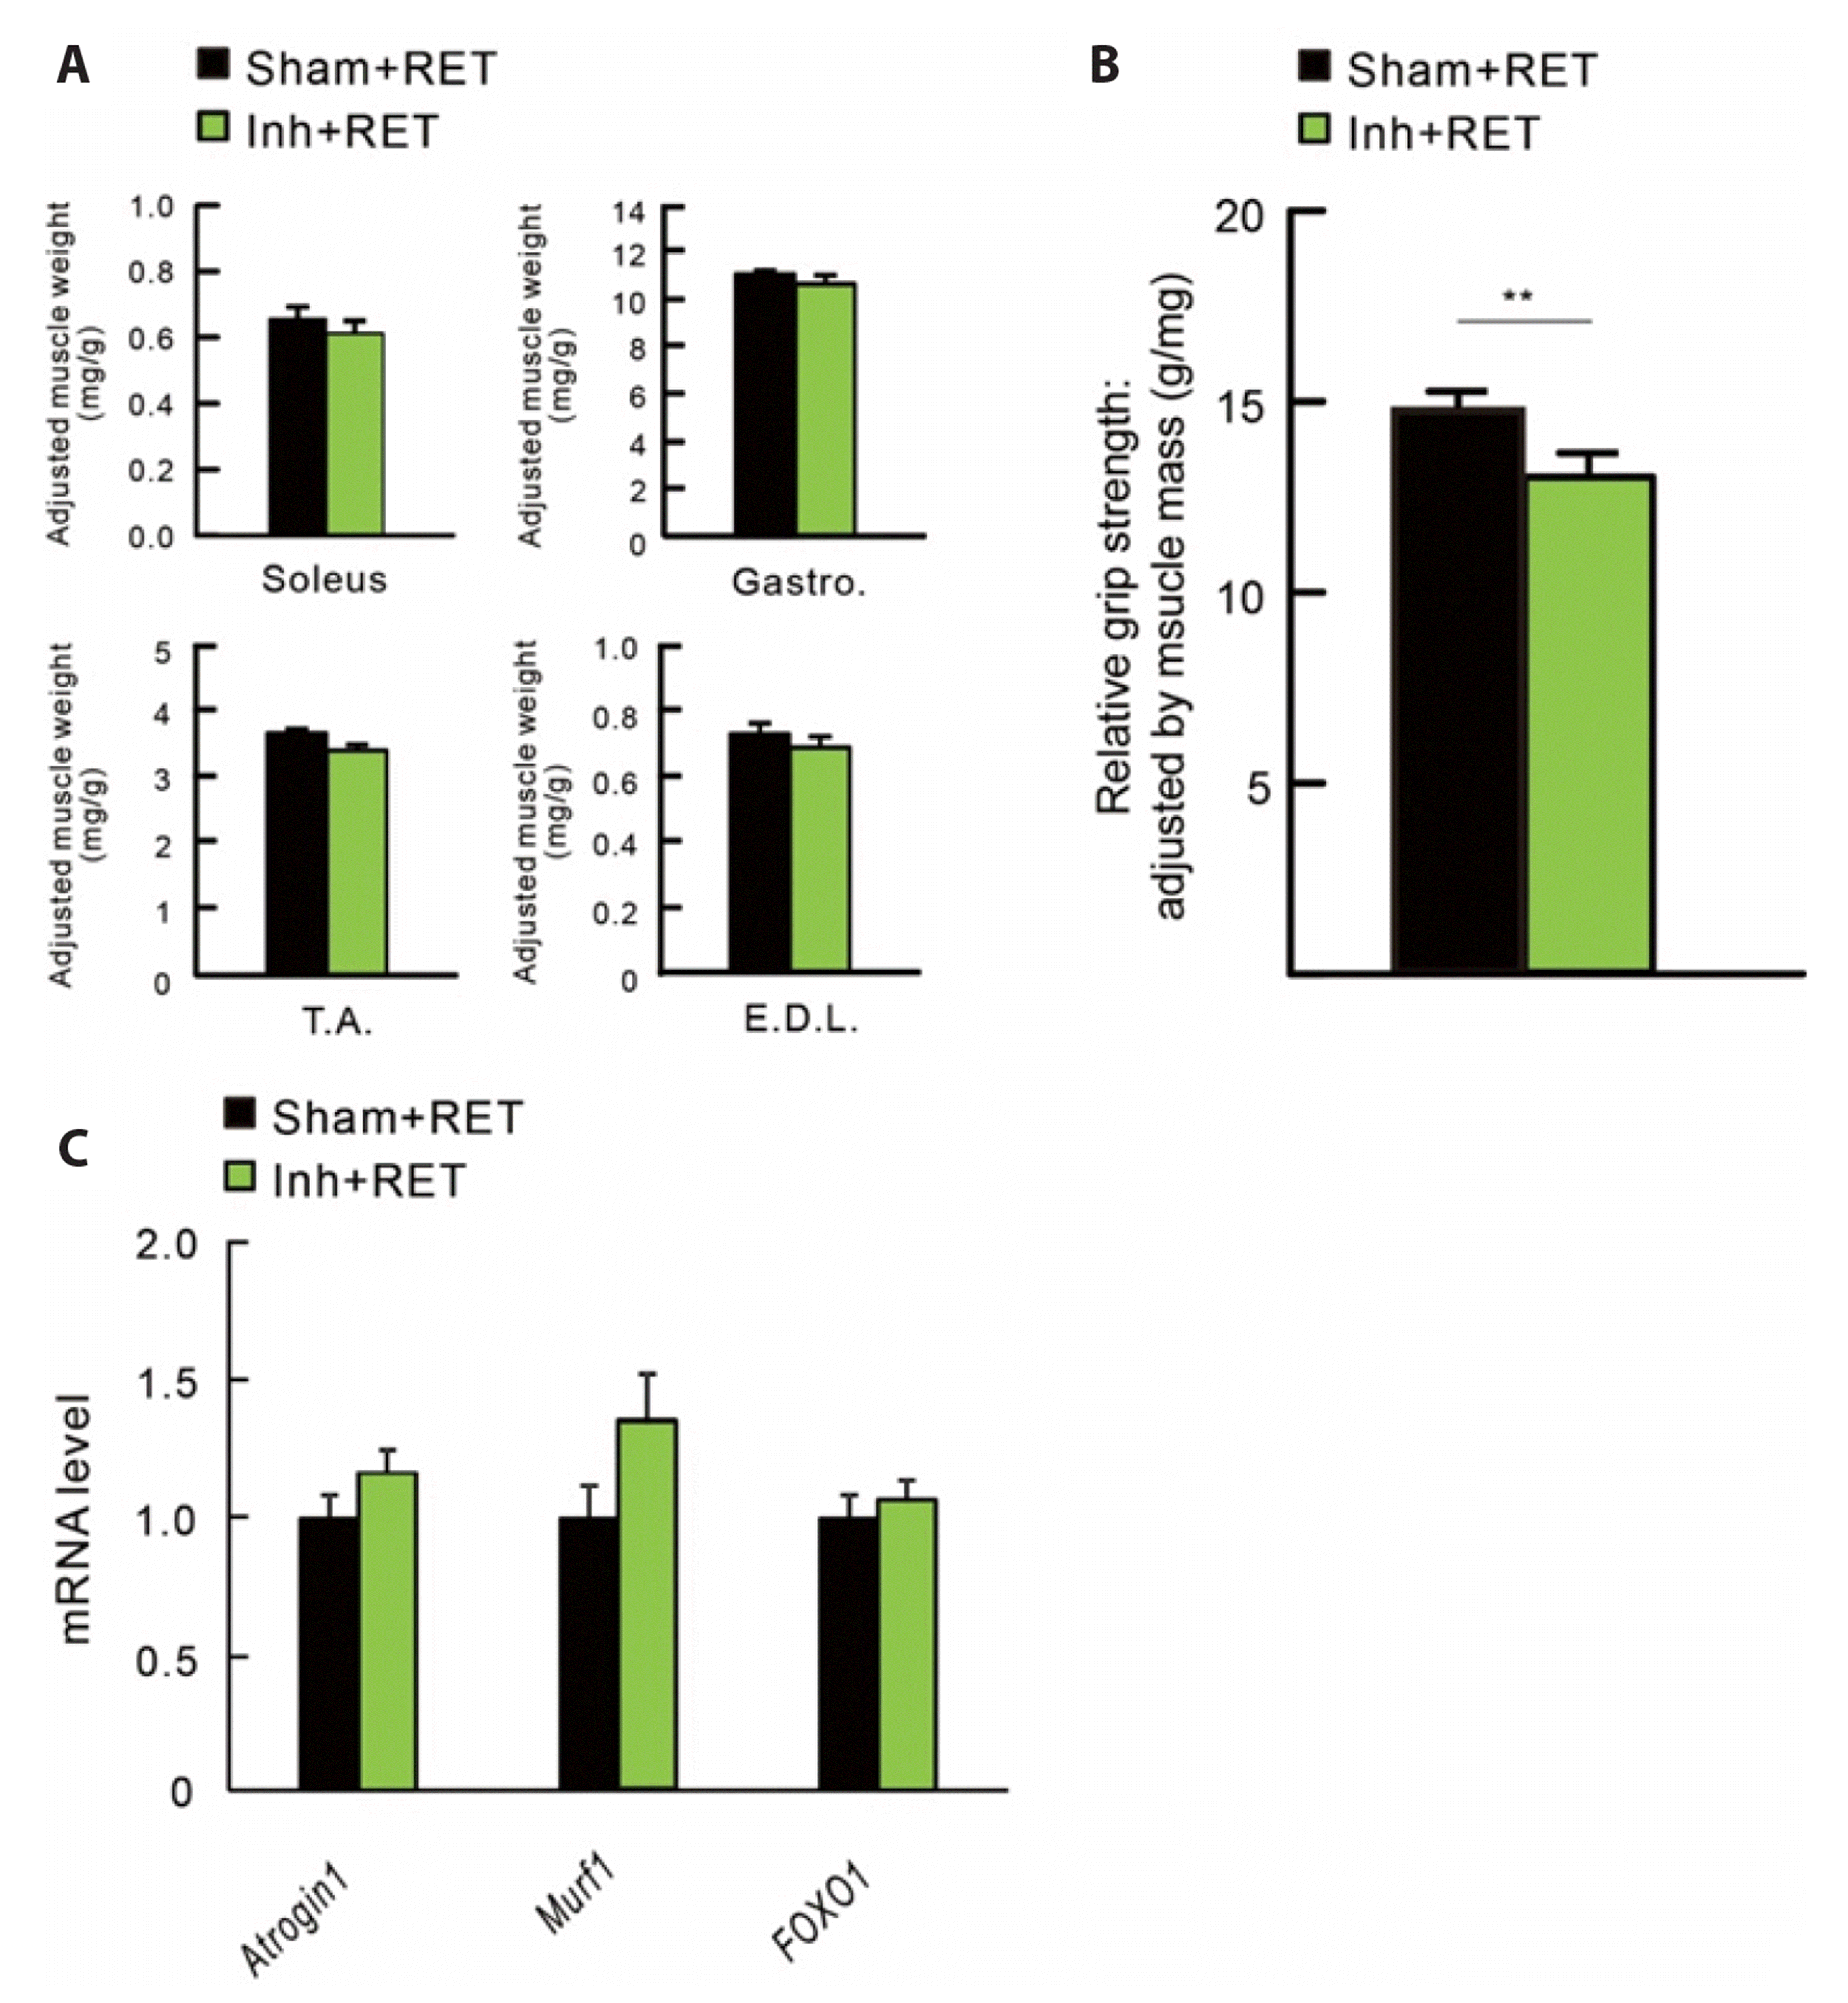
Fig. 6
Effect of resistance exercise training during FGFR inhibition on muscle quality and skeletal muscle atrophy markers.
Muscle wet weight adjusted with body weight (A) Soleus, Gastrocnemius, Tibialis anterior and Extensor digitorum longus muscle. (B) Relative grip strength was adjusted by total lower limb muscle mass to evaluate the muscle quality. (C) mRNA expression level of gastrocnemius muscle was measured Atrophy markers were measured with quantitative RT-PCR. Gene expression level of Atrogin1, Murf1, and Foxo1 was normalized with Gapdh. All values are presented as mean ± SEM. FGFR, fibroblast growth factor receptor; RET, resistance exercise training.**p < 0.01.
![]()
DISCUSSION
Our findings with the FGFR inhibitor NVP-BGJ398 in mice were characterized by reduced muscle strength and bone quality, while the mass of limb muscle was not affected. Decreased bone density is accompanied by reduced bone metabolism and decreased expression of osteogenic/osteoclastogenic genes. When the osteogenic process is increased, the gene expression ratio Rank:Opg in the tibia bone [32] represents the osteoclastogenic activity. Eight weeks of RET combined with NVP-BGJ398 (Inh + RET) failed to recover muscle strength and bone density in the mice, whereas no differences were observed in the bone metabolism rate and relevant genetic expression compared to sham + RET mice (Fig. 7).
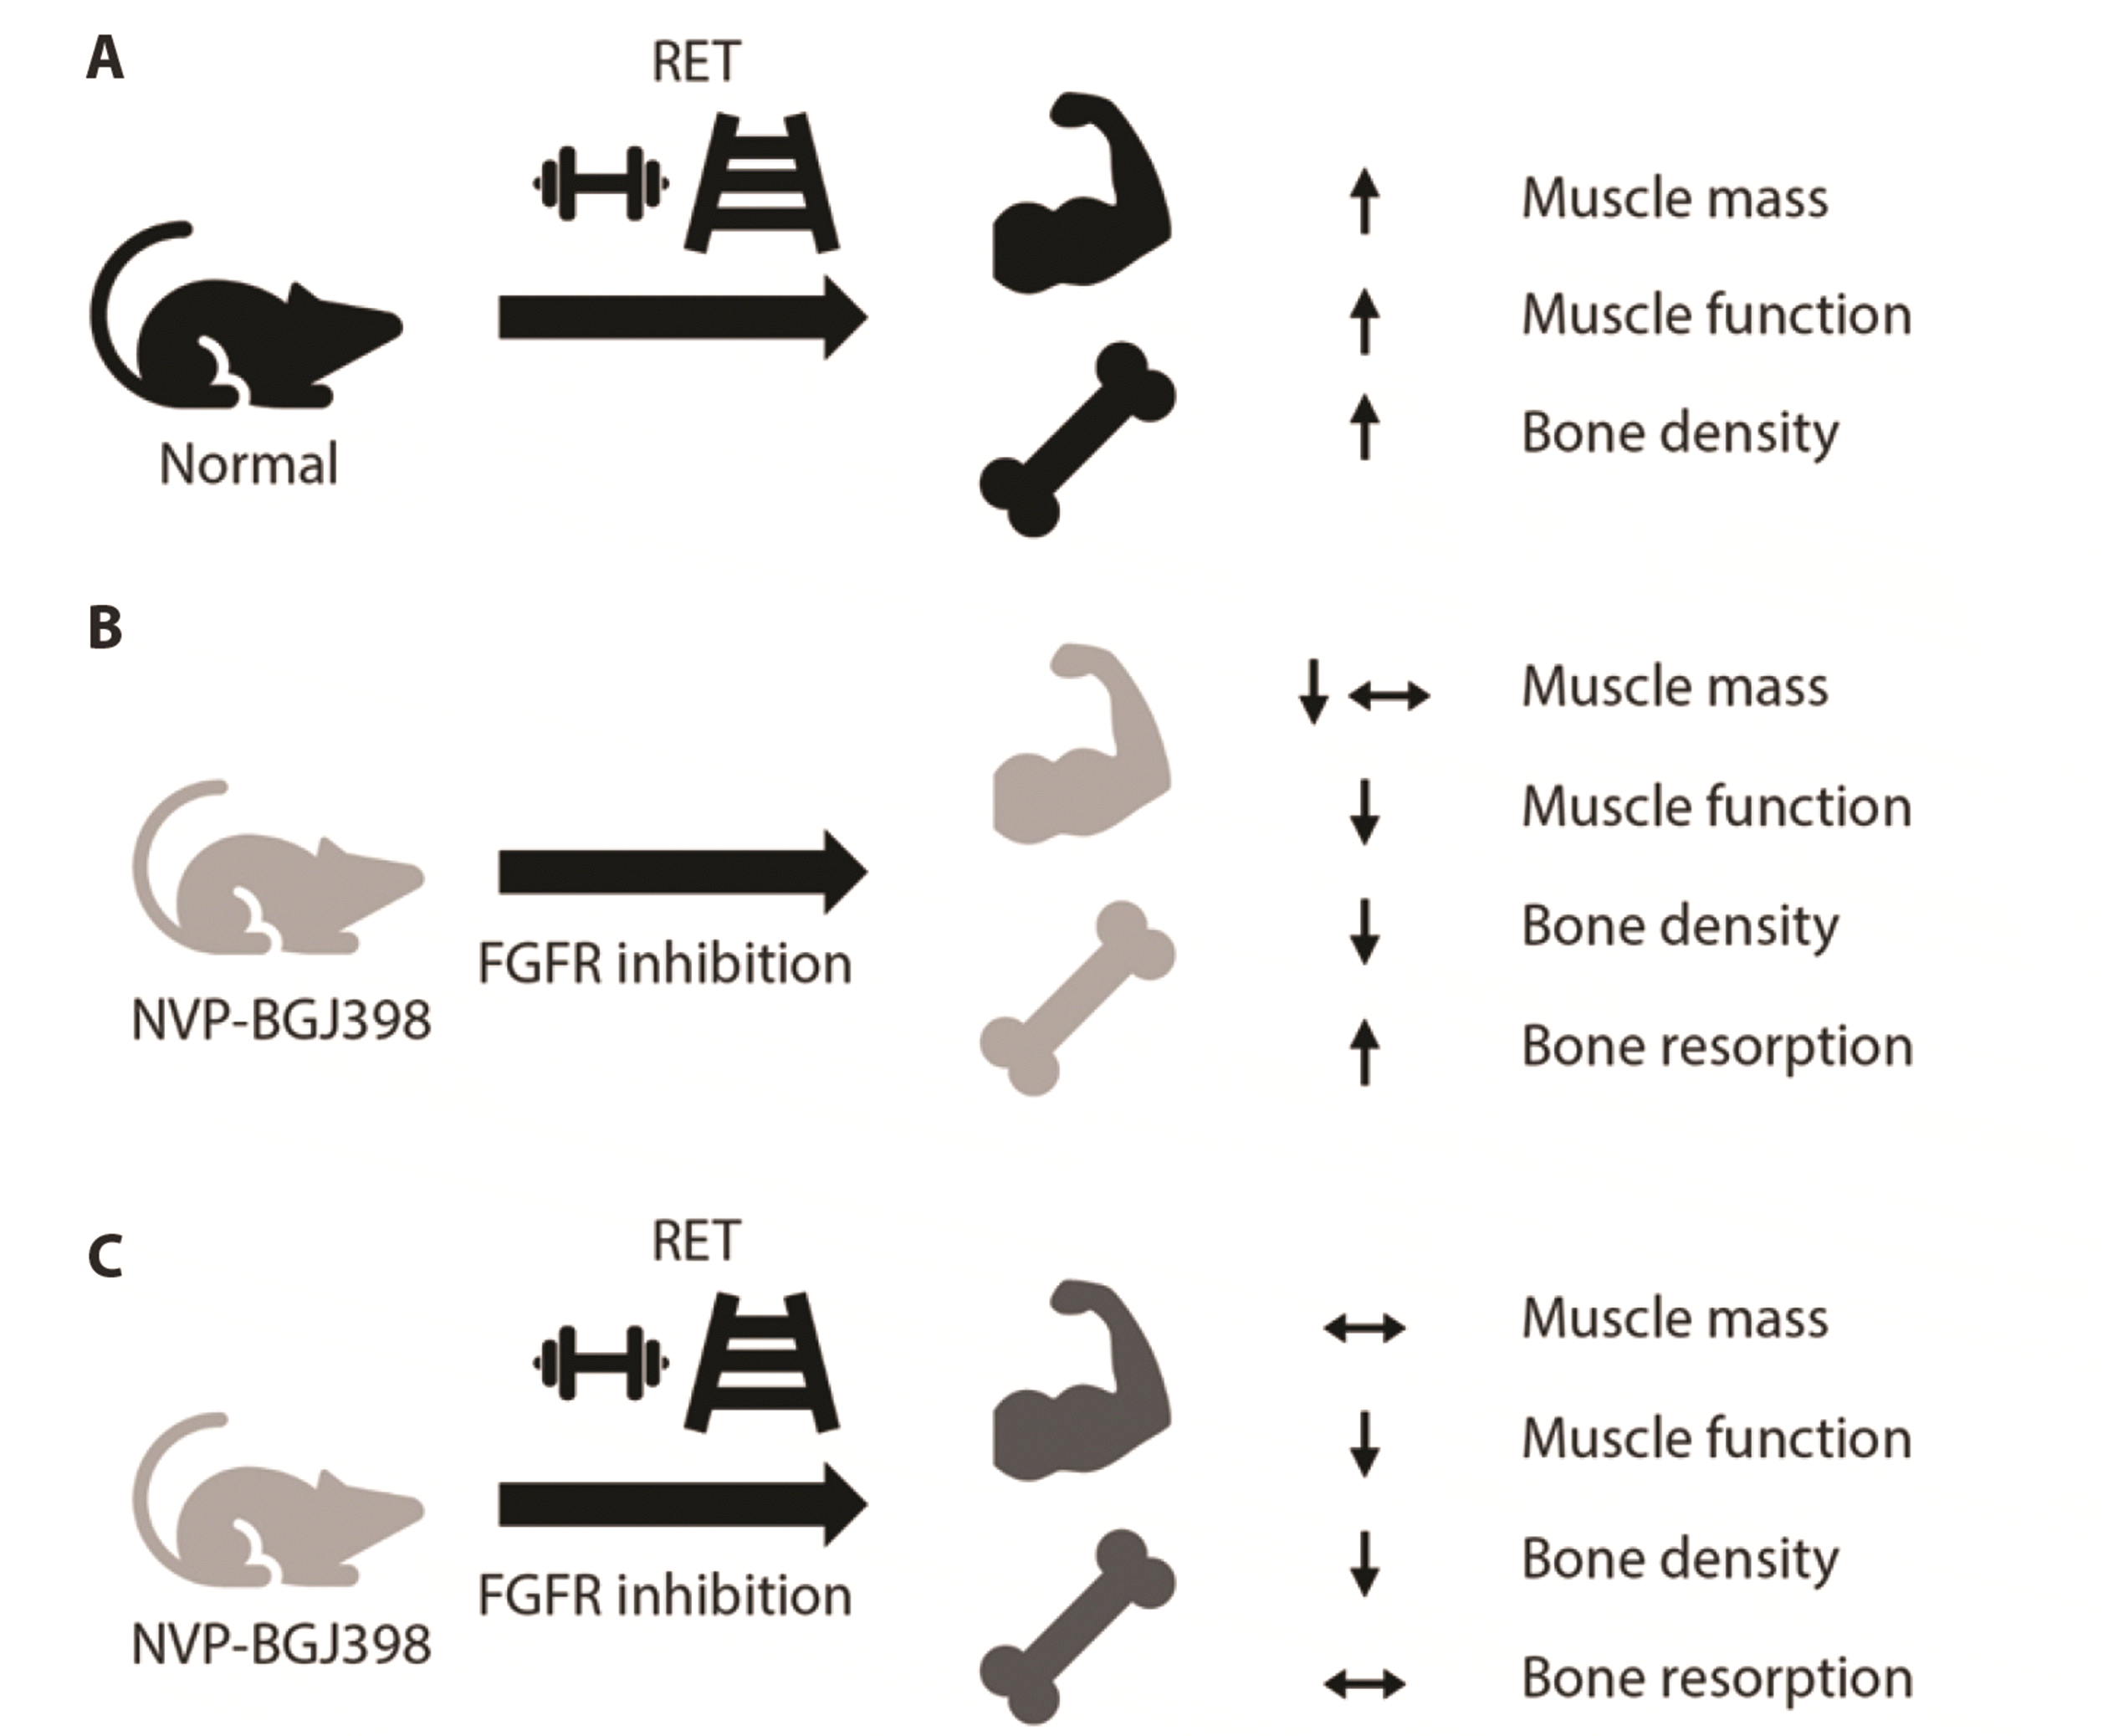
Fig. 7
Schematic diagrams of the blunted adaptation of resistance exercise training during FGFR inhibition.
(A) RET generally provide beneficial effect on bone and muscle quality. (B) FGFR inhibition with NVP-BGJ398 altered bone and muscle quality detrimentally. (C) RET adaptation on bone and muscle were blunted with FGFR inhibition. However, elevated bone resorption was improved. FGFR, fibroblast growth factor receptor; RET, resistance exercise training.
![]()
Effects of FGFR inhibition with or without RET on b.w. and composition
Although statistically insignificant, the b.w. at week 8 of the experimental protocol was lower in the Inh group than that in the Sham group (p = 0.09). In addition, the comparison of body composition normalized to the b.w. (% lean body mass and % body fat) showed significantly lower values in the Inh group than in the sham group (Fig. 1C, D). Interestingly, the parameters of body composition in the Inh + RET group were not different from those in the sham + RET group (Fig. 4C, D). Taken together, RET was effective in the maintenance and recovery of body composition and bone metabolism under chronic inhibition of FGFR signaling, whereas functional impairment of muscle endurance could not be prevented.
Interestingly, changes in atrophy-related genes were observed in the muscle. Increased atrophic marker genes are associated with loss of muscle mass, strength, and function [33-35]. Although the limb muscle weights were not decreased in the Inh group, the Atrogin1 levels were higher, which were similar to the levels in the sham + RET group (Figs. 3C and 6C). Since other relevant genes (Murf1 and Foxo1) were not changed by NVP-BGJ398 treatment, the sole change in Atrogin1 may imply a closer association with FGFR signaling than other genes relevant to the skeletal muscle. Although our data revealed an increase in Atrogin1expression, it did not provide a sufficient explanation of the decreased muscular endurance. Further mechanistic studies are required to understand the Atrogin1 selective change caused by NVP-BGJ398.
The 8 weeks of RET was effective in improving lower limb muscle mass and function (Supplementary Fig. 1). However, the Inh + RET group did not show recovery of grip strength and hang time when compared with the Inh group (Fig. 4E–G). In some previous studies with aged individuals, RET effects were blunted, and this phenomenon was explained by either decreased ribosomal biogenesis or long-term depression of muscle protein synthesis due to impairment in growth factor responses [36,37]. It was reported that a longer period (12 weeks) of RET showed significantly greater muscle quality in young individuals than in those who were older [13], and a similar observation was also found when training was conducted with older human groups (> 70 years) [38]. In addition, RET-induced hypertrophy of the plantaris muscle was less prominent in old mice than in young mice, and a microarray study showed relevant changes of ELF2 and mTOR signaling [36]. This evidence may partially explain the effects of blunted RET adaptation on muscle quality. However, to provide a proper explanation of skeletal muscle function, other factors (neuromuscular adaptation, muscular metabolism, and environmental condition) should be considered, which were not in the present study.
Effects of FGFR inhibition with or without RET on bone density and metabolism
Notably, the decreased bone density due to FGFR inhibition was maintained, whereas the increased bone resorption was restored by RET (Fig. 5A, B). Previous reports have shown that b.w. and muscle strength are not always correlated with each other, whereas bone mineral density and muscle strength are highly correlated [39,40]. The present study also showed a decrease in grip strength and bone loss with upregulated osteoclastogenic genes in the Inh group (Fig. 3). However, the beneficial effects of RET in the Inh group were limited to bone metabolism without the recovery of muscle strength.
FGFR signaling is important for bone formation, and inhibition of FGFR can lead to growth retardation [41]. When FGFR1 and FGFR2 are conditionally mutated or knocked out, humans and mice exhibited skeletal growth abnormality [42,43]. Furthermore, FGF2 knockout mice demonstrated neuronal defect, reduced blood pressure, and other abnormal phenotypes [44]. FGF/FGFR signaling has been reported to control osteoblast activity by enhancing ERK1/2 signaling [45]. Therefore, it is not surprising that the pharmacological inhibition of FGFR affects bone density. However, the unaltered limb muscle weight and negligible effect on total b.w. were unexpected findings. We cautiously interpret these results to suggest that the amount and duration of NVP-BGJ398 treatment may have been insufficient for the full in vivo effects in mice.
Increased bone turnover due to RET has been reported [46]. Mechanostat theory states mechanical loading transmits stimuli to osteoblasts and osteoclasts, which are involves in bone formation and resorption [47-49]. Furthermore, recent evidence suggests that not only does mechanical stress acts on bone formation, but also that some myokines can be effective in enhancing bone quality [50]. Skeletal muscle secretes various growth factors including insulin-like growth factor 1 (IGF-1), FGF2 and FGF21. IGF-1 and FGF2 enhance bone formation via elevating osteoblast proliferation [51,52]. Moderate intensity resistance exercises for 12 weeks altered bone metabolism in a favorable manner, while no significant differences were observed in total and regional bone mineral density [53]. The current study showed that elevated Rankl:Opg in FGFR inhibition (Fig. 3D) was returned to normal levels (Fig. 5D) after 8 weeks of RET, while bone density still remained low, suggesting putatively insufficient duration of RET for the full beneficial effects on the quality of bone under FGFR inhibition.
In conclusion, our data revealed a potential role for FGFR signaling in physical performance related to muscle and bone function. Physical performance is important for quality of life and declines during aging process. Thus, the decrease in FGFR signaling may be related to the aging-dependent loss of physical performance. Furthermore, RET adaptation could be blunted by FGFR signaling inhibition, which may partially explain training adaptation during aging process. However, further analysis is required to clarify this relationship. As NVP-BGJ398 is not a specific inhibitor for certain FGFRs, and the presence of FGFR and FGF families is ubiquitous in whole organs in the body, specific knockout model may be required to test whether local inhibition changes whole body physiology.
SUPPLEMENTARY MATERIALS
Supplementary data including one figure can be found with this article online at https://doi.org/10.4196/kjpp.2022.26.3.207.
 XML Download