INTRODUCTION
METHODS
Chemicals, reagents and botanical material
Cell culture
Cytotoxicity assays
Detection of Rhodamine 123 (Rho 123)
K562/DOX xenograft NOD/SCID mice model
Histopathology
Transmission electron microscopy
ELISA analysis
Detection of cell extracellular acidification rate
Western blot analysis
Real-time polymerase chain reaction (RT-PCR)
Statistical analysis
RESULTS
Drug resistant testing of K562/DOX and A2780/Taxol cell lines
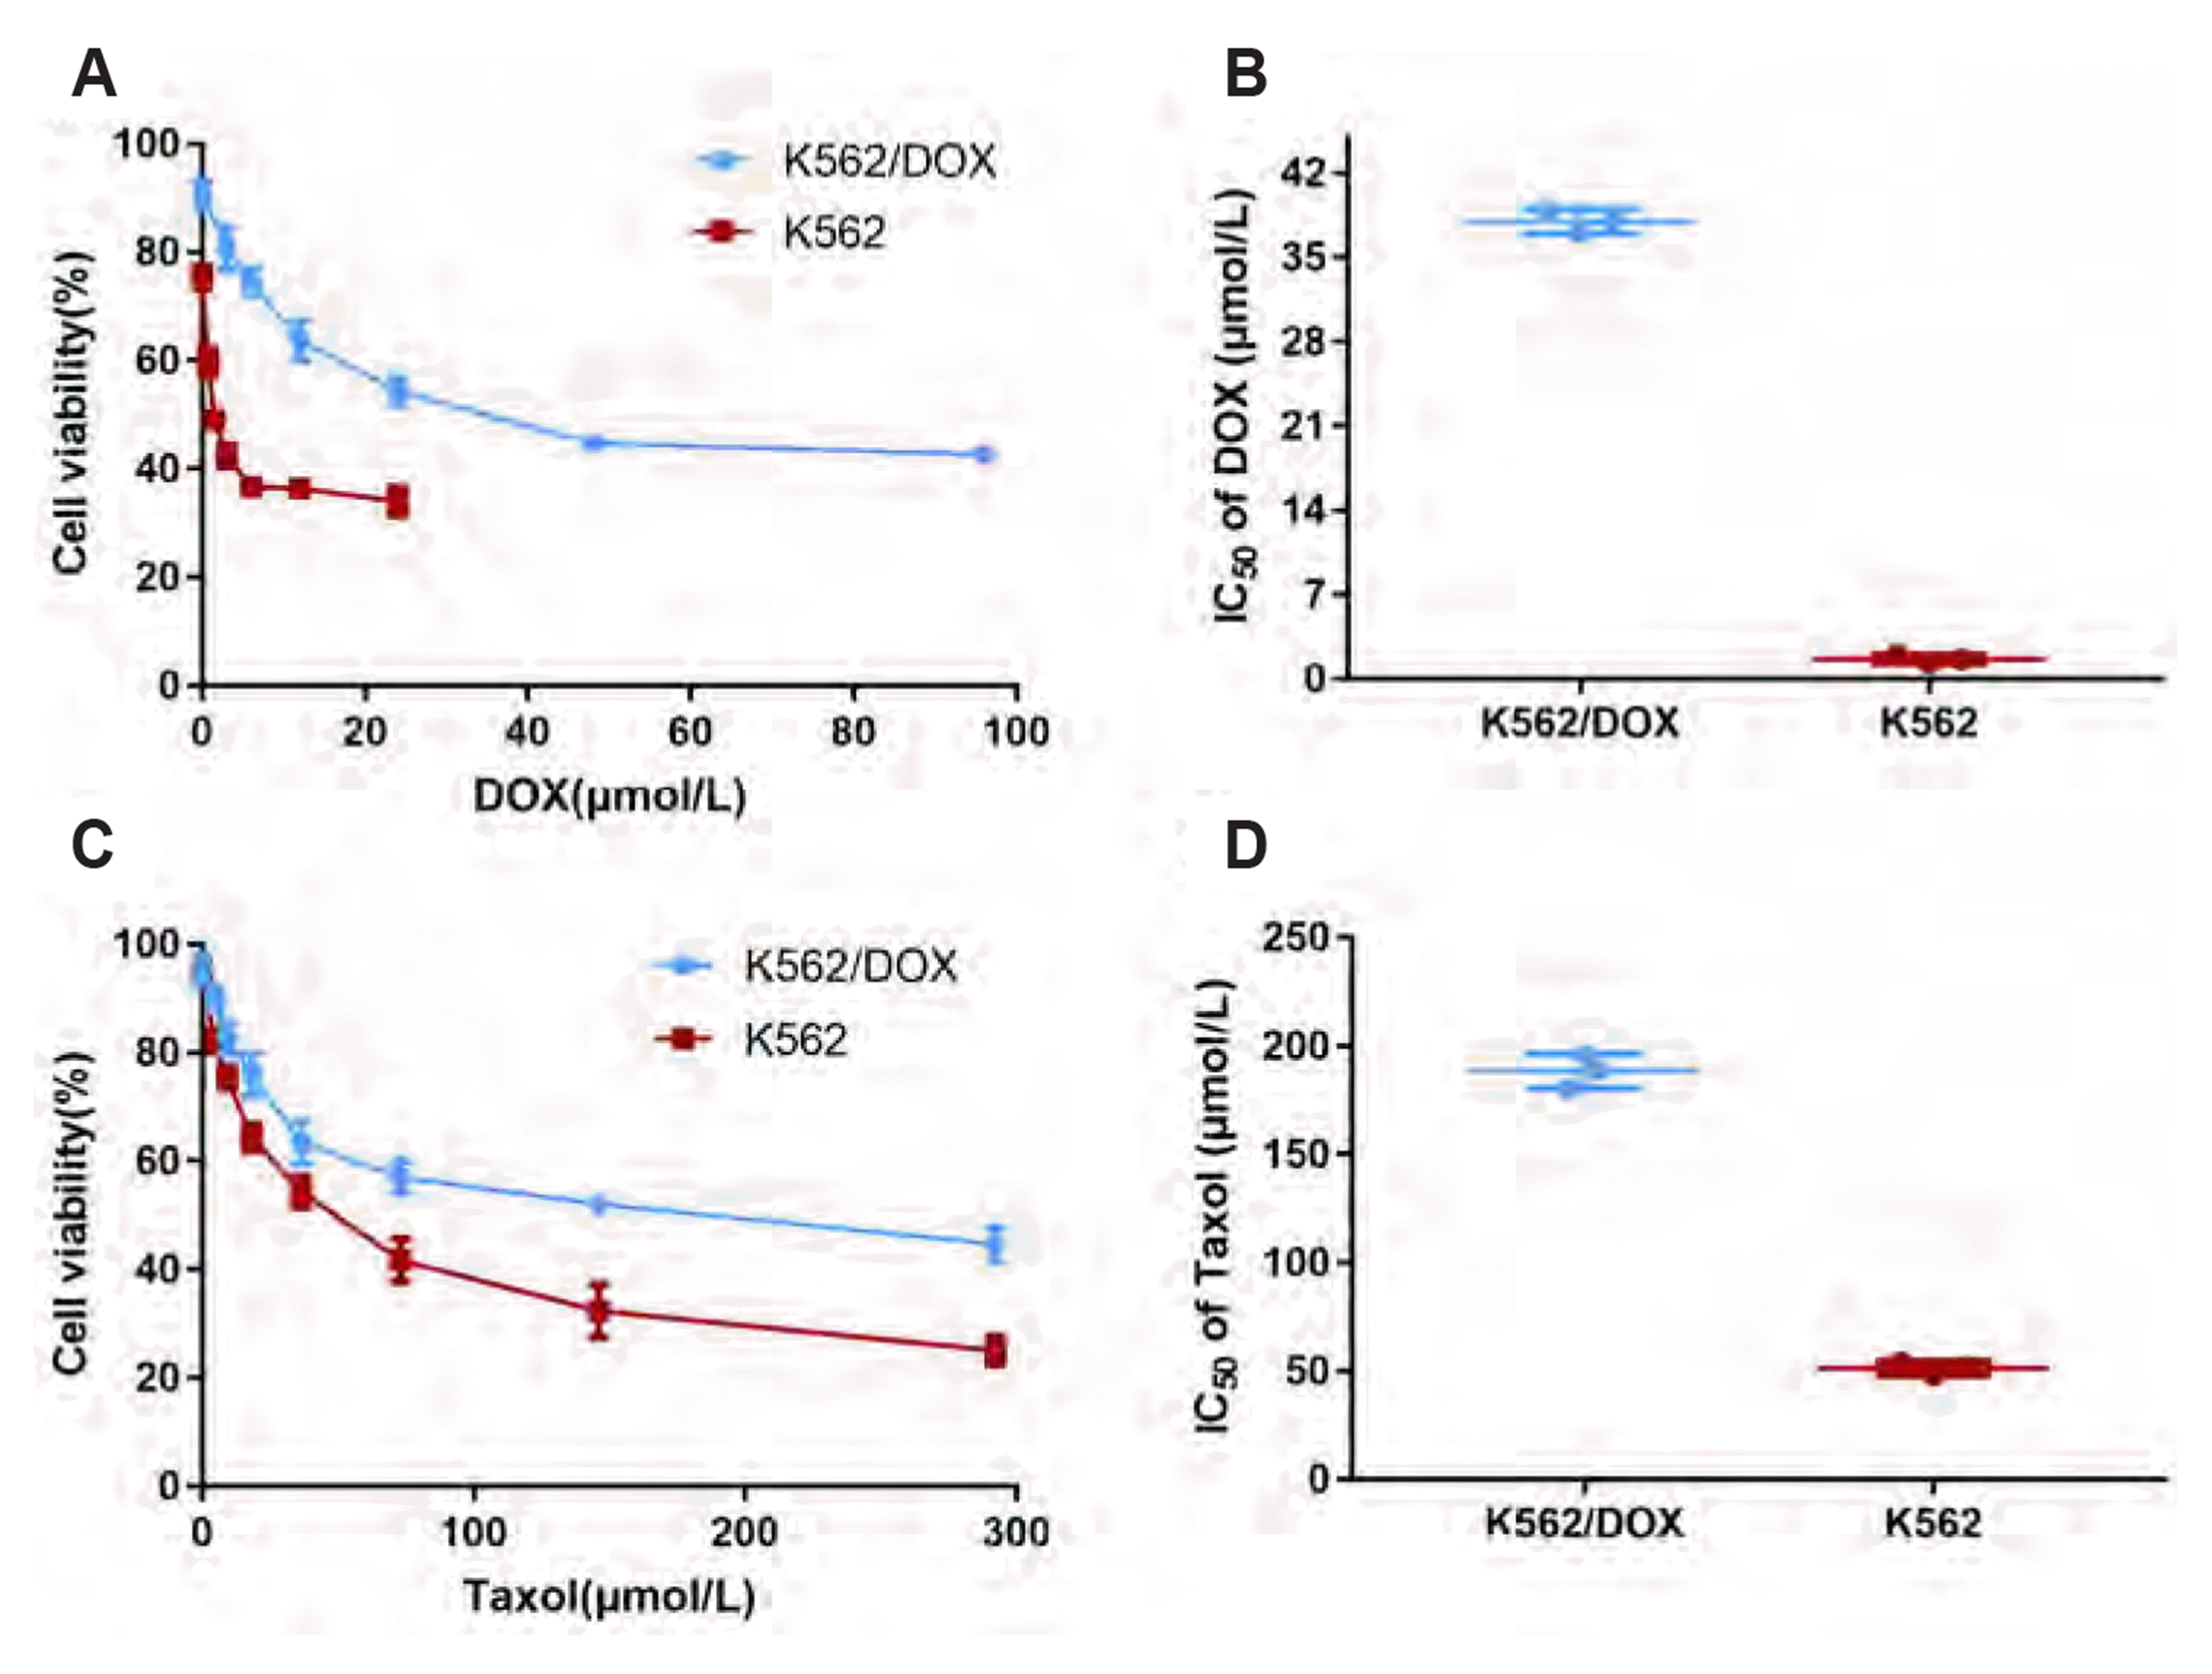 | Fig. 2The resistance index of resistant cell line of K562/DOX and A2780/Taxol.(A) Cell survival rate of different concentration of DOX on K562 and K562/DOX. (B) IC50 (µmol/L) values were calculated from survival curves using the Bliss method and then RI was calculated by dividing the IC50 for K562/DOX cells by that of K562 cells. (C) Cell survival rate of different concentration of Taxol on A2780 and A2780/Taxol. (D) IC50 (µM) values were calculated from survival curves using the Bliss method and then RI was calculated by dividing the IC50 for A2780/DOX cells by that of A2780 cells. Taxol, Taxinol; DOX, doxorubicin; IC50, 50% inhibiting concentration; RI, resistance index.
|
Table 1
| Group | IC50 (µM) | RI | RF | |
|---|---|---|---|---|
| K562 | K562/DOX | |||
| DOX | 1.63 ± 0.20 | 38.2 ± 0.58* | 23.43 | - |
| DOX + IMP (2.78 µM) | 2.06 ± 0.18 | 9.38 ± 0.07*,† | 4.55 | 5.15 |
| DOX + IMP (5.56 µM) | 1.93 ± 0.09 | 4.56 ± 0.13*,† | 2.36 | 9.93 |
| DOX + IMP (11.10 µM) | 2.08 ± 0.19 | 3.50 ± 0.07*,† | 1.68 | 13.95 |
Data are shown as means ± SD, n = 3. K562 and K562/DOX cells were incubated with various concentrations of DOX (0.36–92.00 µM) in the presence or absence of IMP (2.78, 5.56, 11.10 µM) for 48 h, respectively. The cytotoxicity was evaluated by CCK-8 assay. IC50 (µM) values were calculated using the Bliss method. RI was calculated by dividing the IC50 for K562/DOX cells by that of K562 cells. RF was calculated as the ratio between the IC50 value of DOX alone to that of IMP combined with DOX in K562/DOX cells. IC50, 50% inhibiting concentration; RI, resistance index; RF, reversal fold; DOX, doxorubicin; IMP, imperatorin; CCK-8, Cell Counting Kit-8. *p < 0.05 vs. respective K562 cells; †p < 0.05 vs. respective DOX alone group.
Table 2
| Group | IC50 (µM) | RI | RF | |
|---|---|---|---|---|
| A2780 | A2780/Taxol | |||
| Taxol | 51.33 ± 1.76 | 188.30 ± 4.63* | 3.67 | - |
| Taxol + IMP (7.40 µM) | 52.84 ± 1.18 | 83.29 ± 2.21*,† | 1.58 | 2.32 |
| Taxol + IMP (18.50 µM) | 56.89 ± 2.01 | 71.05 ± 2.13*,† | 1.25 | 2.94 |
| Taxol + IMP (37.00 µM) | 51.57 ± 2.11 | 35.53 ± 1.17*,† | 0.69 | 5.32 |
Data are shown as means ± SD, n = 3. A2780 and A2780/Taxol cells were incubated with various concentrations of Taxol (0.76–97.12 µM) in the presence or absence of IMP (7.40, 18.50, 37.00 µM) for 48 h, respectively. The cytotoxicity was evaluated by CCK-8 assay. IC50 (µM) values were calculated using the Bliss method. RI was calculated by dividing the IC50 for A2780/Taxol cells by that of A2780 cells. RF was calculated as the ratio between the IC50 value of Taxol alone to that of IMP combined with Taxol in A2780/Taxol cells. IC50, 50% inhibiting concentration; Taxol, Taxinol; RI, resistance index; RF, reversal fold; IMP, imperatorin; CCK-8, Cell Counting Kit-8. *p < 0.05 vs. respective A2780 cells; †p < 0.05 vs. respective Taxol alone group.
Reversal effect of IMP on drug resistance cell lines of K562/DOX and A2780/Taxol
 | Fig. 3Chemosensitizing effect analysis of IMP on various tumor-resistant cell lines.(A) Cell viability of different concentrations of DOX combined with IMP (2.78, 5.56, and 11.10 µM) on K562 cells. (B) Cell viability of different concentrations of DOX combined with IMP ( 2.78, 5.56, and 11.10 µM) on K562/DOX cells. (C) Cell viability of different concentrations of Taxol combined with IMP (7.40, 18.50, and 37.00 µM) on A2780 cells. (D) Cell viability of different concentrations of Taxol combined with IMP (7.40, 18.50, and 37.00 µM) on A2780/Taxol cells. Representative data from three independent experiments. IMP, imperatorin; DOX, doxorubicin; Taxol, Taxinol.
|
Effect of IMP on intracellular accumulation of Rho 123
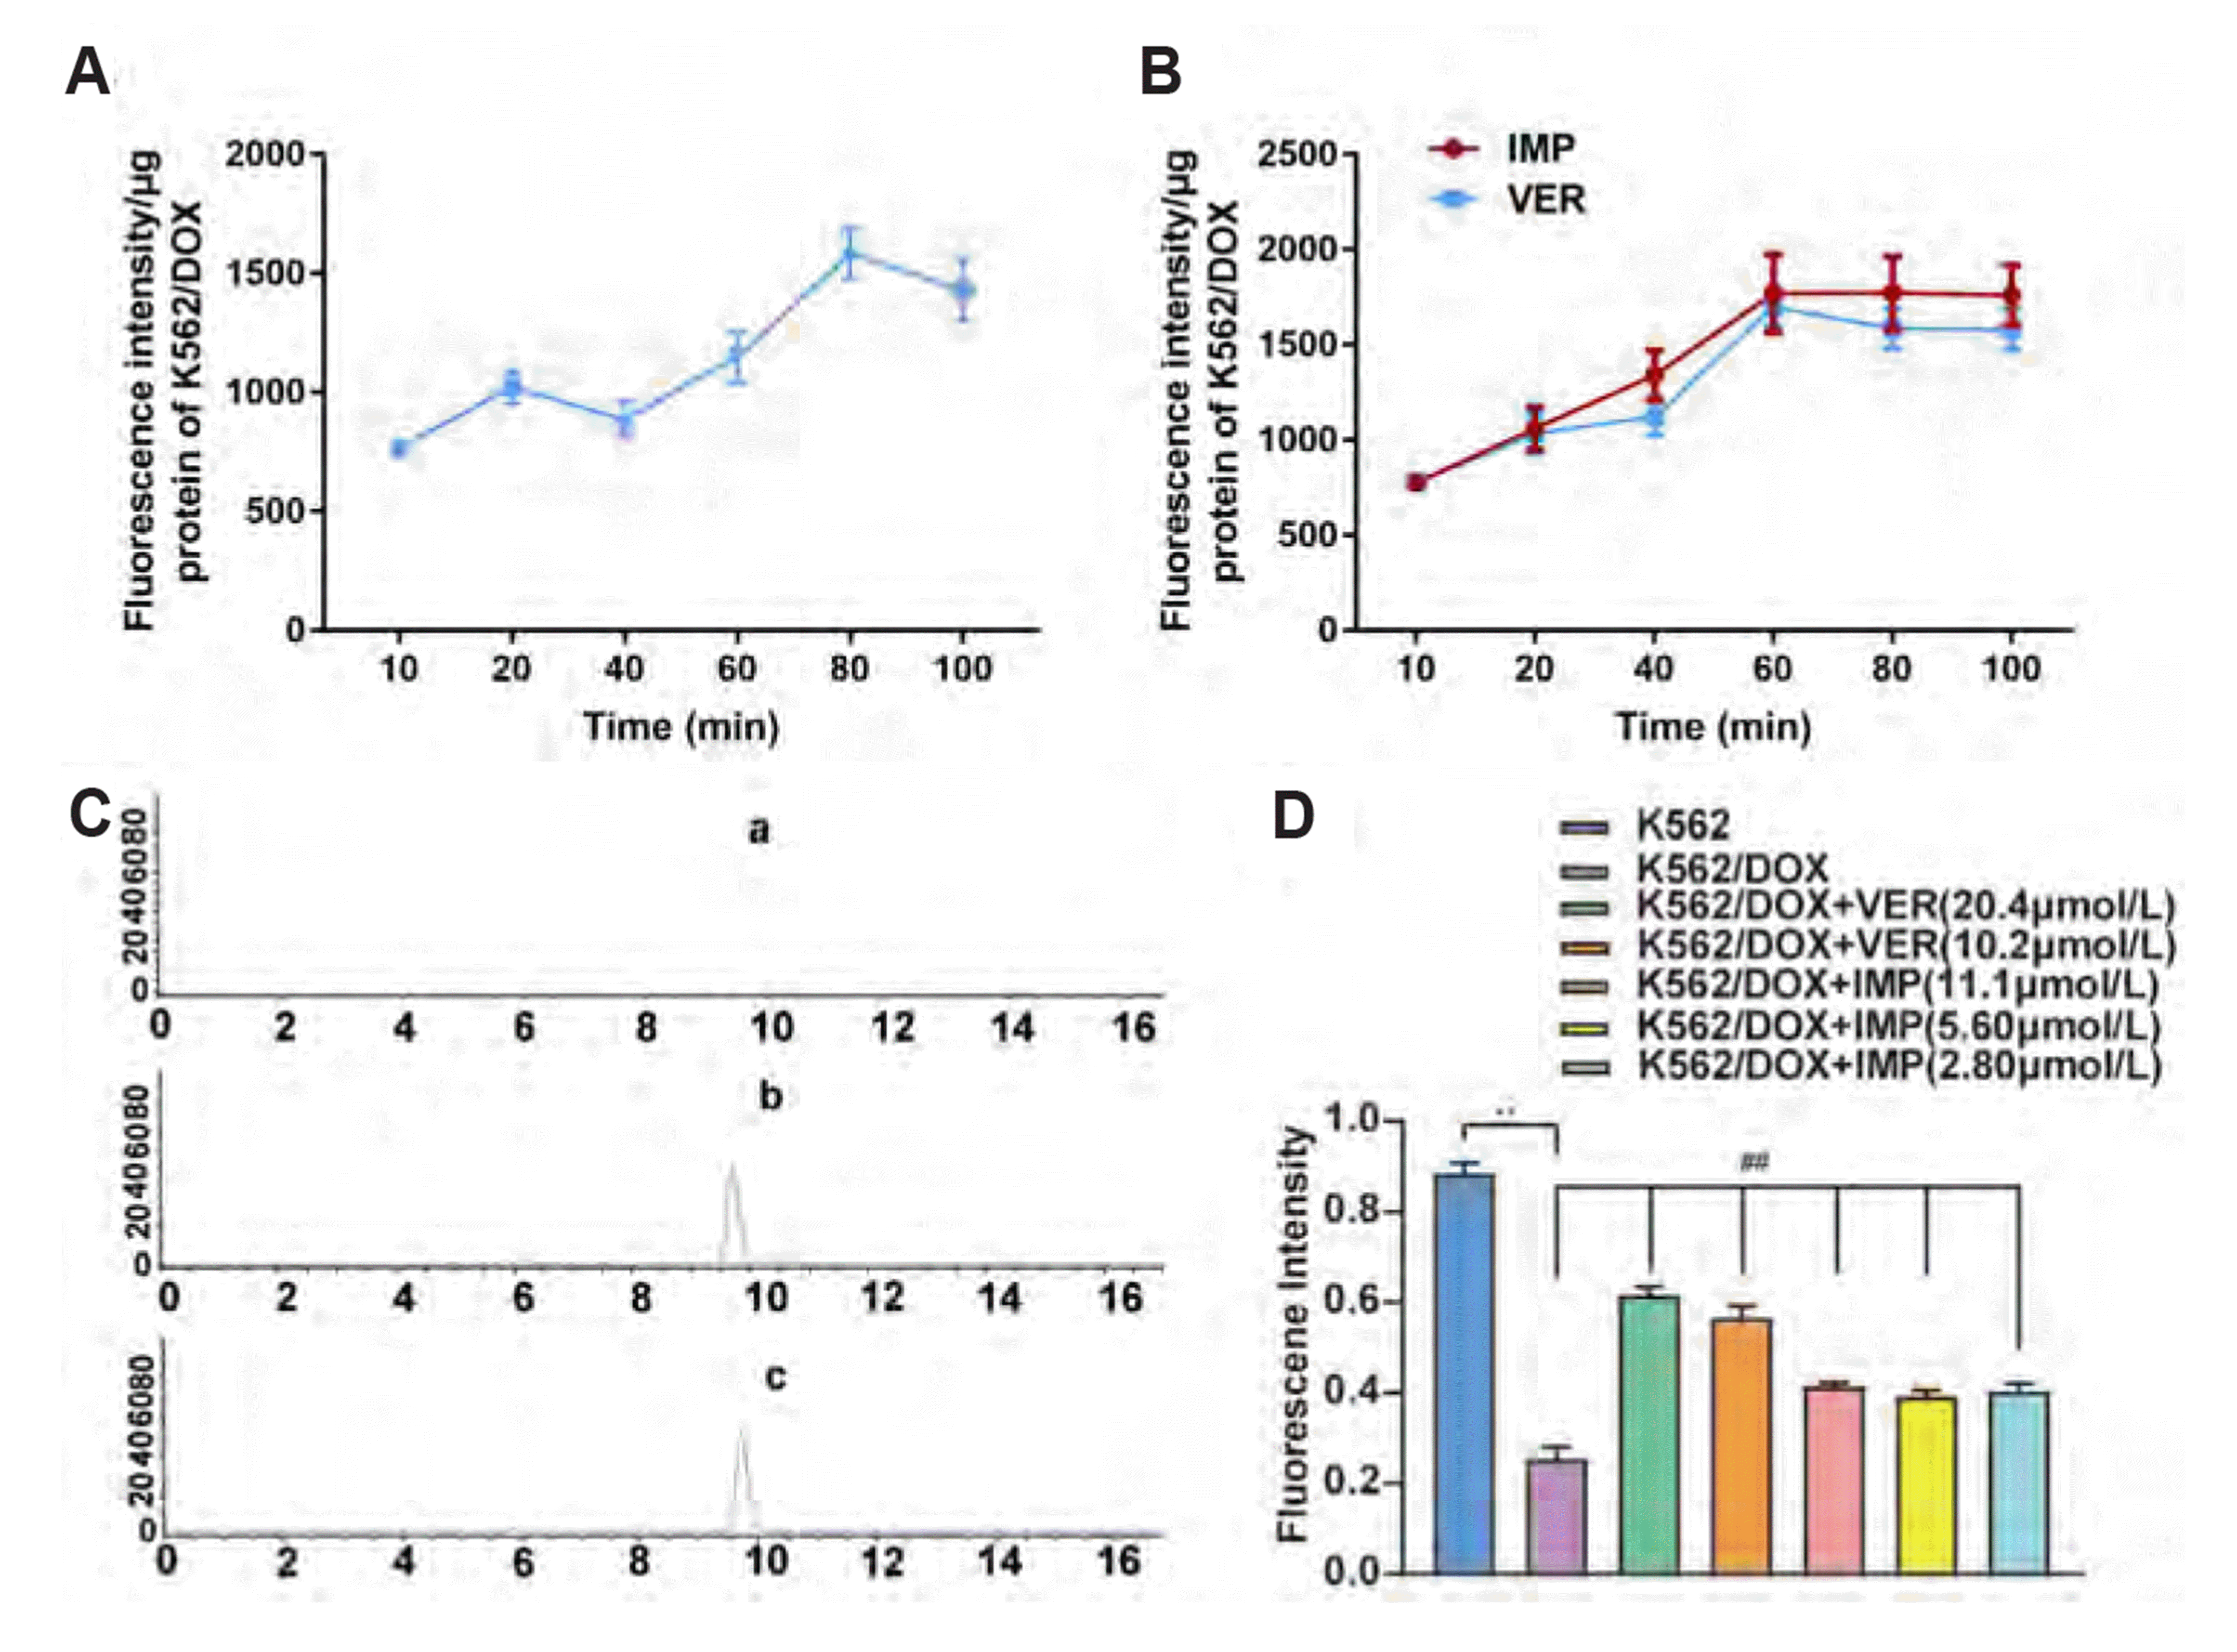 | Fig. 4Effect of IMP on intracellular accumulation of Rho 123.(A) Effect of time on the fluorescence intensity of Rho 123 in K562/DOX cells. (B) Effect of the coincubation time of Rho 123 and drugs on the fluorescence intensity of Rho 123 in K562/DOX cells. (C) HPLC method specificity. (C-a) K562/DOX cells solution. (C-b) K562/DOX cells solution containing Rho 123 reference solution. (C-c) K562/DOX cells solution after incubation with Rho 123 for 75 min. (D) Effect of IMP on intracellular accumulation of Rho 123 in K562 cells and K562/DOX cells. K562/DOX cells treated with 10.2 and 20.4 µmol/L VER, which used as the positive control. Data are shown as means ± SD, n = 3. IMP, imperatorin; DOX, doxorubicin; Taxol, Taxinol; HPLC, high-performance liquid chromatography; VER, verapamil. **p < 0.01 vs. K562 cells. ##p < 0.01 vs. K562/DOX cells untreated group.
|
IMP inhibiting restraining the glycolysis and glutamine metabolism of K526/DOX cells in vitro
 | Fig. 5IMP restrained the glycolysis and glutamine metabolism of K526/DOX cells in vitro.(A) DOX promoted the expression of P-gp. (B, C) The glucose consumption, lactate production and ECAR were measured to assess cell glycolysis. (D, E) Glutamine consumption, α-KG production and ATP production were determined using corresponding Assay Kits, respectively. K562/DOX cells treated with 0 and 2.8 µM IMP. IMP, imperatorin; DOX, doxorubicin; P-gp, P-glycoprotein; ECAR, extracellular acidification rate; α-KG, α-ketoglutaric acid; 2-DG, 2-deoxy-D-glucose. **p < 0.01.
|
Effect of IMP combined with DOX on tumor growth of K562/DOX xenograft tumors in NOD/SCID mice
 | Fig. 6Effect of IMP combined with DOX on tumor growth of K562/DOX xenograft tumors in NOD/SCID mice.(A) The tumor volumes were measured at 0, 7, and 14 days. (B) The tumor weights were analyzed after 14 days. (C) Representative images of tumor tissues subjected to different treatments of DOX and IMP (1, untreated model group; 2, DOX 2.5 mg/kg alone group; 3, IMP 10 mg/kg + DOX 2.5 mg/kg group; 4, IMP 20 mg/kg + DOX 2.5 mg/kg group). Data are shown as means ± SD, n = 8. IMP, imperatorin; DOX, doxorubicin. *p < 0.05; **p < 0.01 vs. untreated model group. ##p < 0.01 vs. DOX 2.5 mg/kg alone group.
|
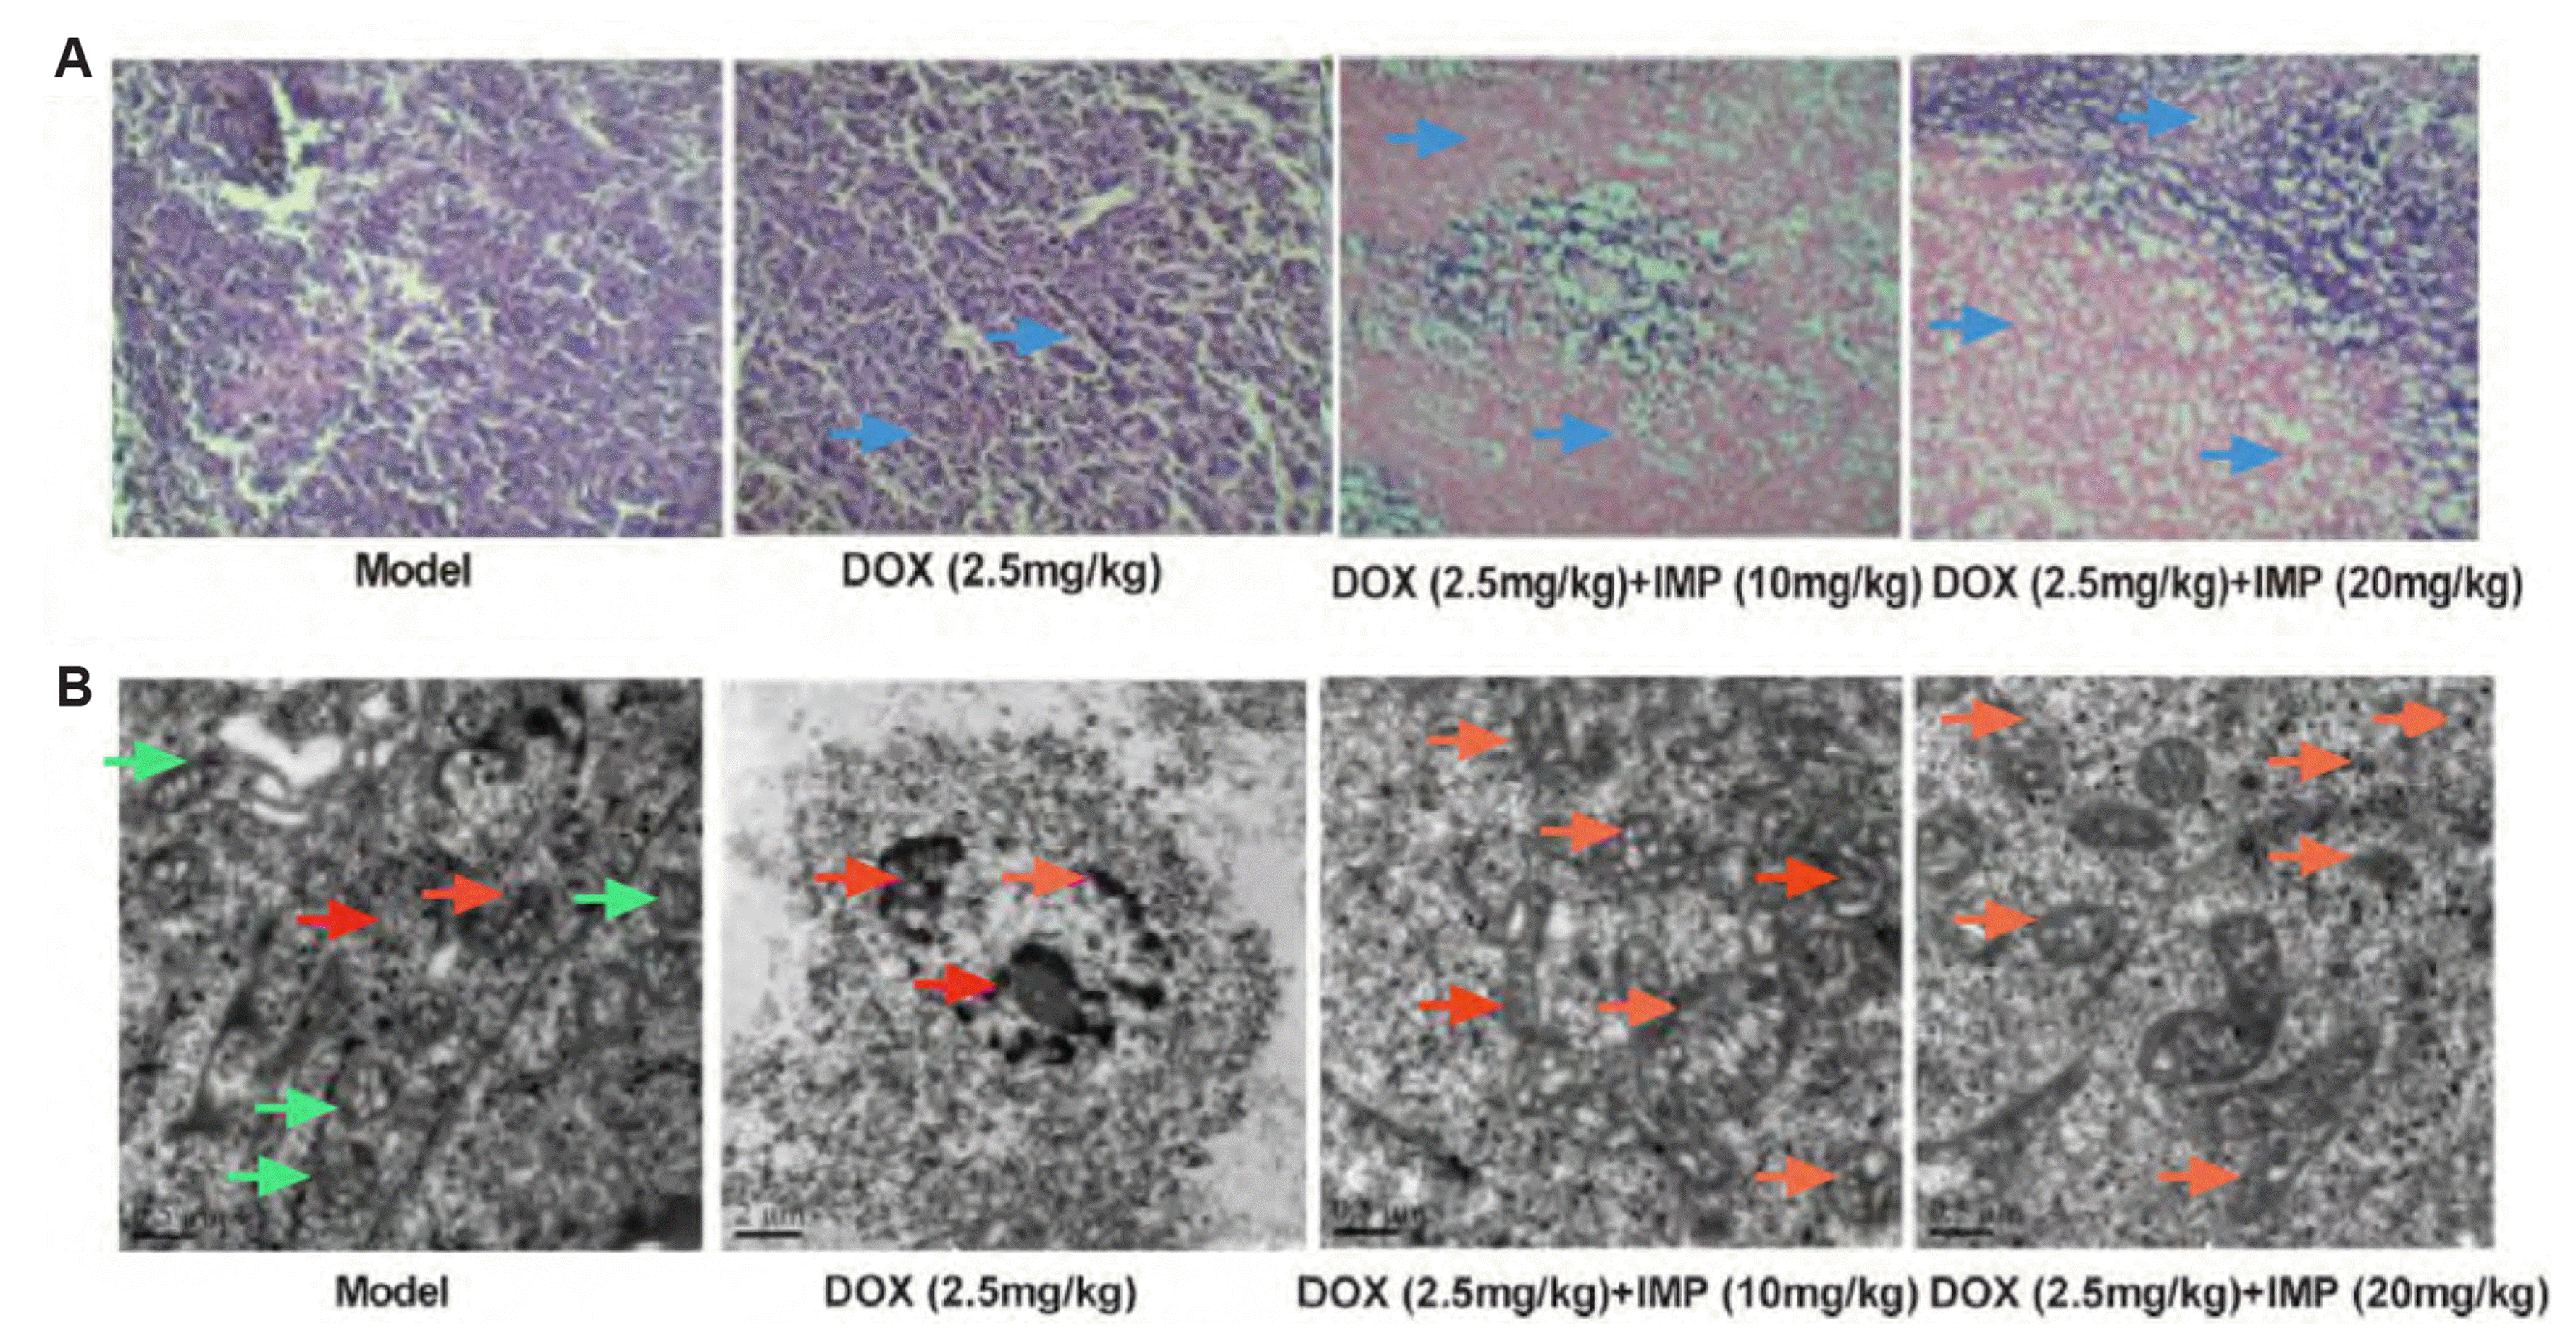 | Fig. 7Effect of IMP combined with DOX on pathological abnormalities of K562/DOX xenograft tumors in NOD/SCID mice.(A) Tumor tissues were fixed, sectioned, and stained with H&E (magnification, ×50). The blue arrows indicate that the cell structure was seriously damaged and the cell density was enhanced. (B) Electron microscope observation of tumor tissues subjected to different treatments with IMP (10 and 20 mg/kg) and DOX (2.5 mg/kg). The red arrows indicated mitochondria indicates that the cells have shrinkage, necrosis, cytoplasmic vacuoles. The orange arrows were more obvious mitochondrial structure. The green arrows pointed out the mitochondrial morphology of normal cells. IMP, imperatorin; DOX, doxorubicin.
|
Effect of IMP combined with DOX on P-gp protein and mRNA expressions in vivo
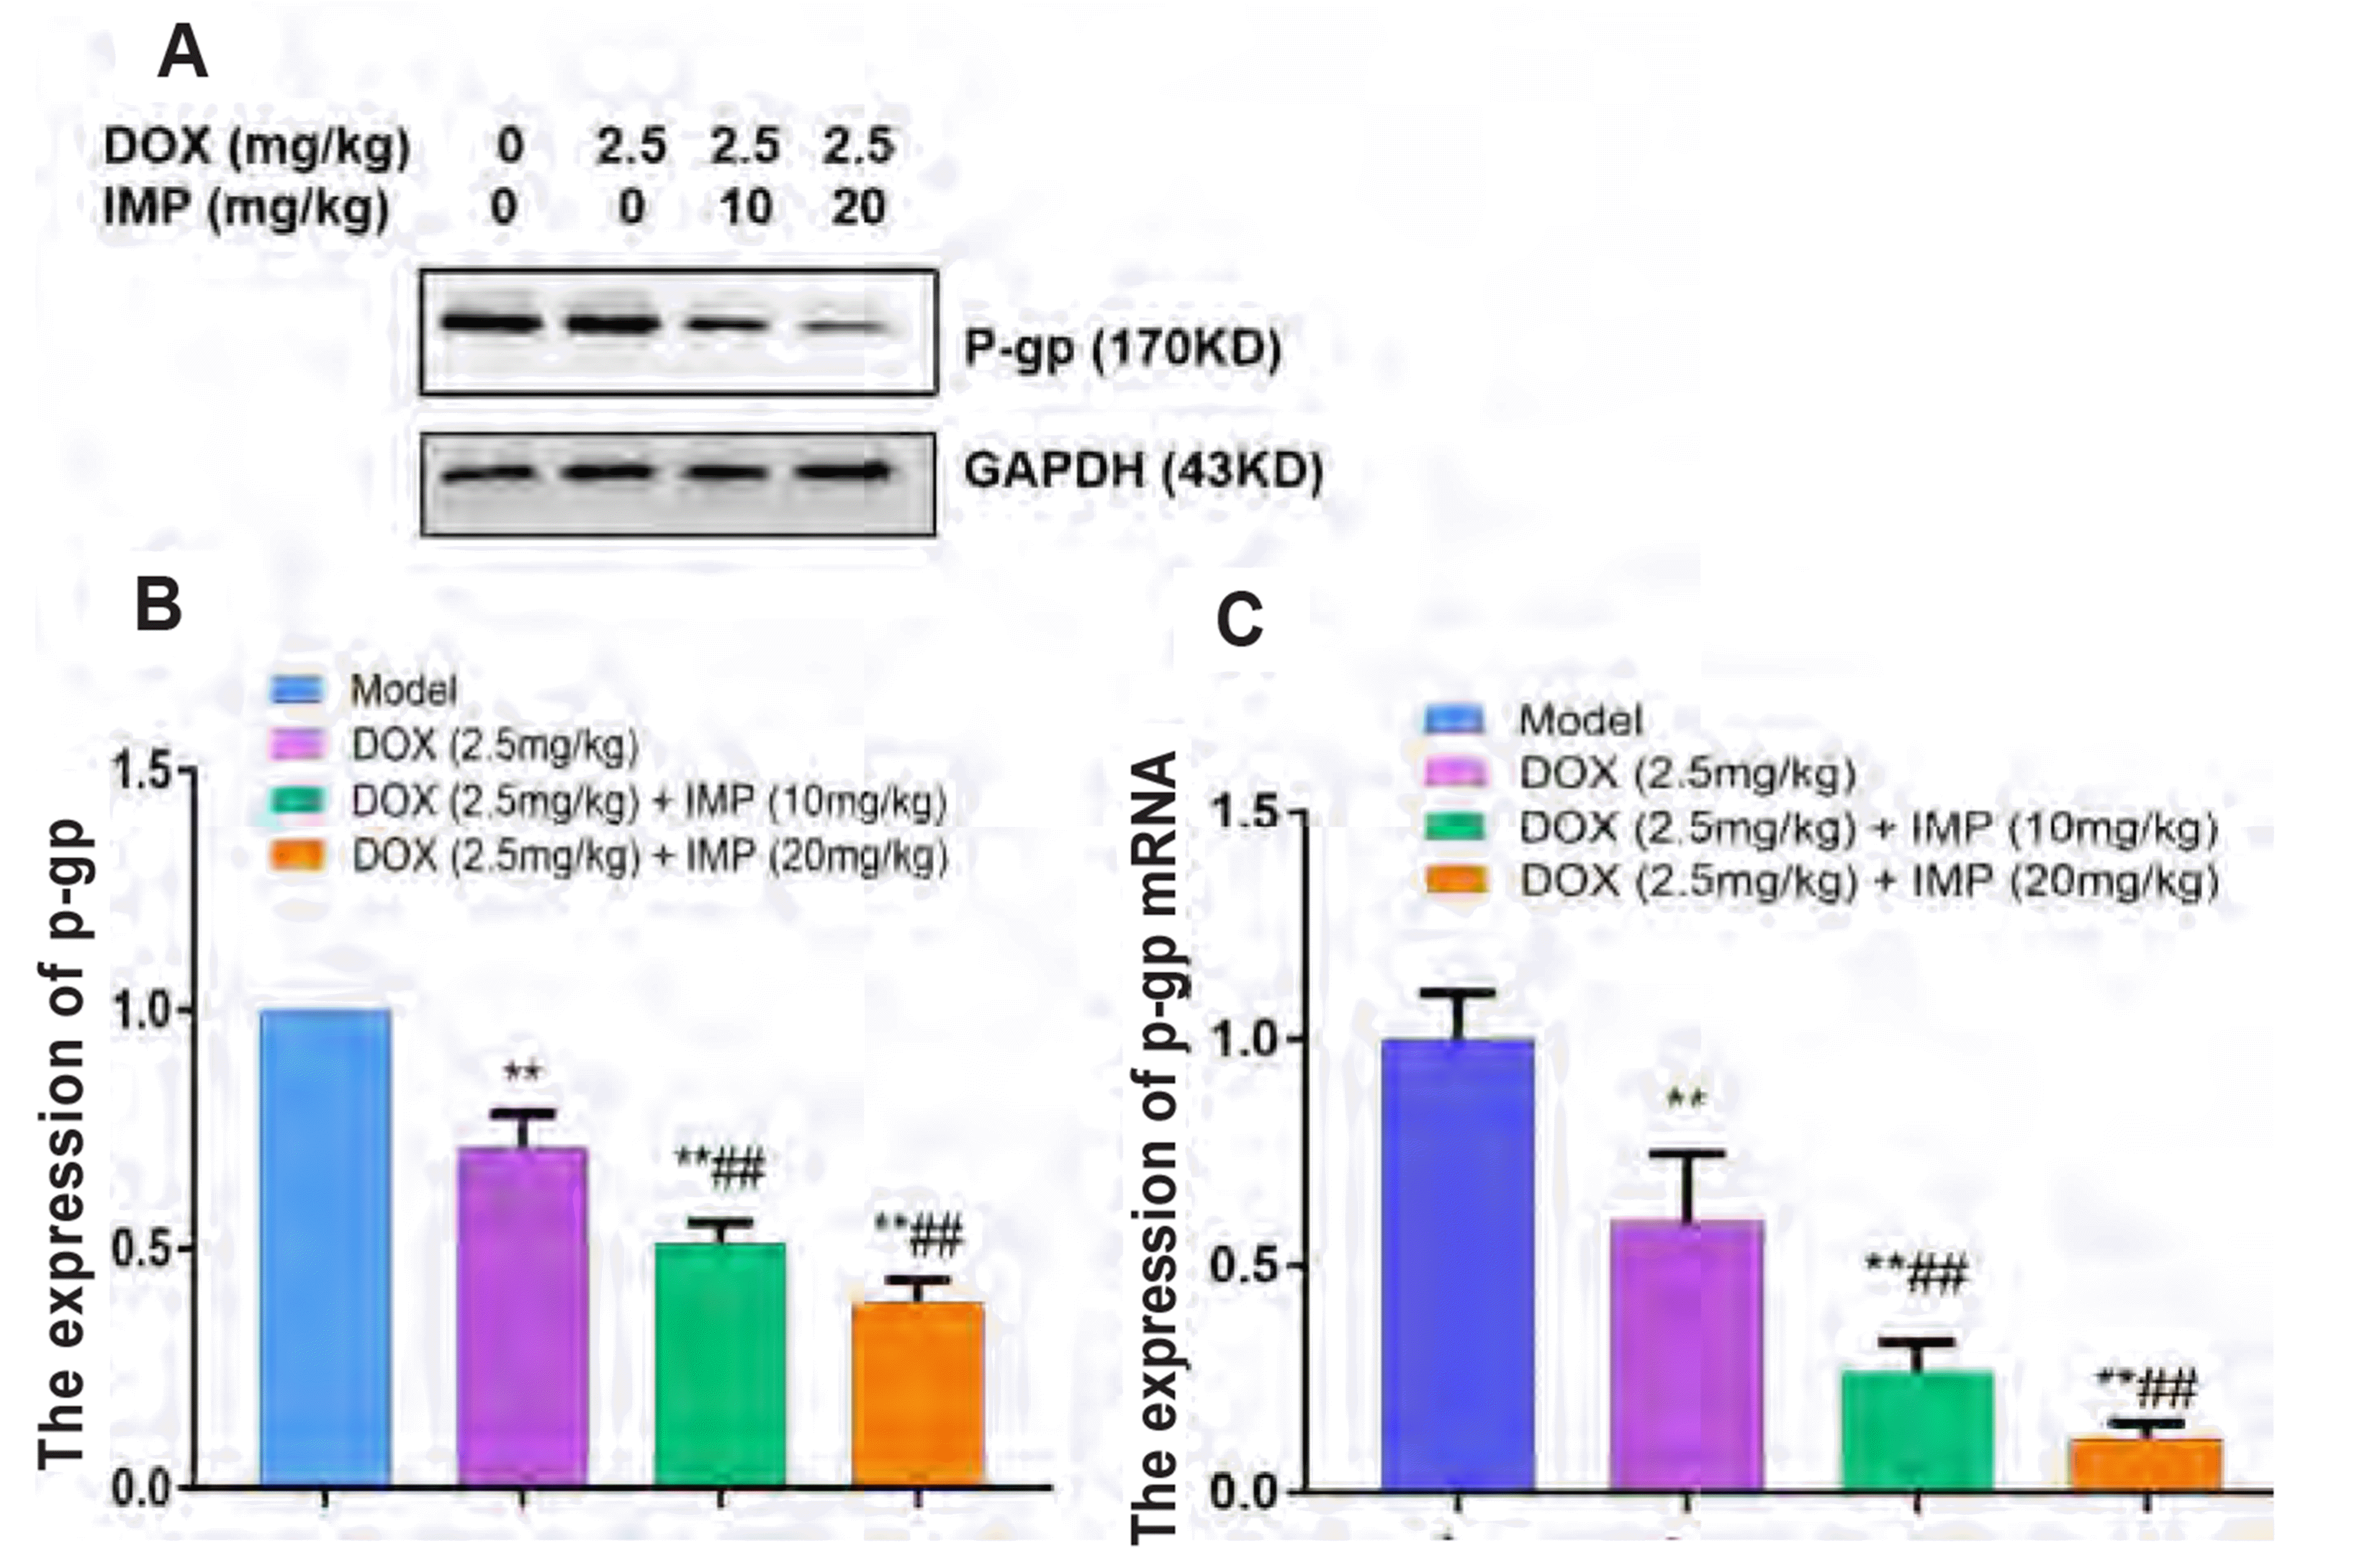 | Fig. 8Effect of IMP combined with DOX on P-gp expression in K562/DOX xenograft tumors in NOD/SCID mice.(A) Representative Western blots of P-gp protein. Quantified data showing IMP at dosage of 10 mg/kg and 20 mg/kg combined with DOX (2.5 mg/kg) treatments inhibited P-gp protein expression (B) and mRNA level (C) in K562/DOX xenograft tumor tissues as compared with DOX (2.5 mg/kg) alone treatment. Data are presented as the means ± SD, n = 8. IMP, imperatorin; DOX, doxorubicin; P-gp, P-glycoprotein. **p < 0.01 vs. untreated model group. ##p < 0.01 vs. DOX (2.5 mg/kg) alone group.
|


 PDF
PDF Citation
 Print
Print


 XML Download