Journal List > Cancer Res Treat > v.54(3) > 1516078566

Feng, Liu, Yuan, Dong, Zhang, Zhang, Chang, Xia, Li, Zhu, Xing, Wang, Shi, Wang, and Hu: The Feasibility of Using Biomarkers Derived from Circulating Tumor DNA Sequencing as Predictive Classifiers in Patients with Small-Cell Lung Cancer

Abstract

Purpose

This study aimed to investigate the feasibility of biomarkers based on dynamic circulating tumor DNA (ctDNA) to classify small cell lung cancer (SCLC) into different subtypes.

Materials and Methods

Tumor and longitudinal plasma ctDNA samples were analyzed by next-generation sequencing of 1,021 genes. PyClone was used to infer the molecular tumor burden index (mTBI). Pre-treatment tumor tissues (T1) and serial plasma samples were collected (pre-treatment [B1], after two [B2], six [B3] cycles of chemotherapy and at progression [B4]).

Results

Overall concordance between T1 and B1 sequencing (n=30) was 66.5%, and 89.5% in the gene of RB1. A classification method was designed according to the changes of RB1 mutation, named as subtype I (both positive at B1 and B2), subtype II (positive at B1 but negative at B2), and subtype III (both negative at B1 and B2). The median progressive-free survival for subtype I patients (4.5 months [95% confidence interval (CI), 2.6 to 5.8]) was inferior to subtype II (not reached, p < 0.001) and subtype III (10.8 months [95% CI, 6.0 to 14.4], p=0.002). The median overall survival for subtype I patients (16.3 months [95% CI, 5.3 to 22.9]) was inferior to subtype II (not reached, p=0.01) and subtype III (not reached, p=0.02). Patients with a mTBI dropped to zero at B2 had longer median overall survival (not reached vs. 19.5 months, p=0.01). The changes of mTBI from B4 to B1 were sensitive to predict new metastases, with a sensitivity of 100% and a specificity of 85.7%.

Conclusion

Monitoring ctDNA based RB1 mutation and mTBI provided a feasible tool to predict the prognosis of SCLC.

Introduction

Lung cancer remains the leading cause of cancer death worldwide [1]. Small cell lung cancer (SCLC), accounting for about 13%–15% of all lung cancers [2], is characterized by a high growth rate and early development of widespread metastases [3], which leads to a much lower five-year survival rate of less than 7% [4]. Only less than 5% of SCLC patients of stage I–IIA may benefit from surgical resection [5,6]. Systematic chemotherapy with or without local radiotherapy remains the mainstay of first-line treatment for the majority of SCLC patients. Despite the high response rate to initial therapy, almost all SCLC patients will invariably relapse in a short time [7]. In recent few years, the addition of atezolizumab or durvalumab to a standard platinum-etoposide backbone have significantly improved the overall survival (OS) and progression-free survival (PFS) of SCLC patients [8,9]. But these advances are relatively modest and the overall prognosis of SCLC is still disappointing.
To better instruct clinical practice in the treatment of SCLC, numerous attempts have been made to investigate the molecular subtypes of SCLC. For example, four major subtypes of SCLC are defined based on the expression of ASCL1, NEUROD1, POU2F3, or YAP1, and some other related subtypes are subsequently derived, which accelerates the research on subtype-specific treatment approaches [10,11]. However, the above classification methods were based on transcriptomics. There remains a wide gap between transcriptomic features and clinical practice. The systematic treatment of SCLC is still consistent irrespective of molecular subtypes.
In recent years, circulating tumor DNA (ctDNA) sequencing technology has maturely developed. It could be used as a supplementary method to monitor tumor burden, improve the accuracy of response assessment, and increase the detection sensitivity of non-measurable or occult metastases [1214], to eventually make up for the deficiencies of current imaging techniques [1517]. The molecular tumor burden index (mTBI) derived from ctDNA sequencing has been confirmed to be feasible for monitoring tumor burden in some cancer types, including advanced gastric cancer [13] and breast cancer [18]. In SCLC, few studies have explored the application of dynamic ctDNA monitoring in clinic. Two studies reported the genomic evolution (n=11) [19] and changes in copy number alterations (n=6) [20] respectively, through the dynamic ctDNA sequencing of SCLC during treatment. But their results were all descriptive and the sample size was very small, indicating that no effective SCLC subtypes were established, and could not be eventually applied to the clinic in a convenient way. Almodovar et al. [21] reported that longitudinal ctDNA analysis (n=25) could identify disease recurrence prior to radiograph, but they utilized mutant allelic frequencies and copy number alterations for monitoring instead of mTBI. Mutations in SCLC are almost entirely concentrated on TP53 and RB1 [22], which means defining subtypes through the baseline tumor mutational landscape seems impossible and meaningless. While, if based on dynamic ctDNA sequencing, the result will be different. To our knowledge, currently, there is no research focusing on the predictive and monitoring value of TP53 and RB1 mutations on the efficacy and prognosis of patients with SCLC.
Here, we performed comprehensive next-generation sequencing on baseline tumor tissue samples and serial ctDNA samples from SCLC patients treated with first-line systematic therapy. We validated the feasibility of monitoring RB1 and/or TP53 mutations dynamically to predict the treatment efficacy, recurrence time (sensitive, refractory and resistant) and survival outcomes. We also demonstrated that mTBI could be used as a surveillance tool for disease progression pattern, such as occurrence of new metastases.

Materials and Methods

1. Patients and samples

A multi-center, single-arm, case series translational research prospectively enrolled patients with histologically confirmed SCLC at three medical centers. All patients received first-line etoposide 100 mg/m2 (days, 1–3) plus cisplatin 75 mg/m2 (days, 1–3) every 3 weeks for 4–6 cycles (drug adjustment, radiotherapy and surgery were allowed on the basis of patients’ condition). Maintenance therapy was optional for patients with stable disease (SD), partial response (PR), or complete response (CR) after first-line treatment until disease progression (PD), unacceptable adverse reactions, or withdrawal from clinical studies. Eligible patients were 18–75 years old regardless of sex; had at least one measurable target lesion at baseline according to Response Evaluation Criteria in Solid Tumors ver. 1.1 (RECIST v 1.1); had an Eastern Cooperative Oncology Group (ECOG) performance status of 0 or 1 (on a 5-point scale, with higher numbers reflecting poorer physical conditions); without receiving previous systemic therapy for SCLC. The disease stage was not limited, but patients were excluded if they had untreated symptomatic central nervous system metastases, or if they had any other uncontrolled serious diseases. The primary endpoint was PFS, as assessed by investigators, among patients in the intention-to-treat population. Key secondary endpoints included OS, the objective response rate (ORR, defined as the total percentage of CR and PR) and disease control rate (DCR, defined as the total percentage of CR, PR and SD) which was evaluated by investigators every two cycles of chemotherapy according to RECIST v1.1. Total tumor size was defined as the sum of longest axial diameters of all measurable lesions (short axial diameters of lymph nodes) via computed tomography (CT) or magnetic resonance imaging (MRI) according to the RECIST v 1.1.
Pre-treatment tumor biopsy specimens (T1) and longitudinal plasma samples (pre-treatment [B1], after two [B2], six [B3] cycles of chemotherapy and at progression [B4]) were collected to perform the tumor-normal matched next-generation sequencing of 1,021 cancer-related genes, which enables the simultaneous detection of single-nucleotide variants (SNVs), small insertions/deletions (InDels), structural variants (SVs), and copy-number variants (CNVs).
This study aimed to investigate the clinical value of ctDNA to predict the efficacy and prognosis and monitor disease during treatment in SCLC patients. All patients provided written informed consent before participation in the study.

2. Targeted capture sequencing

Peripheral blood was collected in Streck tubes and separated by centrifugation at 2,500 ×g for 10 minutes, and then transferred to microcentrifuge tubes and centrifuged at 16,000 ×g for another 10 minutes to remove remaining cell debris. Lymphocytes from the first centrifugation step were used for the extraction of germline genomic DNA. The gDNA of lymphocytes and tissue samples were extracted using the DNeasy Blood & Tissue Kit (Qiagen, Hilden, Germany). Circulating cell-free DNA was isolated using QIAamp Circulating Nucleic Acid Kit (Qiagen). DNA concentration was measured using a Qubit fluorometer (Invitrogen, Carlsbad, CA) and the Qubit dsDNA HS (high sensitivity) Assay Kit (Invitrogen). The size distribution of the cfDNA was assessed using an Agilent 2100 BioAnalyzer and the DNA HS kit (Agilent Technologies, Santa Clara, CA). All the procedures were performed according to the manufacturer’s instructions. Sequencing libraries of both cfDNA and gDNA were constructed with the KAPA DNA Library Preparation Kit (Kapa Biosystems, Wilmington, MA) according to the manufacturer’s protocol. Libraries were hybridized to custom-designed biotinylated oligonucleotide probes (Integrated DNA Technologies, Coralville, IA). Capture probe was designed to cover coding sequencing or hot exons of 1,021 genes frequently mutated in solid tumors, including 14 genes with therapeutic value that recommended by the National Comprehensive Cancer Network (NCCN) guidelines or approved by the Food and Drug Administration (FDA), 220, 98 and 689 genes with therapeutic, diagnostic or prognostic value based on well-powered studies, multiple small studies, and small studies or a few case reports, respectively (S1 Table). DNA sequencing was performed using the HiSeq 3000 Sequencing System (Illumina, San Diego, CA).
Sequencing data were analyzed using default parameters. After removal of terminal adaptor sequences and low-quality data, reads were mapped to the reference human genome (hg19) and aligned using BWA (0.7.12-r1039). SNVs were called using MuTect (ver. 1.1.4) and NChot, a software developed in-house to review hotspot variants. Small insertions and deletions (InDels) were called by GATK. Somatic copy-number alterations were identified with CONTRA (v2.0.8). Copy number variations (CNV) was expressed as the ratio of adjusted depth between ctDNA and germline DNA. SVs were identified with NCsv (in house). Mutations were considered a candidate somatic mutation only when (1) the mutation was detected in at least 5 high-quality reads containing the particular base, (2) the mutation was not present in > 1% of the population in the 1000 Genomes Project (version phase 3) or dbSNP databases (The Single Nucleotide Polymorphism Database, version dbSNP 137), and (3) the mutation was not present in a local database of normal samples. High-quality reads were selected with Phred score ≥ 30, mapping quality ≥ 30, and a lack of paired-end reads bias. For tumor tissue and ctDNA somatic mutations, the mutant must be present in ≥ 1% and 0.5% of reads, respectively. The candidate variants were all manually verified in the Integrative Genomics Viewer. The median values of average effective depth of coverage for tissue samples and ctDNA samples were 841× and 2,670.5×, respectively. S2 Table listed the quality control data. The full lists of all variants including SNVs, Indels and CNVs were provided in S3 Table.

3. Clonal population structure and molecular tumor burden analysis

PyClone, a statistical model based on a Bayesian clustering method [23], was used to analyze the clonal population structures in cancers. Briefly, PyClone uses the measurement of allelic frequency to estimate the proportion of tumor cells harboring a mutation (cellular prevalence). Mutations from one or more samples derived from the same patient and allele-specific copy number at each mutation locus in each sample were input into this model. It outputs the cellular prevalence for each mutation in the input and the putative clustering structure. We calculated the average cellular prevalence for each cluster and considered the cluster with highest average cellular prevalence as the trunk cluster. The mTBI was calculated using the mean allele fraction of mutations in the trunk cluster at each time point. mTBI is a reflection of the percentage of ctDNA and its changes can reflect the change of tumor burden at the molecular level in our previous studies [13,24].

4. Statistical analyses

Survival was calculated by Kaplan-Meier method and compared using the Mantel-Cox log-rank test. Chi-square test was used to investigate the impact of baseline characteristics on response rate. Univariate and multivariate Cox regression was used to analyze the impact of baseline characteristics on survival. Fisher’s exact test was used to explore the dynamic changes of TP53 and RB1 mutations at each time point (from B1 to B4). The relationship between mTBI and stage at initial diagnosis was statistically analyzed using student t test. IBM SPSS software ver. 22.0 (IBM Corp., Armonk, NY) and GraphPad Prism ver. 8.0 (GraphPad Software Inc., San Diego, CA) were used in statistical analysis. A two-sided p-value of < 0.05 was considered as significant.

Results

1. Patient characteristics

From November 2018 to September 2020, a total of 38 SCLC patients were enrolled in this study (S4 Fig.). Three patients were excluded (one without baseline peripheral blood sample, and two withdrawal of informed consent), leaving 35 SCLC patients in the final analysis. Table 1 summarized the patient characteristics. The median age at initial diagnosis was 61 years (range, 43 to 69 years). Most patients were males (n=25, 71.4%) and former smokers (n=27, 77.1%). There were relatively more limited-stage (n=24, 68.6%) than extensive-stage (n=11, 31.4%) patients. As of the data cutoff date of May 10, 2021, the median follow-up was 19.5 months (range, 2.8 to 29.8 months). The ORR and DCR were 80% (28/35) and 97.1% (34/35), respectively. The median PFS (mPFS) was 9.8 months (95% confidence interval [CI], 6.2 to 13.4), and the median OS (mOS) was 22.2 months (95% CI, 16.1 to 28.3) (S5 Fig.). Detailed outcome data was illustrated in S6 Table.
As shown in S4 Fig., pre-treatment tumor tissues (T1) and ctDNA samples (B1) were collected from 30 and 35 patients, respectively. Five patients failed to provide efficiently matched tumor tissue samples, 61 ctDNA samples (B2, B3, and B4) during and after first-line treatment were collected from 31 patients. A total of 1,107 somatic variants were identified, including 917 SNVs, 161 Indels and 29 CNVs. The number of mutations detected in T1 samples ranged 1–29 with a median of 11.5, and 1–30 with a median of 12 for B1 samples. Eleven patients had no mutation detected in B2 (8/30) or B3 (3/17) samples. The median number of mutations detected in B2, B3 and B4 were 2 (range, 0 to 16), 2 (range, 0 to 19) and 10.5 (range, 1 to 20), respectively.

2. Concordance verification of mutational profiling between tumor tissue and ctDNA

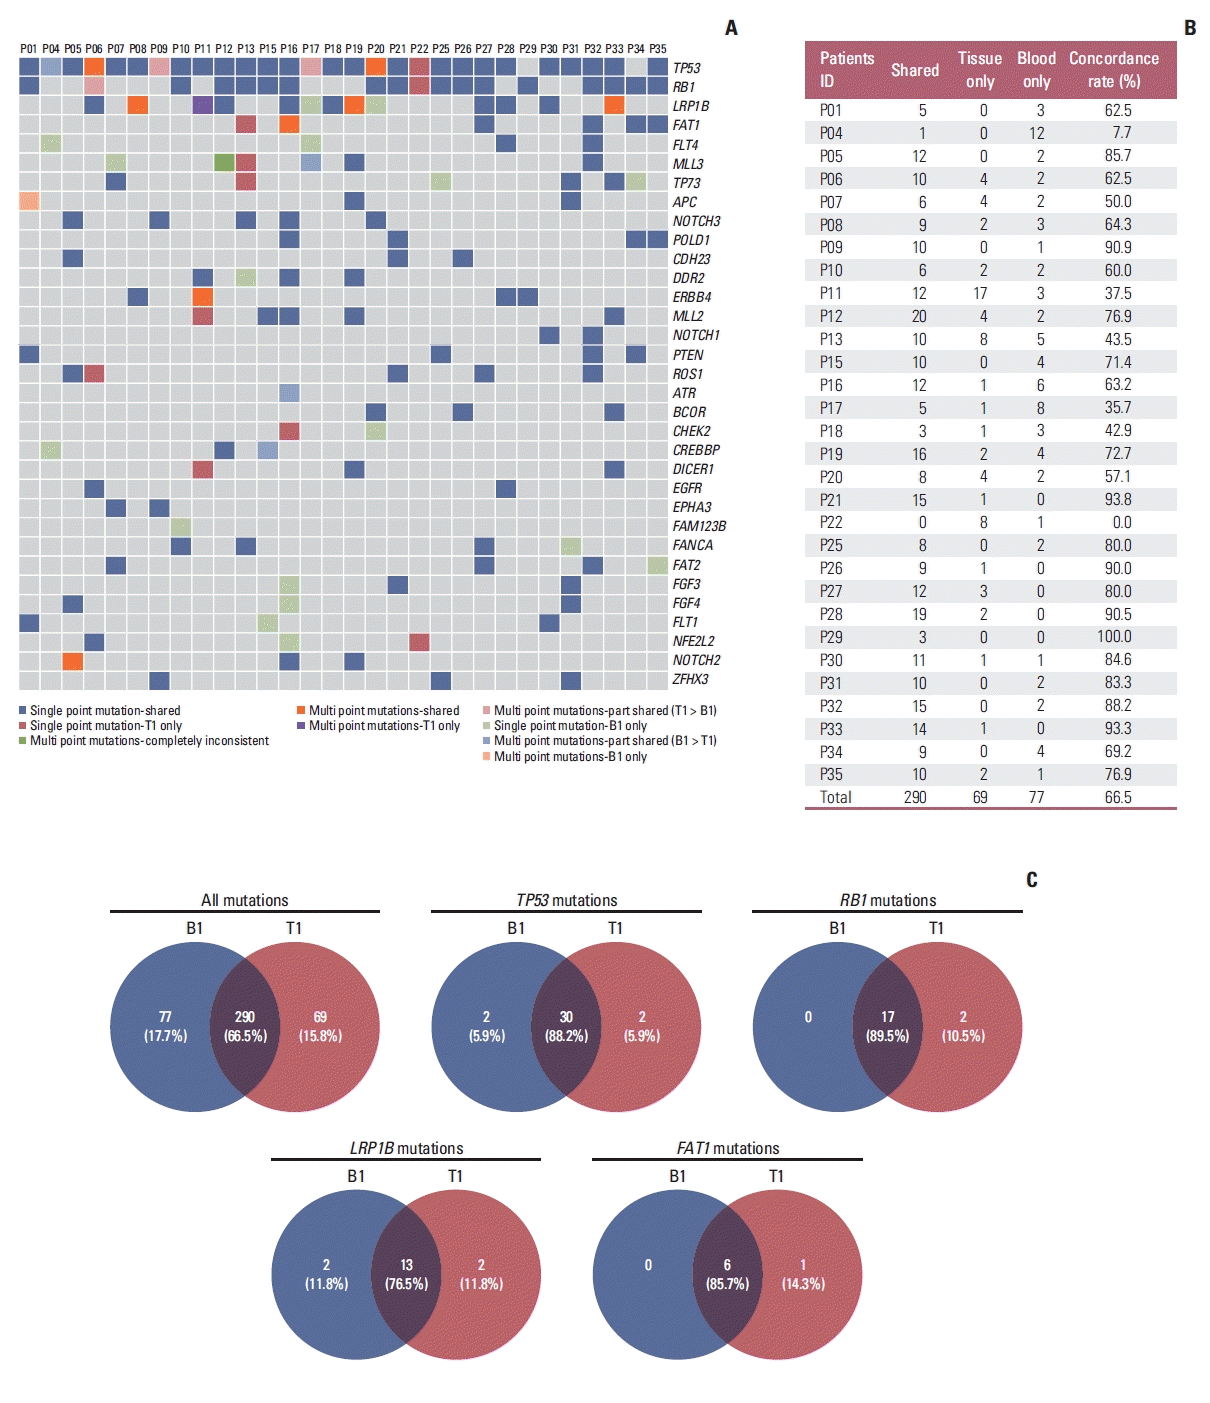
Previous study has demonstrated that a high rate of mutations (median, 94%) detected in tissue samples were also detected in matched ctDNA samples, which however remains to be further verified due to the very limited sample size (n=8) [19]. In our cohort, the concordance between tissue and ctDNA was assessed in 30 patients with matched T1 and B1 samples. The mutational profiles of T1 and B1 samples were shown in Fig. 1A. Overall, the median concordance rate of all detected somatic mutations between T1 and B1 was 72.05% (range, 0% to 100%) (Fig. 1B). A median 90% of mutations detected in T1 samples were also found in B1 samples. The numbers of shared, tissue-only and blood-only mutations were 290, 69, and 77, respectively, resulting in an overall concordance rate of 66.5% for all mutations (Fig. 1B and C). The concordance rates were higher in frequently mutated genes (mutation frequency ≥ 20%), such as TP53 (88.2%), RB1 (89.5%), LRP1B (76.5%), and FAT1 (85.7%) (Fig. 1C). These results enhanced the conclusion that ctDNA samples can be used to assess the mutational profiles in patients with SCLC, especially for the common mutations. We further described the mutational characteristics of 35 ctDNA samples at B1 (S7 Fig.). At least one nonsynonymous somatic mutation was detected in each sample. A total of 454 somatic variants were identified with a median of 12 mutations per sample (range, 1 to 30), including 385 somatic SNVs (84.8%), 57 Indels (12.6%), and 12 CNVs (2.6%). Among them, missense mutation was the most common mutation type (n=323, 71.1%), with TP53, RB1, LRP1B, and FAT1 being the most frequently mutated genes.

3. Early dynamic changes of ctDNA-based TP53 or RB1 mutation associated with efficacy to first-line therapy

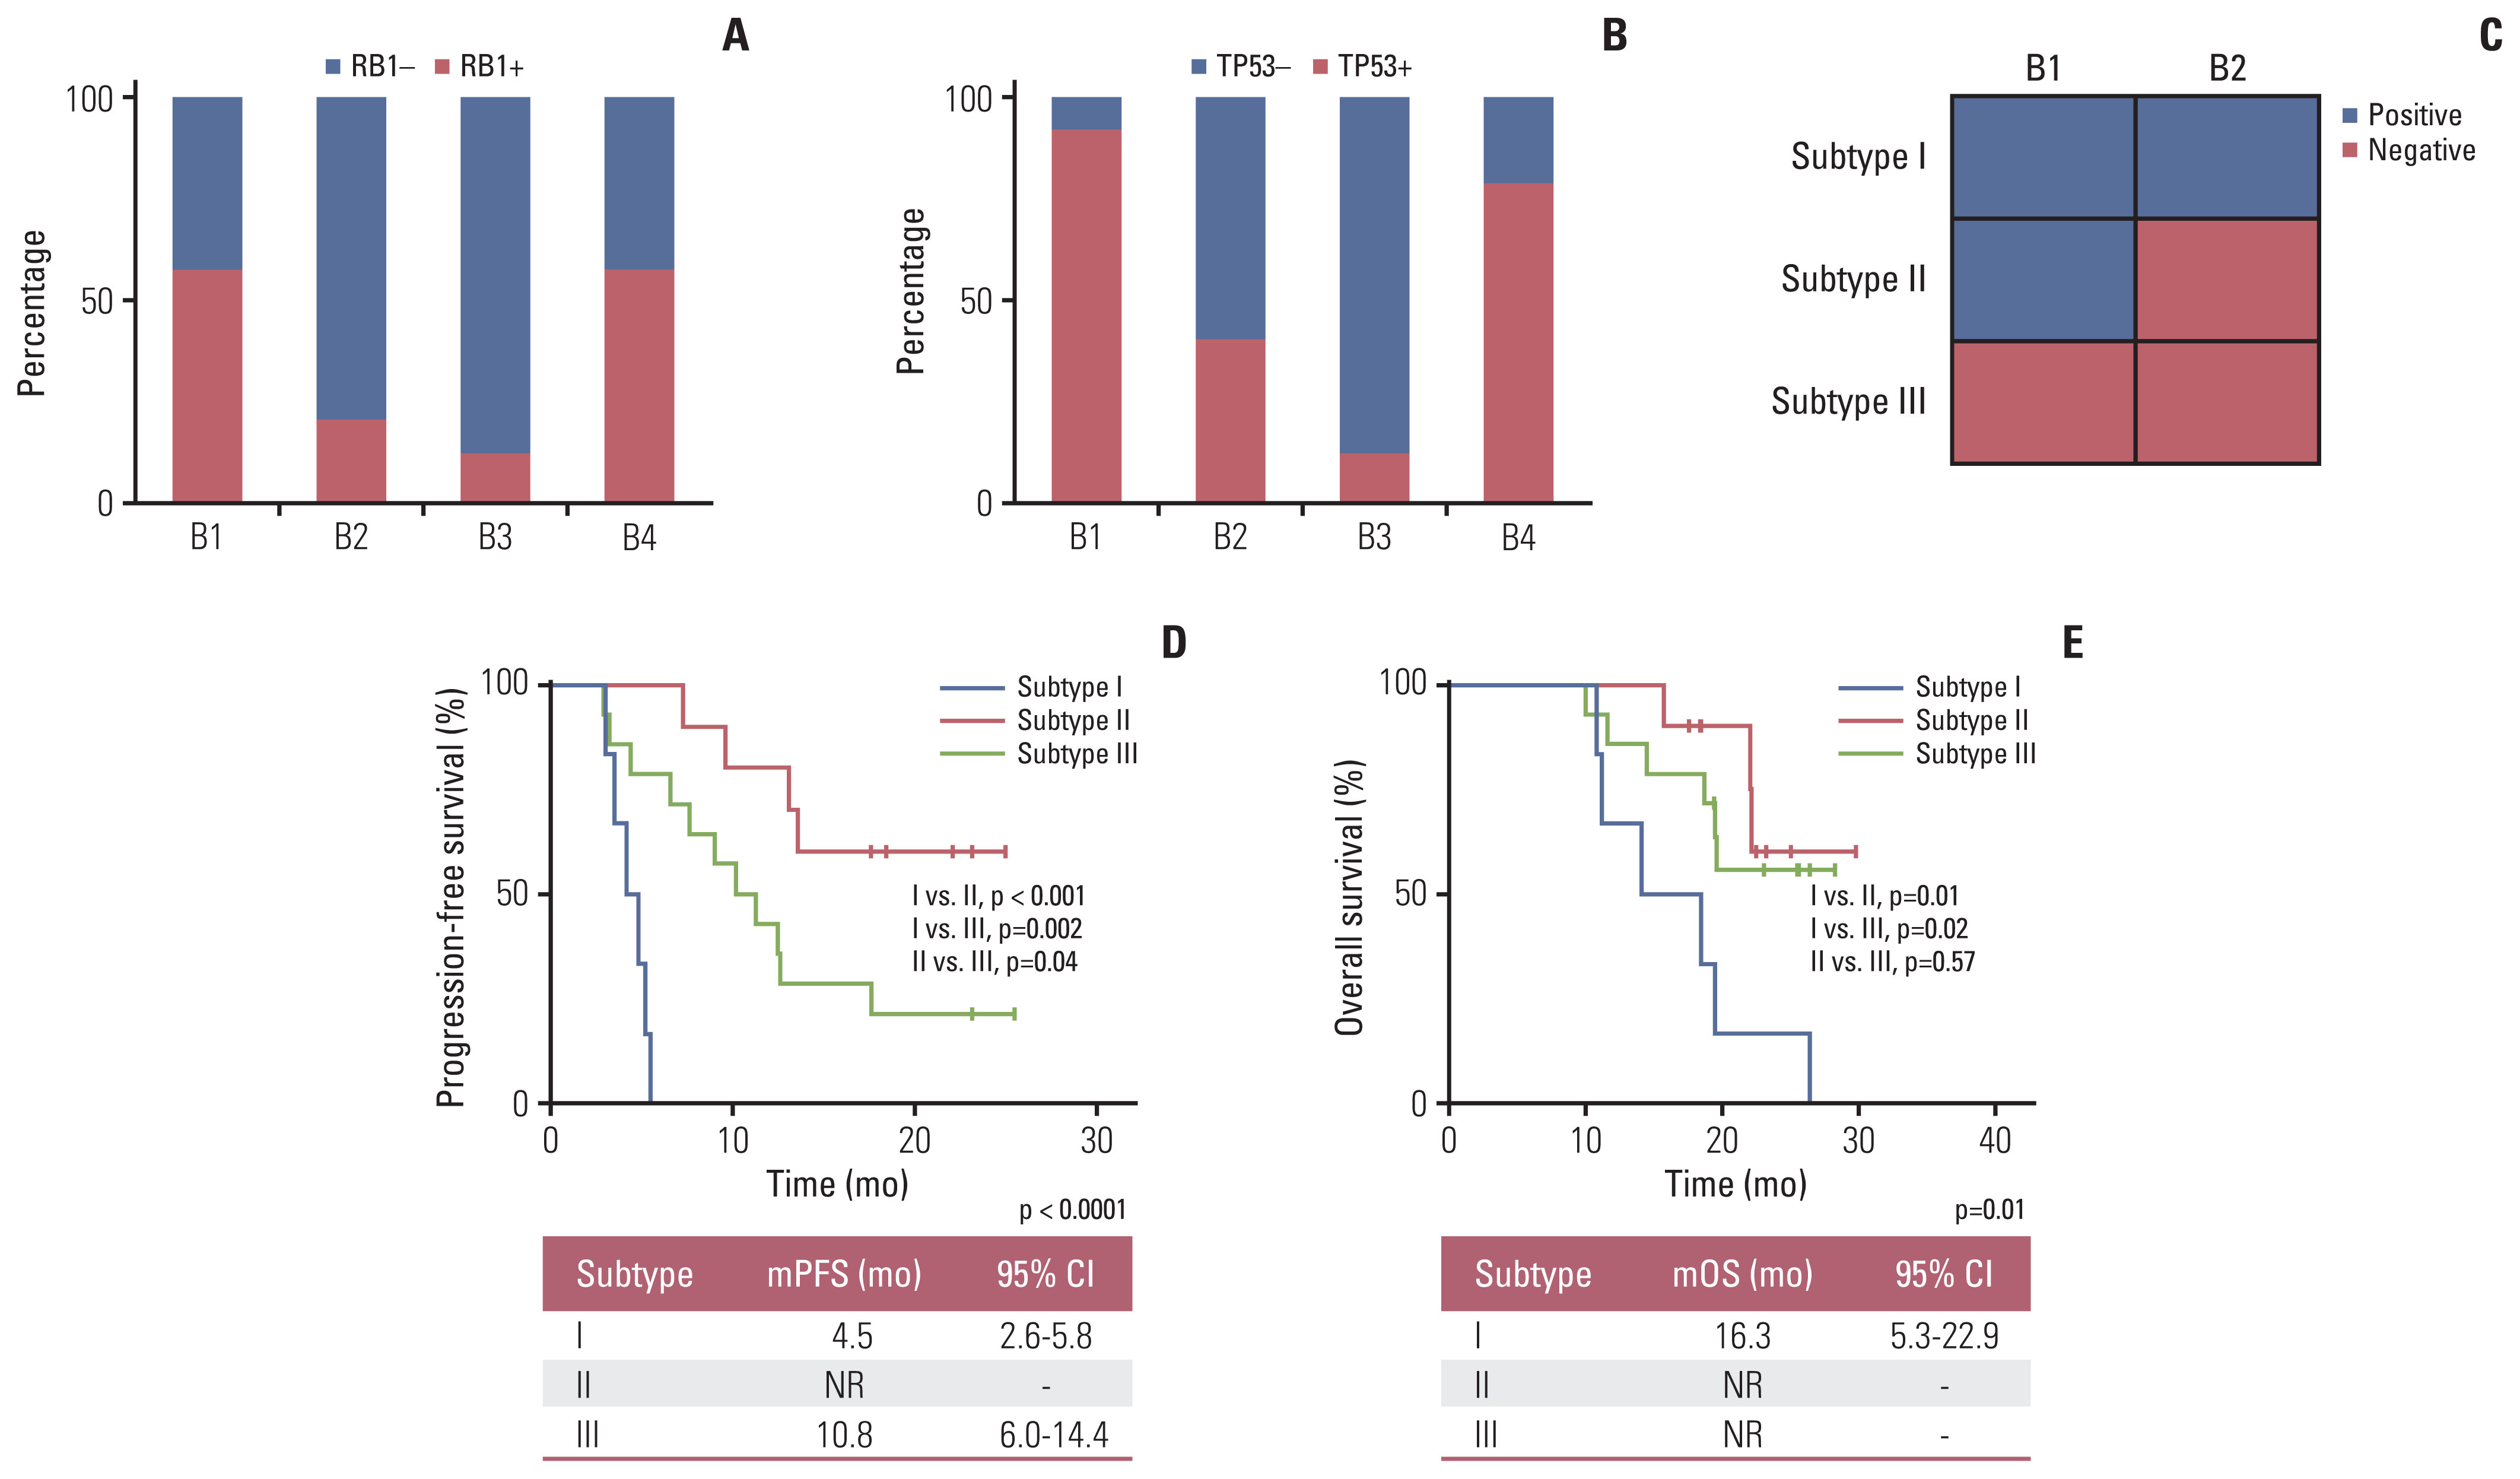
We first analyzed the impact of baseline characteristics including age, sex, disease stage, smoking status, and status of frequent gene mutations, on the efficacy of first-line chemotherapy, in which no factor was found associated with ORR or PFS (S8 Table). SCLC patients older than 60 years or with FAT1 mutation at B1 were associated with shorter OS (p < 0.05) (S8 Table). Next, the dynamic changes of common gene mutations were analyzed. Generally, TP53 and RB1 mutations, as the two main mutant genes, were identified in 91.4% (32/35) and 57.1% (20/35) of ctDNA from B1 samples, respectively. Drastically reduction of positive detection rates was seen at B2 and B3 as compared to B1, while increase was seen at B4 as compared to B2 and B3, whether for TP53 (B1, 91.4%; B2, 40.0%; B3, 35.3%; B4, 78.6%) or RB1 (B1, 57.1%; B2, 20.0%; B3, 11.8%; B4, 57.1%) (Fig. 2A and B, S9 and S10 Tables).
We then divided the patients into three subtypes according to the dynamic changes of somatic mutation of RB1 or TP53 from B1 to B2 (n=30) (Fig. 2C): subtype I, TP53 or RB1 mutation was detected in both B1 and B2; subtype II, TP53 or RB1 mutation was detected in B1 but disappeared in B2; subtype III, TP53 or RB1 mutation was neither detected in B1 nor B2. For patients harboring RB1 mutation, the mPFS (Fig. 2D) of subtype I patients (n=6) was 4.5 months (95% CI, 2.6 to 5.8), which was significantly worse than that for subtype II (n=10, mPFS: not reached [NR], log-rank p < 0.001) and subtype III (n=14; mPFS, 10.8 months; 95% CI, 6.0 to 14.4, log-rank p=0.002), respectively. A significantly prolonged mPFS was also seen in subtype II than that in subtype III (log-rank p=0.04). The median OS (mOS) (Fig. 2E) of subtype I patients (n=6) was 16.3 months (95% CI, 5.3 to 22.9), which was significantly worse than that for subtype II (n=10; mOS, NR; log-rank p=0.01) and subtype III (n=14; mOS, NR; log-rank p=0.02), respectively. For TP53 mutation (S11 Fig.), the mPFS and mOS showed no significant difference (log-rank p > 0.05) among subtype I, subtype II, and subtype III.
To further confirm the predictive availability of the dynamic changes of somatic RB1 or TP53 mutation in SCLC, we then grouped these 30 patients into subtype I or subtype II/III by tumor response and recurrence patterns. The gold standard was set as PR or sensitive recurrence pattern for subtype II and III patients; SD or refractory and resistant recurrence patterns for subtype I patients. The subtype classification based on the single gene of RB1 performed better than TP53 except for the value of predictive specificity, regardless of tumor response or recurrence patterns (Table 2).

4. Longitudinal monitoring of disease status using ctDNA-based mTBI

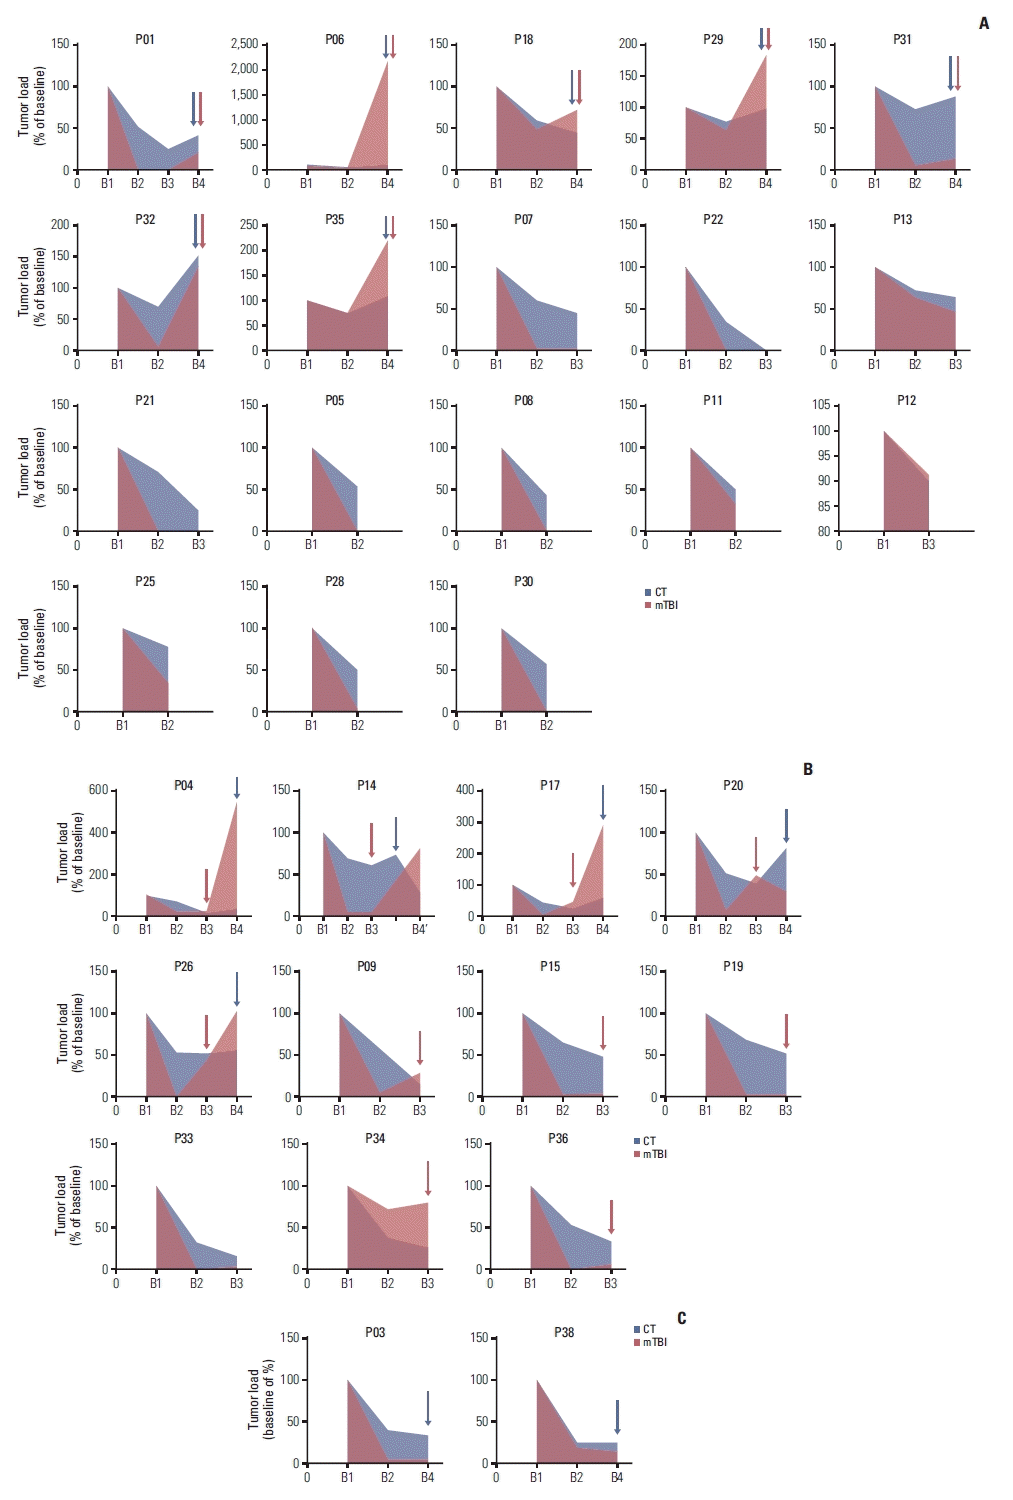
We first analyzed the association between dynamic change of variant allele frequency (VAF) of RB1 and tumor response (S12 Fig.), the results showed that RB1 VAF could reflect the change of tumor burden to a certain extent, especially for the time points of B1 and B2, with a concordance rate of 100%. However, not every patient harbored RB1 mutation in pre-treatment sample, mTBI as an indicator of main clone cluster could reflect the overall tumor burden by considering all somatic mutations instead of one specific mutation. We then compared the change degree of mTBI with tumor size evaluated by imaging (Fig. 3), another index commonly used to evaluate tumor burden (see material and methods) at B2–B4 time points relative to the baseline (normalized to 100%). The detailed results were supplied in S13 Table. To the cut-off date, the degree of mTBI in P14 and P26 showed earlier elevation at B3 than RB1 VAF, and predicted imaging disease progression in advance, suggesting the superiority of mTBI compared with RB1 VAF (Fig. 3, S12 Fig.).
Patients with matched B1 and B2 ctDNA samples (n=30) presented decreased mTBI at B2, same trend was seen for tumor sizes (Fig. 3A–C). Patients with an mTBI dropped to zero at B2 (n=8, 26.7%) had a significantly prolonged mOS (NR vs. 19.5 months, p=0.01), and a tendency prolonged mPFS (18.4 months vs. 8.3 months, p=0.08) compared with the remaining 22 patients (S14 Fig.). Earlier mTBI elevation at B3 was observed in 11 patients (11/17, 64.7%) (Fig. 3B), in which five patients had developed disease progression, with a 92 days (range, 31 to 235 days) median interval time between mTBI elevation and imaging progression.
We then analyzed the mPFS and OS of the 11 patients with earlier mTBI elevation at B3 before PD based on whether chose maintenance treatment (n=6) or not (n=5) after first-line therapy, and no difference was observed (log rank p > 0.05) (S15 Fig.). Inconsistent with the imaging findings, three patients (3/14, 21.4%) of P03 (Fig. 3C), P20 (Fig. 3B), and P38 (Fig. 3C) showed declining mTBI values at the time of disease progression (B4), while patients P03 and P20 showed reappearance of RB1 and/or TP53 mutations at B4 simultaneously (S3 Table).

5. mTBI is associated with distant metastasis

We first explored the potential relationship of mTBI and distant metastases at initial diagnosis. The median value of mTBI in 11 patients with distant metastasis (IVA or IVB) at diagnosis was significantly higher than that of the remaining 24 patients (40.18 vs. 15.8, p=0.03) (S16A Fig.). The receiver operating characteristic analysis of mTBI values from all 35 patients showed the area under the curve was 0.74 (95% CI, 0.55 to 0.92; p=0.03), with an optimal cutoff value of 35.2, exhibiting a sensitivity of 63.6% and specificity of 83.3% to indicate the existence of distant metastases at baseline (B1) (S16B Fig.).
Furthermore, we explored the relationship between dynamic changes of mTBI (B4 compared with B1) and new metastases at progression (defined as new tumor lesions during or after treatment). A total of 14 patients with B1 and B4 ctDNA samples were divided into two subgroups (subgroup A, patients with increased mTBI values at B4 than B1; subgroup B, patients with decreased mTBI values at B4 than B1). Seven patients (n=7, 100%) in subgroup A (Fig. 3A: P06, P29, P32, P35; Fig. 3B: P04, P17, P26) and 1 patient (n=7, 14.3%) in subgroup B (Fig. 3C: P38) were found with new metastases at the time of PD. The sensitivity and specificity of mTBI (subgroup A vs. B) indicating new metastases were 100% and 85.7% (95% CI, 50.8 to 120.7), respectively (Table 2). The results indicated that (B4-B1) mTBI monitoring might be reliable to identity new metastases.
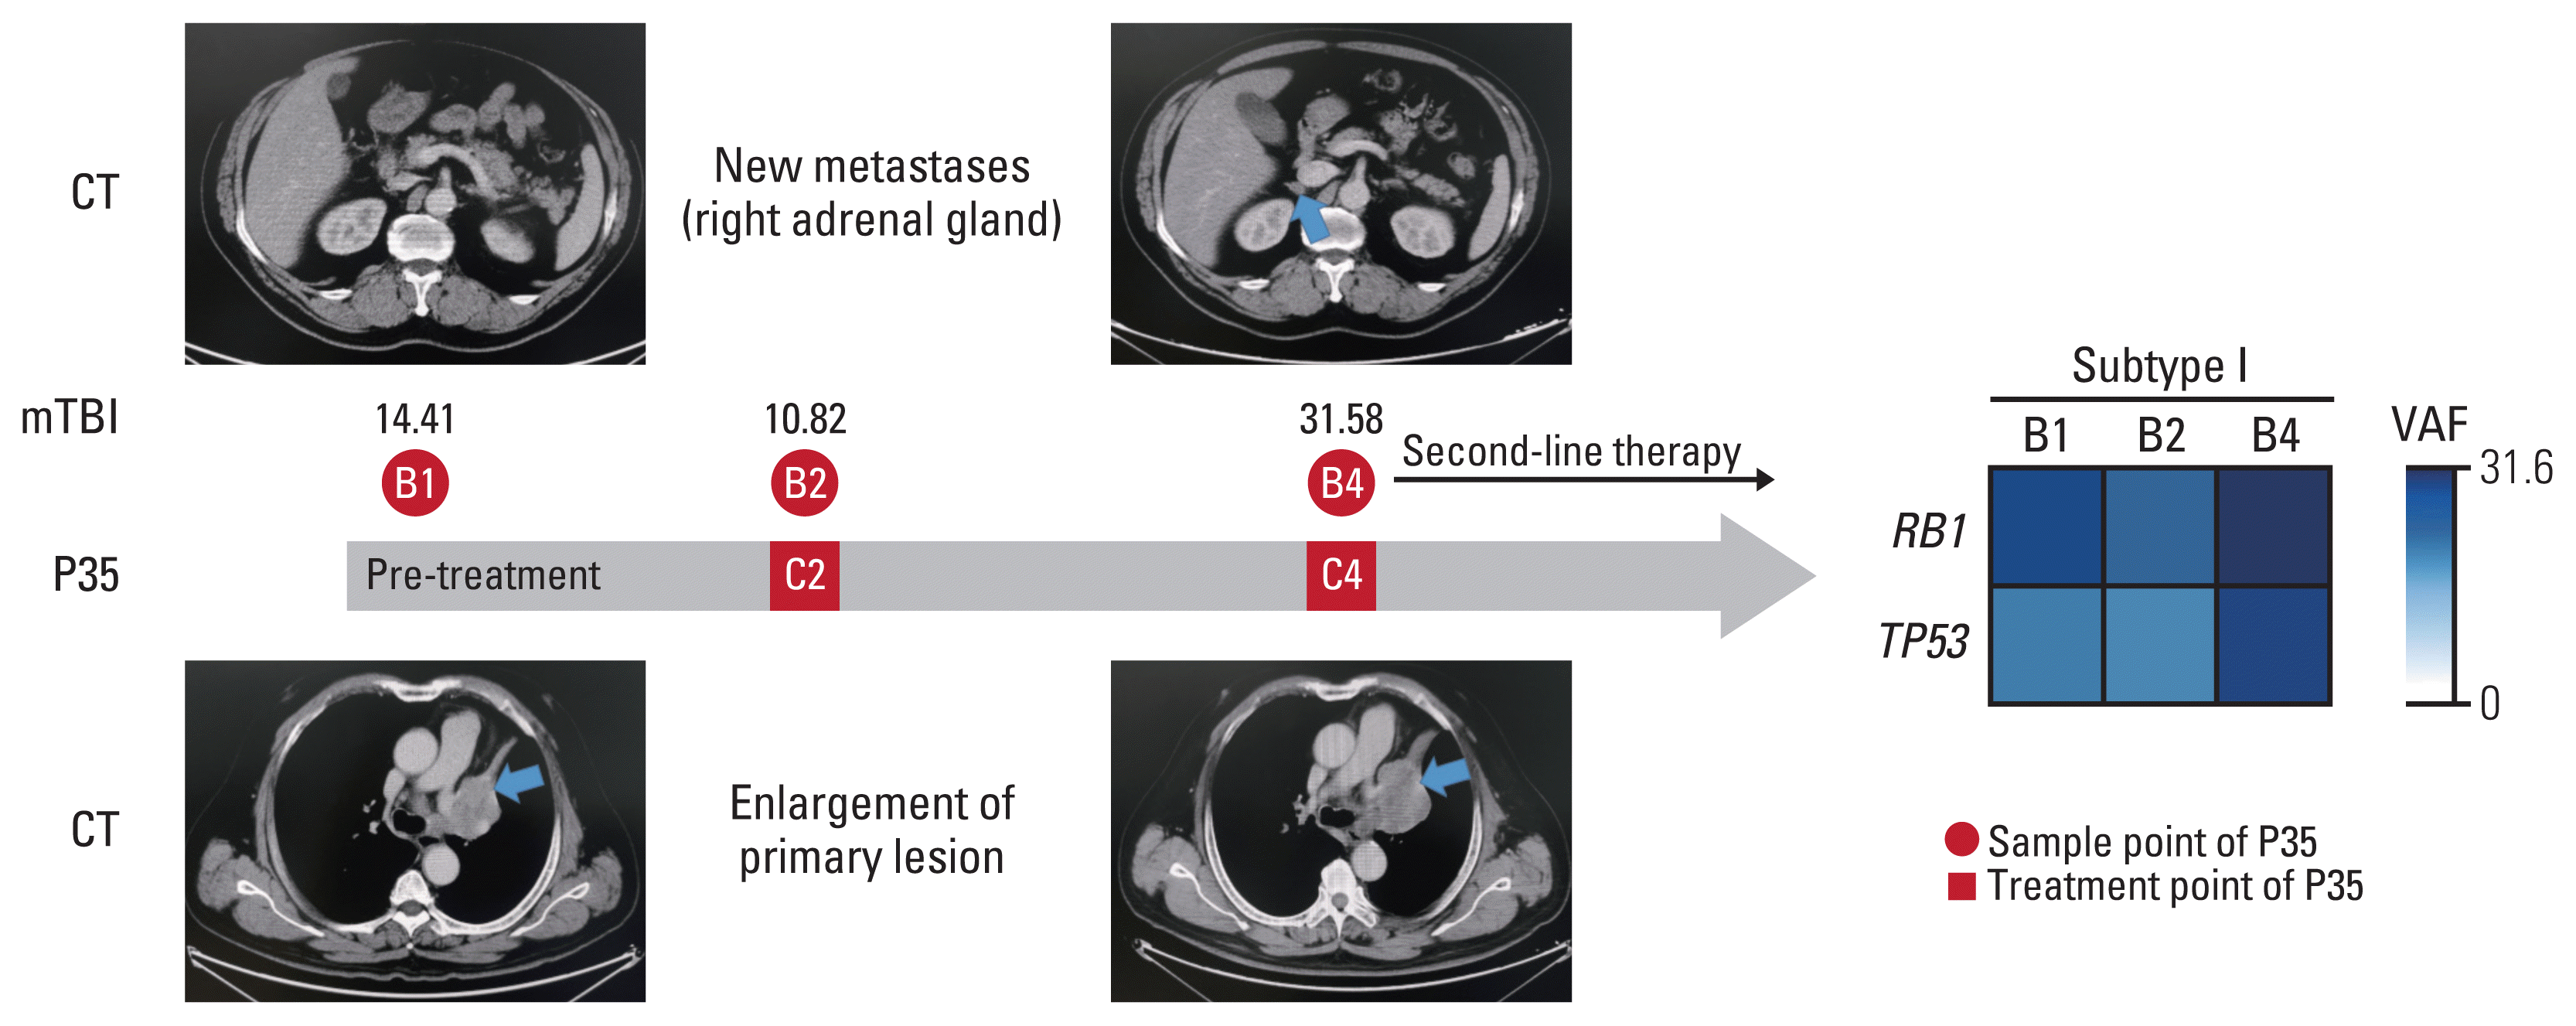
One interesting case in subgroup A caught our attention (Fig. 4). This case (P35) was a 61-year-old male with SCLC, who underwent four cycles of chemotherapy (etoposide plus cisplatin), mTBI at B4 time point showed a 2.19-fold increase compared to B1 (31.58 vs. 14.41), meanwhile CT imaging showed new metastases on right adrenal gland and enlargement of primary lesion.

Discussion

This study provided clinical and genetic evidences for non-invasively tumor monitoring during treatment, revealing that early dynamic changes of ctDNA-based RB1 mutation and mTBI had the potential for the prediction or evaluation of tumor response, recurrence patterns (sensitive, refractory and resistant), and survival outcomes of first-line therapy.
Due to the limited number of operable patients [5,6], the unavailability of tissue samples in clinical practice remains one of the big challenges in the genomic researches of SCLC. Actually, the development of ctDNA sequencing technology has accelerated the development of genomic study of cancers to a large extent [21,25,26], including breast, gastric, pancreatic, lung, and colorectal cancer. Previous studies have demonstrated that ctDNA can be a reliable approach to profile baseline genetic mutations and to monitor disease progression longitudinally [19,26]. In our study, a median of 72.05% of mutations were both detected in paired tumor tissue and plasma samples, which was similar to the data in another study [19]. The concordance rate increased obviously when focusing on mutations in frequently mutated genes, such as TP53, RB1, LRP1B, and FAT1. These results laid the foundation for the subsequent ctDNA analysis.
In SCLC patients, identification of prognostic indicators through baseline genomic profiling is always challenging. Attempts to find predictors of treatment efficacy and prognosis using ctDNA samples at baseline (B1) in this study were not so satisfactory. We further focused on longitudinal molecular changes to distinguish SCLC patients with different prognosis. We creatively designed an easily performed method to classify SCLC patients, which could early predict tumor response, recurrence pattern, and survival time by using dynamic changes of ctDNA based RB1 mutation, naming as subtype I, subtype II and subtype III. SCLC patients labeled as subtype I tended to be associated with poorer prognosis than other subtypes. Moreover, RB1 mutation showed better accuracy for predictivity than TP53. SCLC patients with RB1 mutation detected at both B1 and B2 had a low response rate to chemotherapy and high rate of progression. To our knowledge, this is the first study to predict the prognosis of SCLC patients by a single gene [27], although similar results had been showed in non-SCLC patients, in which early ‘disappearance’ of a single gene EGFR (epidermal growth factor receptor) in ctDNA sequencing during EGFR tyrosine kinase inhibitors therapy was associated with better clinical prognosis [28]. These results indicated that SCLC patients with RB1 mutation persistently detected might need more aggressive treatment on the basis of standard chemotherapy or receive maintenance therapy after first-line treatment, to improve their prognosis. In addition, RB1 mutation monitoring during the early treatment may be incorporated into the design of future clinical trials.
Levels of ctDNA in plasma correlate with tumor burden had been exhibited in plenty of studies through different perspectives [13,14,18-20]. In our SCLC cohort, mTBI levels were also associated with tumor burden and declined along with the reduction of tumor burden after two cycles of chemotherapy. But at B3, 64.7% SCLC patients showed earlier mTBI elevation before radiographic progression, which indicated earlier disease progression. In routine clinical practice, disease progression can only be detected when significant tumor enlargement or new lesions were found. Once these happened, disease would become extremely difficult to control. Therefore, consolidating current treatment or starting subsequent therapy instantly may provide better choices for patients with earlier elevated mTBI. However, our preliminary exploration found no significant prolonged PFS for SCLC patients with earlier elevated mTBI at B3 who received maintenance therapy. Possible explanations included the small number of patients and confounding factors caused by too many maintenance therapies.
Due to the potential damage induced by imaging examinations and economic reasons, brain MRI would not be performed at every follow-up visit for patients without brain metastases at initial diagnosis in China. In addition, lesions less than 10 mm are difficult to identify by radiographic imaging, which is of vital importance for therapeutic response assessment [16], especially for confirming disease progression. In our study, we monitored the changes of mTBI values at B1 and B4 to detect new metastases. Surprisingly, increased mTBI value at PD compared to baseline was a strong indicator for emergence of new metastases, with the predictive sensitivity and specificity of 100% and 85.7%, respectively. These results suggested that additional testing and examinations, including positron emission tomography–computed tomography and radionuclide bone scan, should be considered for patients with increased mTBI and negative findings from routine examinations.
Our study showed a limitation that we enrolled both limited and extensive stage of SCLC patients simultaneously, and the limited stage occupied with a higher percentage of 68.6%. This selective bias might lead to the incomplete reflection of the real-world data of SCLC, and different treatment modalities between them might produce some potential bias of outcomes, which couldn’t be completely avoided. However, we had explored the effect of tumor staging on tumor efficacy, neither the ORR, mPFS, nor the mOS was associated with the tumor stage based on the Veterans Administration Lung Study Group (VALG) staging scheme in our cohort (p > 0.05). More importantly, the aim of our study is to investigate the biomarkers based on dynamic ctDNA sequencing, SCLC patients were all detected ctDNA in pre-treatment peripheral blood samples, irrespective of the limited or extensive stage, which could also reduce the impact of staging bias. Another limitation of our study was the small sample size, but the number of SCLC patients who were monitored using serial ctDNA sequencing in our cohort was still more than other similar studies [1921]. For each patient, we had more fixed and more intensive ctDNA collection points (pre-treatment [B1], after two [B2], six [B3] cycles of chemotherapy, and at progression [B4]), which were the basis of our results and noticeable advantage of our study. Despite the above limitations, our study’s findings may still be deemed as meaningful due to the positive results have great enlightening significance for future studies.
In conclusion, serial ctDNA sequencing provided a clinically reliable and feasible approach to explore biomarkers to predict the treatment efficacy, recurrence patterns (sensitive, refractory and resistant) and survival outcomes of first-line therapy in patients with SCLC, especially the dynamic changes of RB1 mutation and mTBI values, which we believe would help to establish individualized strategy to guide the clinical treatment and trial design for SCLC patients in the future.

Notes

Ethical Statement

All procedures were conducted in accordance with the Declaration of Helsinki. This study was approved by the ethics committee of National Cancer Center/Cancer Hospital, Chinese Academy of Medical Sciences and Peking Union Medical College (Beijing, China; approved No. 18-151/1729). This study was registered at the Chinese Clinical Trial Registry as ChiCTR1900023956.

Author Contributions

Conceived and designed the analysis: Feng Y, Liu Y, Yuan M, Wang Z, Hu X.

Collected the data: Feng Y, Liu Y, Yuan M, Dong G, Zhang H, Zhang T, Zhu H, Xing P, Wang H, Shi Y, Hu X.

Contributed data or analysis tools: Feng Y, Liu Y, Yuan M, Wang Z, Hu X.

Performed the analysis: Feng Y, Liu Y, Yuan M, Chang L, Xia X, Li L, Wang Z, Hu X.

Wrote the paper: Feng Y, Liu Y, Wang Z, Hu X.

Conflicts of Interest

Conflict of interest relevant to this article was not reported.

ACKNOWLEDGMENTS

The authors thank the patients who participated in the study, the staff members at the study sites, and the staff members who were involved in data collection and analyses. This study was supported by the National Key Research and Development Project (2019YFC1315704), CAMS Innovation Fund for Medical Sciences (2017-I2M-1-005), the National Natural Sciences Foundation (81871889, 82072586) and Beijing Natural Science Foundation (7212084).

References

1. Sung H, Ferlay J, Siegel RL, Laversanne M, Soerjomataram I, Jemal A, et al. Global cancer statistics 2020: GLOBOCAN estimates of incidence and mortality worldwide for 36 cancers in 185 countries. CA Cancer J Clin. 2021; 71:209–49.
crossref
2. Govindan R, Page N, Morgensztern D, Read W, Tierney R, Vlahiotis A, et al. Changing epidemiology of small-cell lung cancer in the United States over the last 30 years: analysis of the surveillance, epidemiologic, and end results database. J Clin Oncol. 2006; 24:4539–44.
crossref
3. Elias AD. Small cell lung cancer: state-of-the-art therapy in 1996. Chest. 1997; 112(4 Suppl):251S–8S.
4. Byers LA, Rudin CM. Small cell lung cancer: where do we go from here? Cancer. 2015; 121:664–72.
crossref
5. Lad T, Piantadosi S, Thomas P, Payne D, Ruckdeschel J, Giaccone G. A prospective randomized trial to determine the benefit of surgical resection of residual disease following response of small cell lung cancer to combination chemotherapy. Chest. 1994; 106(6 Suppl):320S–3S.
crossref
6. Yang CJ, Chan DY, Shah SA, Yerokun BA, Wang XF, D’Amico TA, et al. Long-term survival after surgery compared with concurrent chemoradiation for node-negative small cell lung cancer. Ann Surg. 2018; 268:1105–12.
crossref
7. Tjong MC, Mak DY, Shahi J, Li GJ, Chen H, Louie AV. Current management and progress in radiotherapy for small cell lung cancer. Front Oncol. 2020; 10:1146.
crossref
8. Horn L, Mansfield AS, Szczesna A, Havel L, Krzakowski M, Hochmair MJ, et al. First-line atezolizumab plus chemotherapy in extensive-stage small-cell lung cancer. N Engl J Med. 2018; 379:2220–9.
crossref
9. Paz-Ares L, Dvorkin M, Chen Y, Reinmuth N, Hotta K, Trukhin D, et al. Durvalumab plus platinum-etoposide versus platinum-etoposide in first-line treatment of extensive-stage small-cell lung cancer (CASPIAN): a randomised, controlled, open-label, phase 3 trial. Lancet. 2019; 394:1929–39.
10. Ireland AS, Micinski AM, Kastner DW, Guo B, Wait SJ, Spain-hower KB, et al. MYC drives temporal evolution of small cell lung cancer subtypes by reprogramming neuroendocrine fate. Cancer Cell. 2020; 38:60–78.
crossref
11. Rudin CM, Poirier JT, Byers LA, Dive C, Dowlati A, George J, et al. Molecular subtypes of small cell lung cancer: a synthesis of human and mouse model data. Nat Rev Cancer. 2019; 19:289–97.
crossref
12. Yi X, Ma J, Guan Y, Chen R, Yang L, Xia X. The feasibility of using mutation detection in ctDNA to assess tumor dynamics. Int J Cancer. 2017; 140:2642–7.
crossref
13. Wang Y, Zhao C, Chang L, Jia R, Liu R, Zhang Y, et al. Circulating tumor DNA analyses predict progressive disease and indicate trastuzumab-resistant mechanism in advanced gastric cancer. EBioMedicine. 2019; 43:261–9.
crossref
14. Siravegna G, Marsoni S, Siena S, Bardelli A. Integrating liquid biopsies into the management of cancer. Nat Rev Clin Oncol. 2017; 14:531–48.
crossref
15. Gerwing M, Herrmann K, Helfen A, Schliemann C, Berdel WE, Eisenblatter M, et al. The beginning of the end for conventional RECIST: novel therapies require novel imaging approaches. Nat Rev Clin Oncol. 2019; 16:442–58.
crossref
16. Yu Q, Huang S, Wu Z, Zheng J, Chen X, Nie L. Label-free visualization of early cancer hepatic micrometastasis and intra-operative image-guided surgery by photoacoustic imaging. J Nucl Med. 2020; 61:1079–85.
crossref
17. Zhou L, Zhang M, Li R, Xue J, Lu Y. Pseudoprogression and hyperprogression in lung cancer: a comprehensive review of literature. J Cancer Res Clin Oncol. 2020; 146:3269–79.
crossref
18. Ma F, Guan Y, Yi Z, Chang L, Li Q, Chen S, et al. Assessing tumor heterogeneity using ctDNA to predict and monitor therapeutic response in metastatic breast cancer. Int J Cancer. 2020; 146:1359–68.
crossref
19. Nong J, Gong Y, Guan Y, Yi X, Yi Y, Chang L, et al. Circulating tumor DNA analysis depicts subclonal architecture and genomic evolution of small cell lung cancer. Nat Commun. 2018; 9:3114.
crossref
20. Mohan S, Foy V, Ayub M, Leong HS, Schofield P, Sahoo S, et al. Profiling of circulating free DNA using targeted and genome-wide sequencing in patients with SCLC. J Thorac Oncol. 2020; 15:216–30.
crossref
21. Almodovar K, Iams WT, Meador CB, Zhao Z, York S, Horn L, et al. Longitudinal cell-free DNA analysis in patients with small cell lung cancer reveals dynamic insights into treatment efficacy and disease relapse. J Thorac Oncol. 2018; 13:112–23.
crossref
22. George J, Lim JS, Jang SJ, Cun Y, Ozretic L, Kong G, et al. Comprehensive genomic profiles of small cell lung cancer. Nature. 2015; 524:47–53.
23. Roth A, Khattra J, Yap D, Wan A, Laks E, Biele J, et al. PyClone: statistical inference of clonal population structure in cancer. Nat Methods. 2014; 11:396–8.
crossref
24. Yi Z, Ma F, Rong G, Liu B, Guan Y, Li J, et al. The molecular tumor burden index as a response evaluation criterion in breast cancer. Signal Transduct Target Ther. 2021; 6:251.
crossref
25. Dawson SJ, Tsui DW, Murtaza M, Biggs H, Rueda OM, Chin SF, et al. Analysis of circulating tumor DNA to monitor meta-static breast cancer. N Engl J Med. 2013; 368:1199–209.
crossref
26. Babayan A, Pantel K. Advances in liquid biopsy approaches for early detection and monitoring of cancer. Genome Med. 2018; 10:21.
crossref
27. Rudin CM, Brambilla E, Faivre-Finn C, Sage J. Small-cell lung cancer. Nat Rev Dis Primers. 2021; 7:3.
crossref
28. Zhou CC, Imamura F, Cheng Y, Okamoto I, Cho BC, Lin MC, et al. Early clearance of plasma EGFR mutations as a predictor of response to osimertinib and comparator EGFR-TKIs in the FLAURA trial. J Clin Oncol. 2019; 37(15 Suppl):9020.
crossref

Fig. 1
Mutational concordance between tumor DNA and circulating tumor DNA (ctDNA) sequencing. (A) Somatic mutation profiles of paired tumor and ctDNA samples. (B) The number of shared, tissue only, blood only mutations and concordance rate for each individual. (C) Venn diagrams demonstrated the concordance rate between tumor tissue and ctDNA sequencing in terms of all mutations and mutations in TP53, RB1, LRP1B, and FAT1.
crt-2021-905f1.gif
Fig. 2
Detection rate of TP53 and RB1 mutations at different time points and patients’ survival for different molecular subtypes based RB1 mutation. (A) Proportion of SCLC patients with RB1 from B1 to B4 time points. (B) Proportion of SCLC patients with TP53 mutations from B1 to B4 time points. (C) Classification of molecular groups according to the dynamic changes of TP53 and RB1 mutation from B1 to B2. (D) Kaplan-Meier curves for progression-free survival of patients in different subtypes according to the dynamic changes of RB1 mutation. (E) Kaplan-Meier curves for overall survival of patients in different subtypes according to the dynamic changes of RB1 mutation. CI, confidence interval; mOS, median overall survival; mPFS, median progression-free survival; NR, not reached; SCLC, small cell lung cancer.
crt-2021-905f2.gif
Fig. 3
The performance of molecular tumor burden index (mTBI) with computed tomography (CT) for evaluating therapeutic response. (A) Evaluation of therapeutic response in 18 patients using mTBI were consistent with CT. (B) Progressive disease was identified earlier using mTBI than by using tumor size. (C) Evaluations in two patients were inconsistent between mTBI and CT.
crt-2021-905f3.gif
Fig. 4
Changing in circulating tumor DNA and imaging during progressive disease in patients P35. CT (computed tomography): Imaging shows new metastases on right adrenal gland and enlargement of primary lesion. mTBI: Values of molecular tumor burden index at B1, B2 and B4, respectively. C, cycle of first-line chemotherapy; VAF, variant allele frequency.
crt-2021-905f4.gif
Table 1
Clinical characteristics of the study population
Characteristic Value (n=35)
Age at diagnosis (yr) 61 (43–69)
Sex
 Male 25 (71.4)
 Female 10 (28.6)
Smoking status
 Never smoker 8 (22.9)
 Former smoker 27 (77.1)
ECOG performance status
 0 19 (54.3)
 1 16 (45.7)
Stage
 Limited stage 24 (68.6)
 Extensive stage 11 (31.4)
Thoracic radiotherapy
 Yes 24 (68.6)
 No 11 (31.4)
Surgery
 Yes 1 (2.9)
 No 34 (97.1)
Maintenance therapya)
 Yes 11 (31.4)
 No 24 (68.6)
Prophylactic cranial irradiation
 Yes 13 (37.1)
 No 22 (62.9)
Tumor response
 Complete response 0
 Partial response 28 (80.0)
 Stable disease 6 (17.1)
 Progressive disease 1 (2.9)
Recurrence patternb)
 Refractory 7 (20.0)
 Resistant 5 (14.3)
 Sensitive 23 (65.7)

Values are presented as median (range) or number (%). ECOG, Eastern Cooperative Oncology Group.

a) Maintenance therapy include apatinib, etoposide soft capsule, sintilimab plus anlotinib, or the initial etoposide plus cisplatin regimen,

b) In terms of the recurrence pattern, sensitive was defined as disease progression ≥ 90 days after first-line platinum-based chemotherapy, resistant as disease progression < 90 days and refractory as during first-line chemotherapy.

Table 2
Prediction of different molecular characteristics on clinical prognostic characteristics
Positive Negative SE (95% CI) SP (95% CI) PPV (95% CI) NPV (95% CI)
RB1a)
 Tumor response
  PR 23 2 92 (80.6–103.4) 80 (24.5–135.5) 95.8 (87.2–104.5) 66.7 (12.5–120.9)
  SD 1 4
 Recurrence pattern
  Sensitive 19 0 100 54.5 (19.5–89.6) 79.2 (61.6–96.7) 100
  Refractory and resistant 5 6
TP53b)
 Tumor response
  PR 17 8 68 (48.3–87.7) 80 (24.5–135.5) 94.4 (82.7–106.2) 33.3 (2.0–64.6)
  SD 1 4
 Recurrence pattern
  Sensitive 14 5 73.7 (51.9–91.5) 63.6 (29.7–97.5) 77.8 (56.5–99.1) 58.3 (25.6–91.1)
  Refractory and resistant 4 7
mTBIc) (B4-B1)
 New metastasis
  Yes 7 0 100 85.7 (50.8–120.7) 87.5 (57.9–117.1) 100
  No 1 6

CI, confidence interval; mTBI, molecular tumor burden index; NPV, negative predicting value; PPV, positive predicting value; PR, partial response; SD, stable disease; SE, sensitivity; SP, specificity.

a) The prediction of tumor response and recurrence pattern by the dynamic changes of single gene mutation of RB1 from B1 to B2,

b) The prediction of tumor response and recurrence pattern by the dynamic changes of single gene mutation of TP53 from B1 to B2,

c) The predicting value of new metastasis by mTBI (B4-B1).

TOOLS
Similar articles