Journal List > Cancer Res Treat > v.54(3) > 1516078565

Kim, Yoon, Shin, Lee, Oh, Lee, Kim, Kim, Jung, Kim, and Lee: Incidence and Survival Rates of Cutaneous Melanoma in South Korea Using Nationwide Health Insurance Claims Data

Abstract

Purpose

Melanoma incidence is rising worldwide along with the associated personal and socioeconomic health expenditures. We investigated the incidence and survival-rate patterns of melanoma in South Korea using nationwide data.

Materials and Methods

This retrospective cohort study included patients with melanoma between 2004 and 2017, based on National Health Insurance (NHI) claims data in South Korea. The incidence, prevalence, and survival rate were analyzed along with baseline demographic characteristics. We collected solar irradiation dose and healthcare ranking score (HRS) according to the administrative district from the Korea Meteorological Administration and Korea Health Promotion Institute. The incidence and survival rates were assessed using Pearson’s correlation, the Kaplan-Meier estimation, multiple linear regression, and multiple logistic regression methods.

Results

Twenty-five thousand, five hundred ninety-one patients with melanoma were diagnosed during the study period. The age-standardized incidence of melanoma steadily increased from 2004 to 2017 from 2.6 to 3.0/100,000/yr. The incidence of melanoma increased with significantly higher income (p < 0.05). The prevalence followed a similar pattern as the incidence. According to multivariate analysis, HRS significantly influenced the incidence of melanoma in high sun-exposed sites (p < 0.001). There was no significant change in annual mortality. Women had a higher 5-year survival rate than men (78.4% vs. 72.8%). Mortality by the administrative district was highly correlated with HRS.

Conclusion

The incidence of melanoma is increasing in South Korea. A low HRS is associated with both higher incidence and mortality. The findings of this study could be utilized as a guideline for treating melanoma patients.

Introduction

Melanoma is the most aggressive skin cancer and is the sixth most frequently diagnosed cancer in the United States in both sexes [1]. The incidence of melanoma increases because of the gradually more aging society, better and earlier detection of melanoma using screening programs, and enhanced public awareness [1]. For Caucasians, the annual increase in the incidence rate of melanoma has been estimated to be approximately 3%–7% each year [2]. Melanoma incidence rates vary depending on ethnicity. In the United States, Hispanics (4.5/100,000), and blacks (1.0/100,000) have a lower incidence than non-Hispanic whites (21.6/100,000) [3]. Melanoma was detected in 1.2 million people in the United States in 2015, and based on data for 2013–2015, 2.3% of the US population will be diagnosed with melanoma over their lifetime [4]. Melanoma has a substantially lower incidence than basal cell carcinoma or squamous cell carcinoma. However, it has a much worse prognosis [1]. The survival rate of melanoma differs according to the pathological stage. Patients in stages I and II have a nearly 100% 5-year survival rate, whereas just 36% of patients diagnosed with stage IVa have a 5-year survival rate [5].
Melanoma incidence and prevalence trends appear to be consistent worldwide, with only variations when comparing latitudes. However, specific geographic locations are related to ultraviolet (UV) exposure. Caucasians are susceptible to cutaneous melanoma development, with the magnitude of risk depending on sun exposure patterns (intermittent or cumulative UV exposure) and individual inherited genetic factors [6]. Consequently, by far the highest incidence in both men and women is in Australia and New Zealand [7]. However, only limited information is available on the trends in cutaneous melanoma incidence and survival among East Asians, reportedly having a lower incidence rate than Caucasians [8].
South Korea has a public medical insurance system known as the National Health Insurance (NHI) program. NHI claims data are obtained from payment claims generated during patient visits to each medical institution. NHI claims data include diagnosis, treatment, procedure, medication, and survival information with general demographics including patient’s age, sex, area of residence, and income. This system covers more than 50 million people (98% of the whole population of South Korea) [9].
Therefore, this study aimed to investigate the patterns of melanoma incidence, prevalence, and survival rate in South Korea in terms of various demographic factors using NHI claims data from 2004 to 2017.

Materials and Methods

1. Study population

We only included melanoma cases certified by the rare and intractable disease (RID) registration program in the NHI claims database between January 2004 and December 2017. The NHI has established a registration program for RID, such as melanoma, within the NHI system for copayment reduction. All hospitals and clinicians use this program to benefit their patients. Thus, the RID database allowed us to analyze reliable epidemiological features of melanoma. According to the International Classification of Diseases 10th revision (ICD-10) codes, melanoma and melanoma in situ were classified as C43 and D03, respectively.
The site of melanoma was divided into high sun-exposed sites (face and neck: ICD-10 codes for C43.0–C43.4, D03.0–D03.4) and low sun-exposed sites (trunk and limbs: ICD-10 codes for C43.5–C43.7, D03.5–D03.7) to perform subgroup analysis [10,11]. A 2-year washout period (2002–2003) was used to prevent prevalent cases from interfering with the data.

2. Incidence and prevalence

An individual newly diagnosed with melanoma in the corresponding year was considered an incident case. A prevalent case was defined as a person diagnosed with melanoma for the first time in the corresponding year and individuals who had previously been registered as incident cases. The age-standardized rate was used to calculate the incidence and prevalence of melanoma, as it accounts for the differences in the age structure of the populations being compared. The age-standardized incidence and prevalence rate was calculated as the sum of the weighted rate for each 5-year age group using Segi’s world standard population [12].

3. Survival

The survival analysis was conducted using information from the NHI claims database. The date of registration in the RID program was considered the date of diagnosis. The cumulative survival of patients with melanoma was compared with the survival of the age-/sex-matched South Korean population using the log-rank test.

4. Variables and data collection

The NHI claims data were collected for each patient the following information: age, sex, area of residence, income, and survival. We obtained population and housing census data from the KOrean Statistical Information Service (KOSIS) [13]. The patient’s income status was estimated based on the premium quartile from the 2017 NHI statistical yearbook published by the NHI. All Korean people must pay an insurance premium based on housing income. Therefore, we assumed that the income was higher if the patient paid a higher insurance premium. The NHI categorizes people into 20 income groups in South Korea. We grouped patients into four groups for the convenience of analyses (Q1–5, Q6–10, Q11–15, Q16–20). The lowest 25% of patients were classified in Q1–5, and the top 25% were classified in Q16–Q20.
Solar irradiation (i.e., solar exposure, solar insolation) dose (SID) by administrative district information was collected from the Korea Meteorological Administration (KMA) observation data for 30 years to investigate the relationship between sun exposure and melanoma development [14]. The SID is the quantity of light energy emitted by a source reaching a square meter of an area each second. Additionally, we used the regional healthcare ranking score (HRS) from the Korea Health Promotion Institute [15]. This score consists of 17 indicators, 10 regional development status indexes (population density, urbanization rate, rural place index, sewerage penetration rate, income taxes per capita, independent rate of district finance, ratio of residence in basement, wastewater discharge, agricultural area, health sector ratio of total budget), and seven healthcare vulnerability indexes (population aged 65 years or older, a ratio of basic livelihood security recipient, a ratio of registered severe disabilities, physicians per 10,000 people, standardized death rate, ratio of infants, percentage of elderly aged 65 years or older living alone). A lower score denotes a better regional healthcare condition. The HRS data was used to examine the incidence and survival rate correlation with the regional healthcare condition.

5. Statistical analyses

The data manipulation and statistical analyses were conducted using R software ver. 3.3.3 (R Foundation, Vienna, Austria). We used the rgdal and rworldmap packages from an R library to compare melanoma incidence and mortality with SID or HRS in South Korea and worldwide. Pearson’s correlation analysis was used to observe how the incidence changed according to sex over 2004–2017, locate differences in the incidence among ages, and evaluate how strongly the SID and HRS are linearly related to incidence. To interpret the level of the correlation coefficient, we followed the guidelines provided by Chan [16]. There are about four ranges of correlation coefficient values between 0 and 1 without any negative values. Pearson’s correlation coefficient (PCC) values greater than 0.8 denote a strong relationship, PCCs of 0.6–0.8 signify a moderate and of 0.3–0.6 a fair correlation. Values close to 0 (0.0–0.3) denote a poor correlation. Pearson’s correlation analysis was also performed to examine whether the incidence and 5-year survival rates would be positively associated with income increase. The 5-year survival rate of melanoma was examined using the Kaplan-Meier estimation method, with comparisons made using the log-rank test. Referring to the results, we plotted graphs of 5-year survival rates for 2004–2017 according to sex, age at diagnosis, income, and high or low sun-exposed sites. Subsequently, we performed a multiple linear regression analysis with melanoma incidence and mortality as the dependent variables using the SID and HRS as independent confounding variables. Finally, the multiple logistic regression analysis was used to predict the risk factor of melanoma mortality, adjusting sex, age, income, SID, and HRS.

Results

In South Korea, 25,591 patients were diagnosed with melanoma during the study period. Patients with melanoma in high sun-exposed sites were 5,802, in low sun-exposed sites were 18,816, and 973 patients had lesions in both sites.

1. Incidence and prevalence

There was no significant difference in the incidence and prevalence by sex. The overall incidence (112 to 3,874) and prevalence (122 to 6,620) appeared to increase with age (p < 0.0001; PCC: incidence 0.977, prevalence 0.969). Table 1 shows the trends of melanoma incidence and prevalence by sex and age. The age-standardized incidence rate of melanoma increased steadily in women (1.4 to 1.6) from 2004 to 2017 (p < 0.01). The age-standardized prevalence rate also increased in men (1.7 to 2.8) and women (1.9 to 3.1) (p < 0.001) (Table 2). The characteristics of melanoma patients according to anatomical sites are described in Table 3.
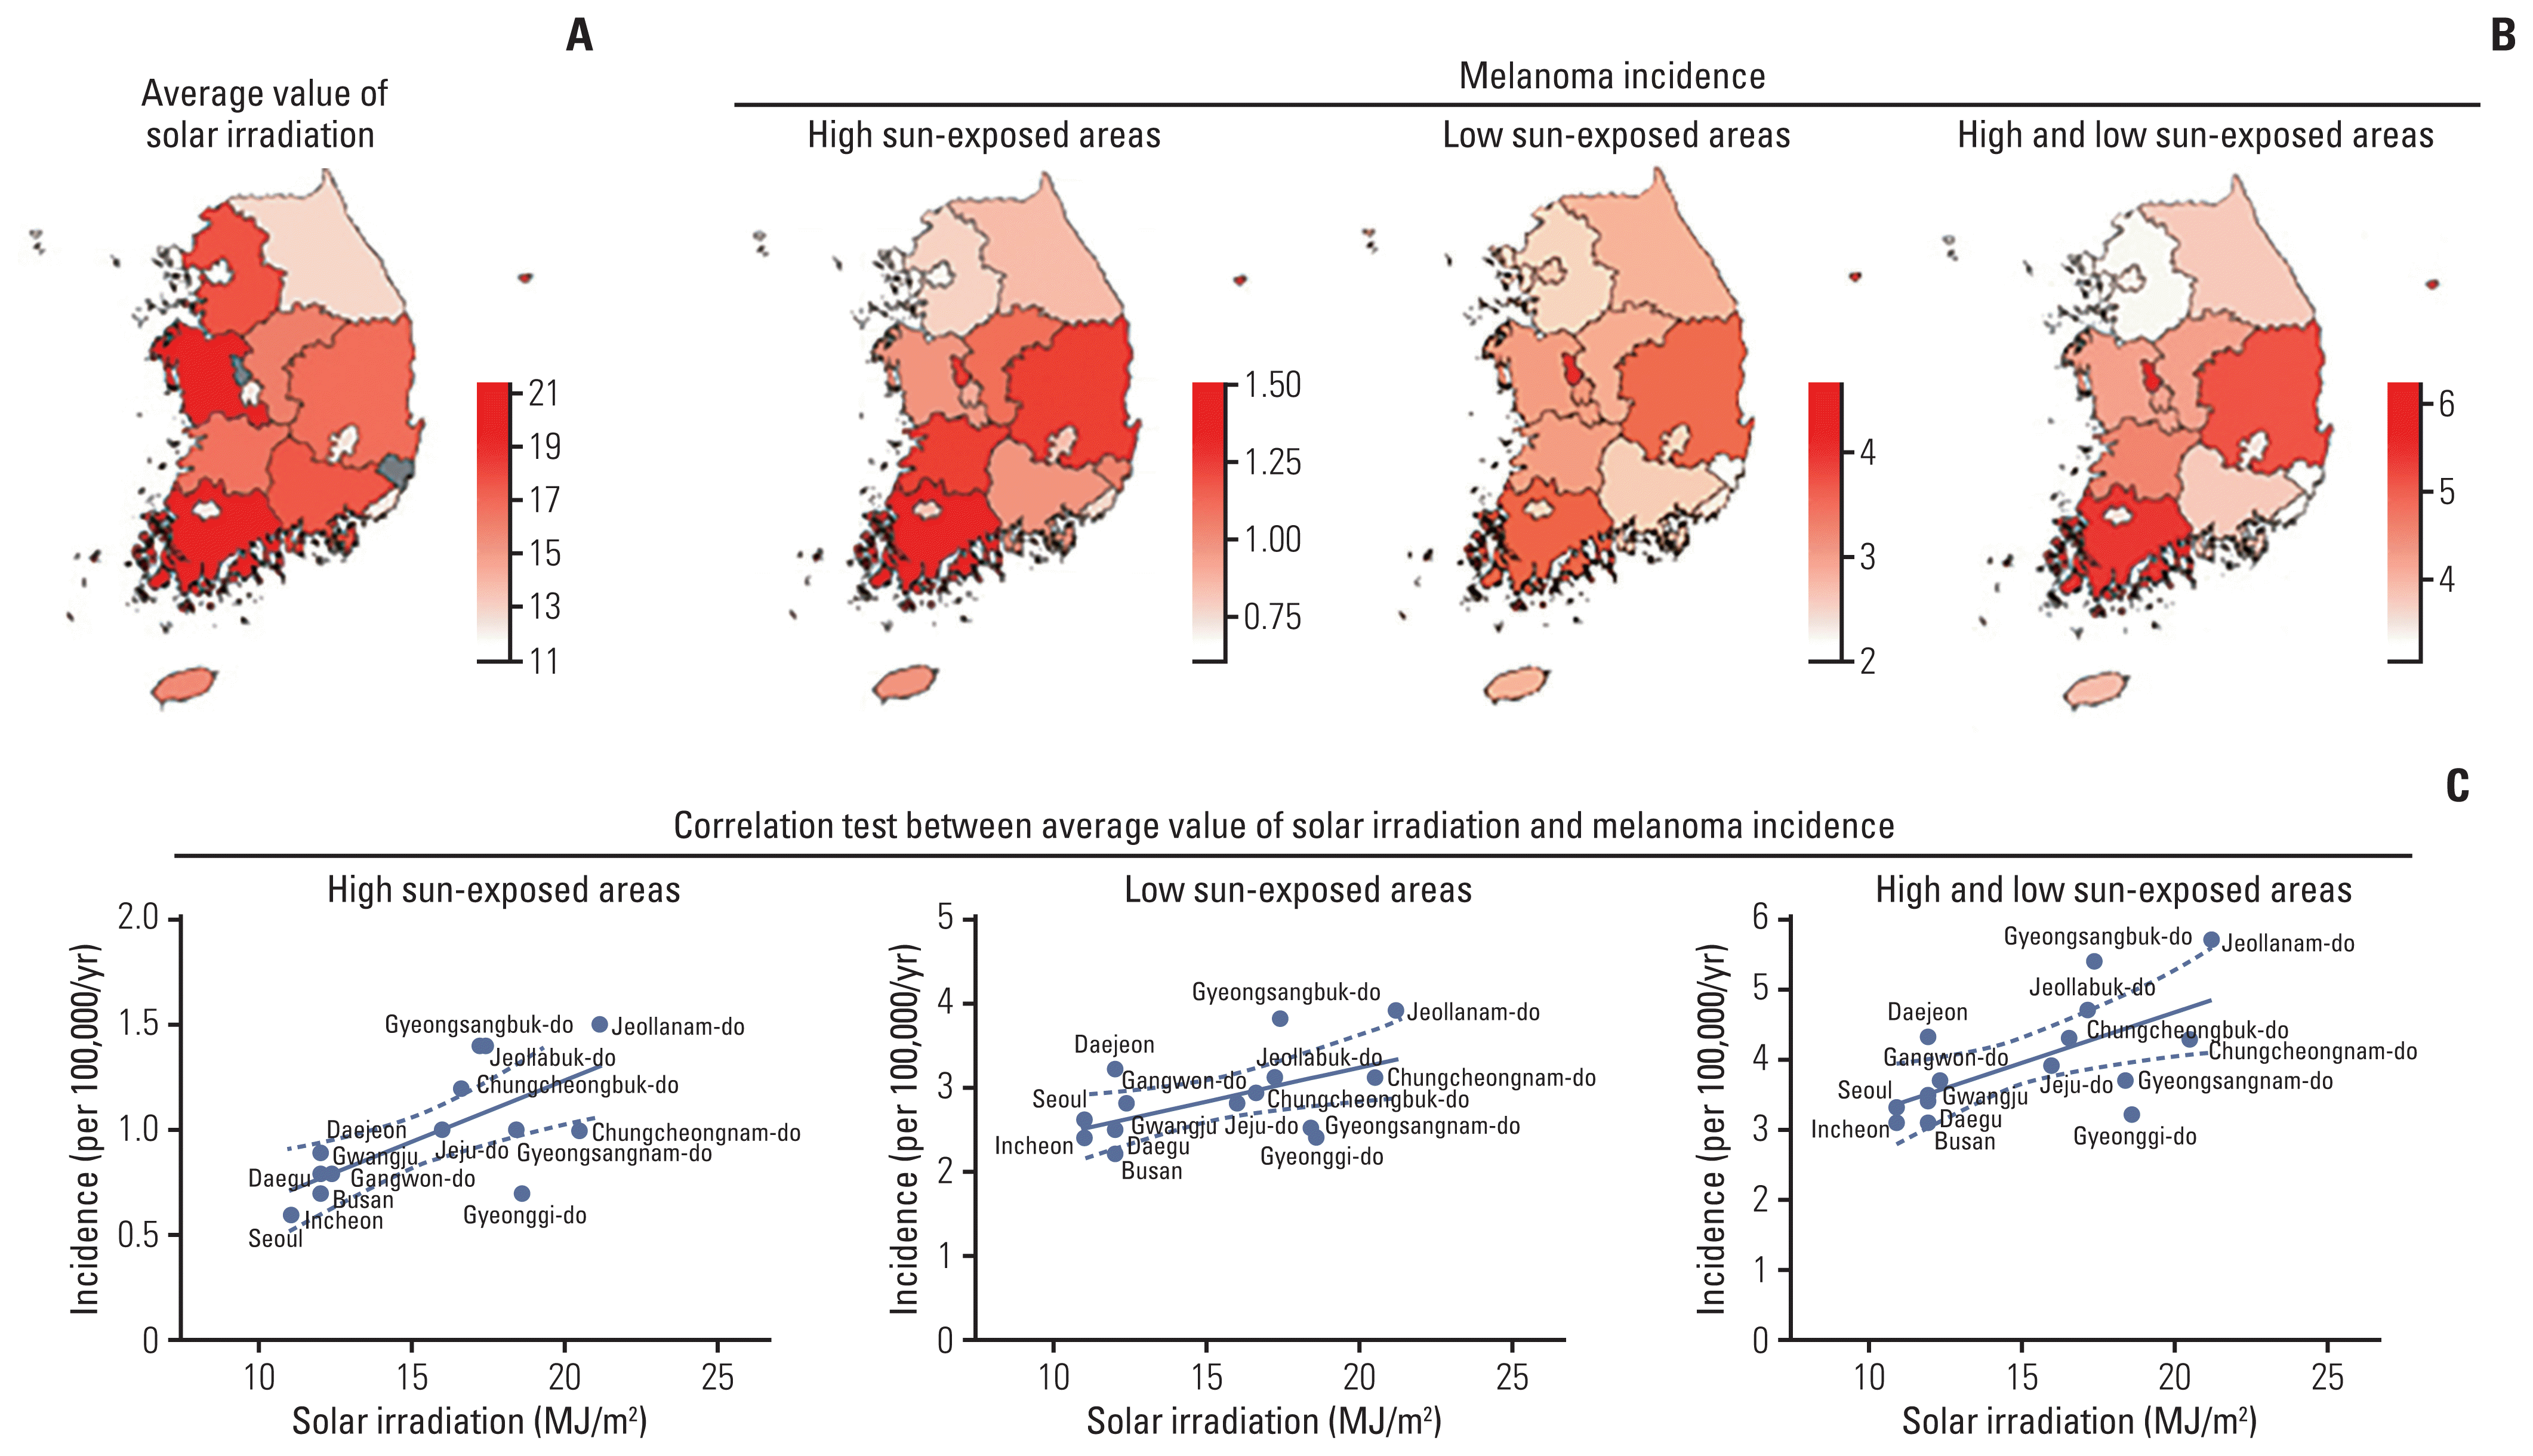
Regarding solar irradiation and melanoma development, we found that Jeollanam-do had the most solar irradiated area with 21.2 MJ/m2. Seoul and Incheon were the lowest solar radiated areas with 11 MJ/m2, according to the KMA observation data. Irrelevant with the anatomical site of melanoma, the incidence was significantly correlated with solar irradiation (p < 0.05; PCC, 0.637). Specifically, in high sun-exposed sites, the incidence was highly correlated with solar irradiation (p < 0.001; PCC, 0.702). The group of low sun-exposed sites had the lowest correlation coefficient between incidence and solar irradiation, although it was statistically significant (p < 0.05; PCC, 0.549) (Fig. 1, S1 Table).
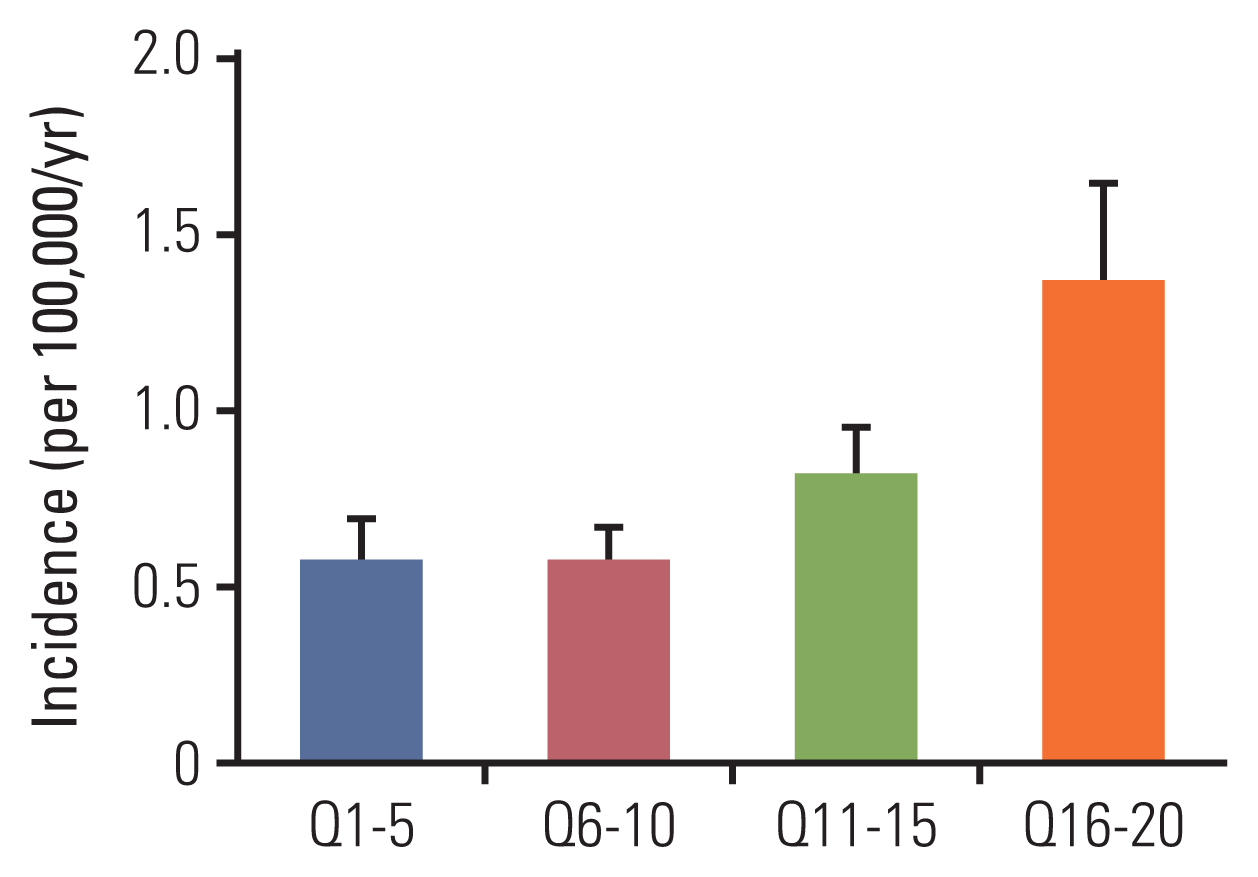
In terms of income, the age-standardized incidence rate of melanoma increased significantly as the income estimated from the insurance premium increased (Q1–5, 0.58; Q6–10, 0.57; Q11–15, 0.82; Q16–20, 1.37) (Fig. 2). The changes in incidence by different income levels during the whole study period are summarized in S2 Table.
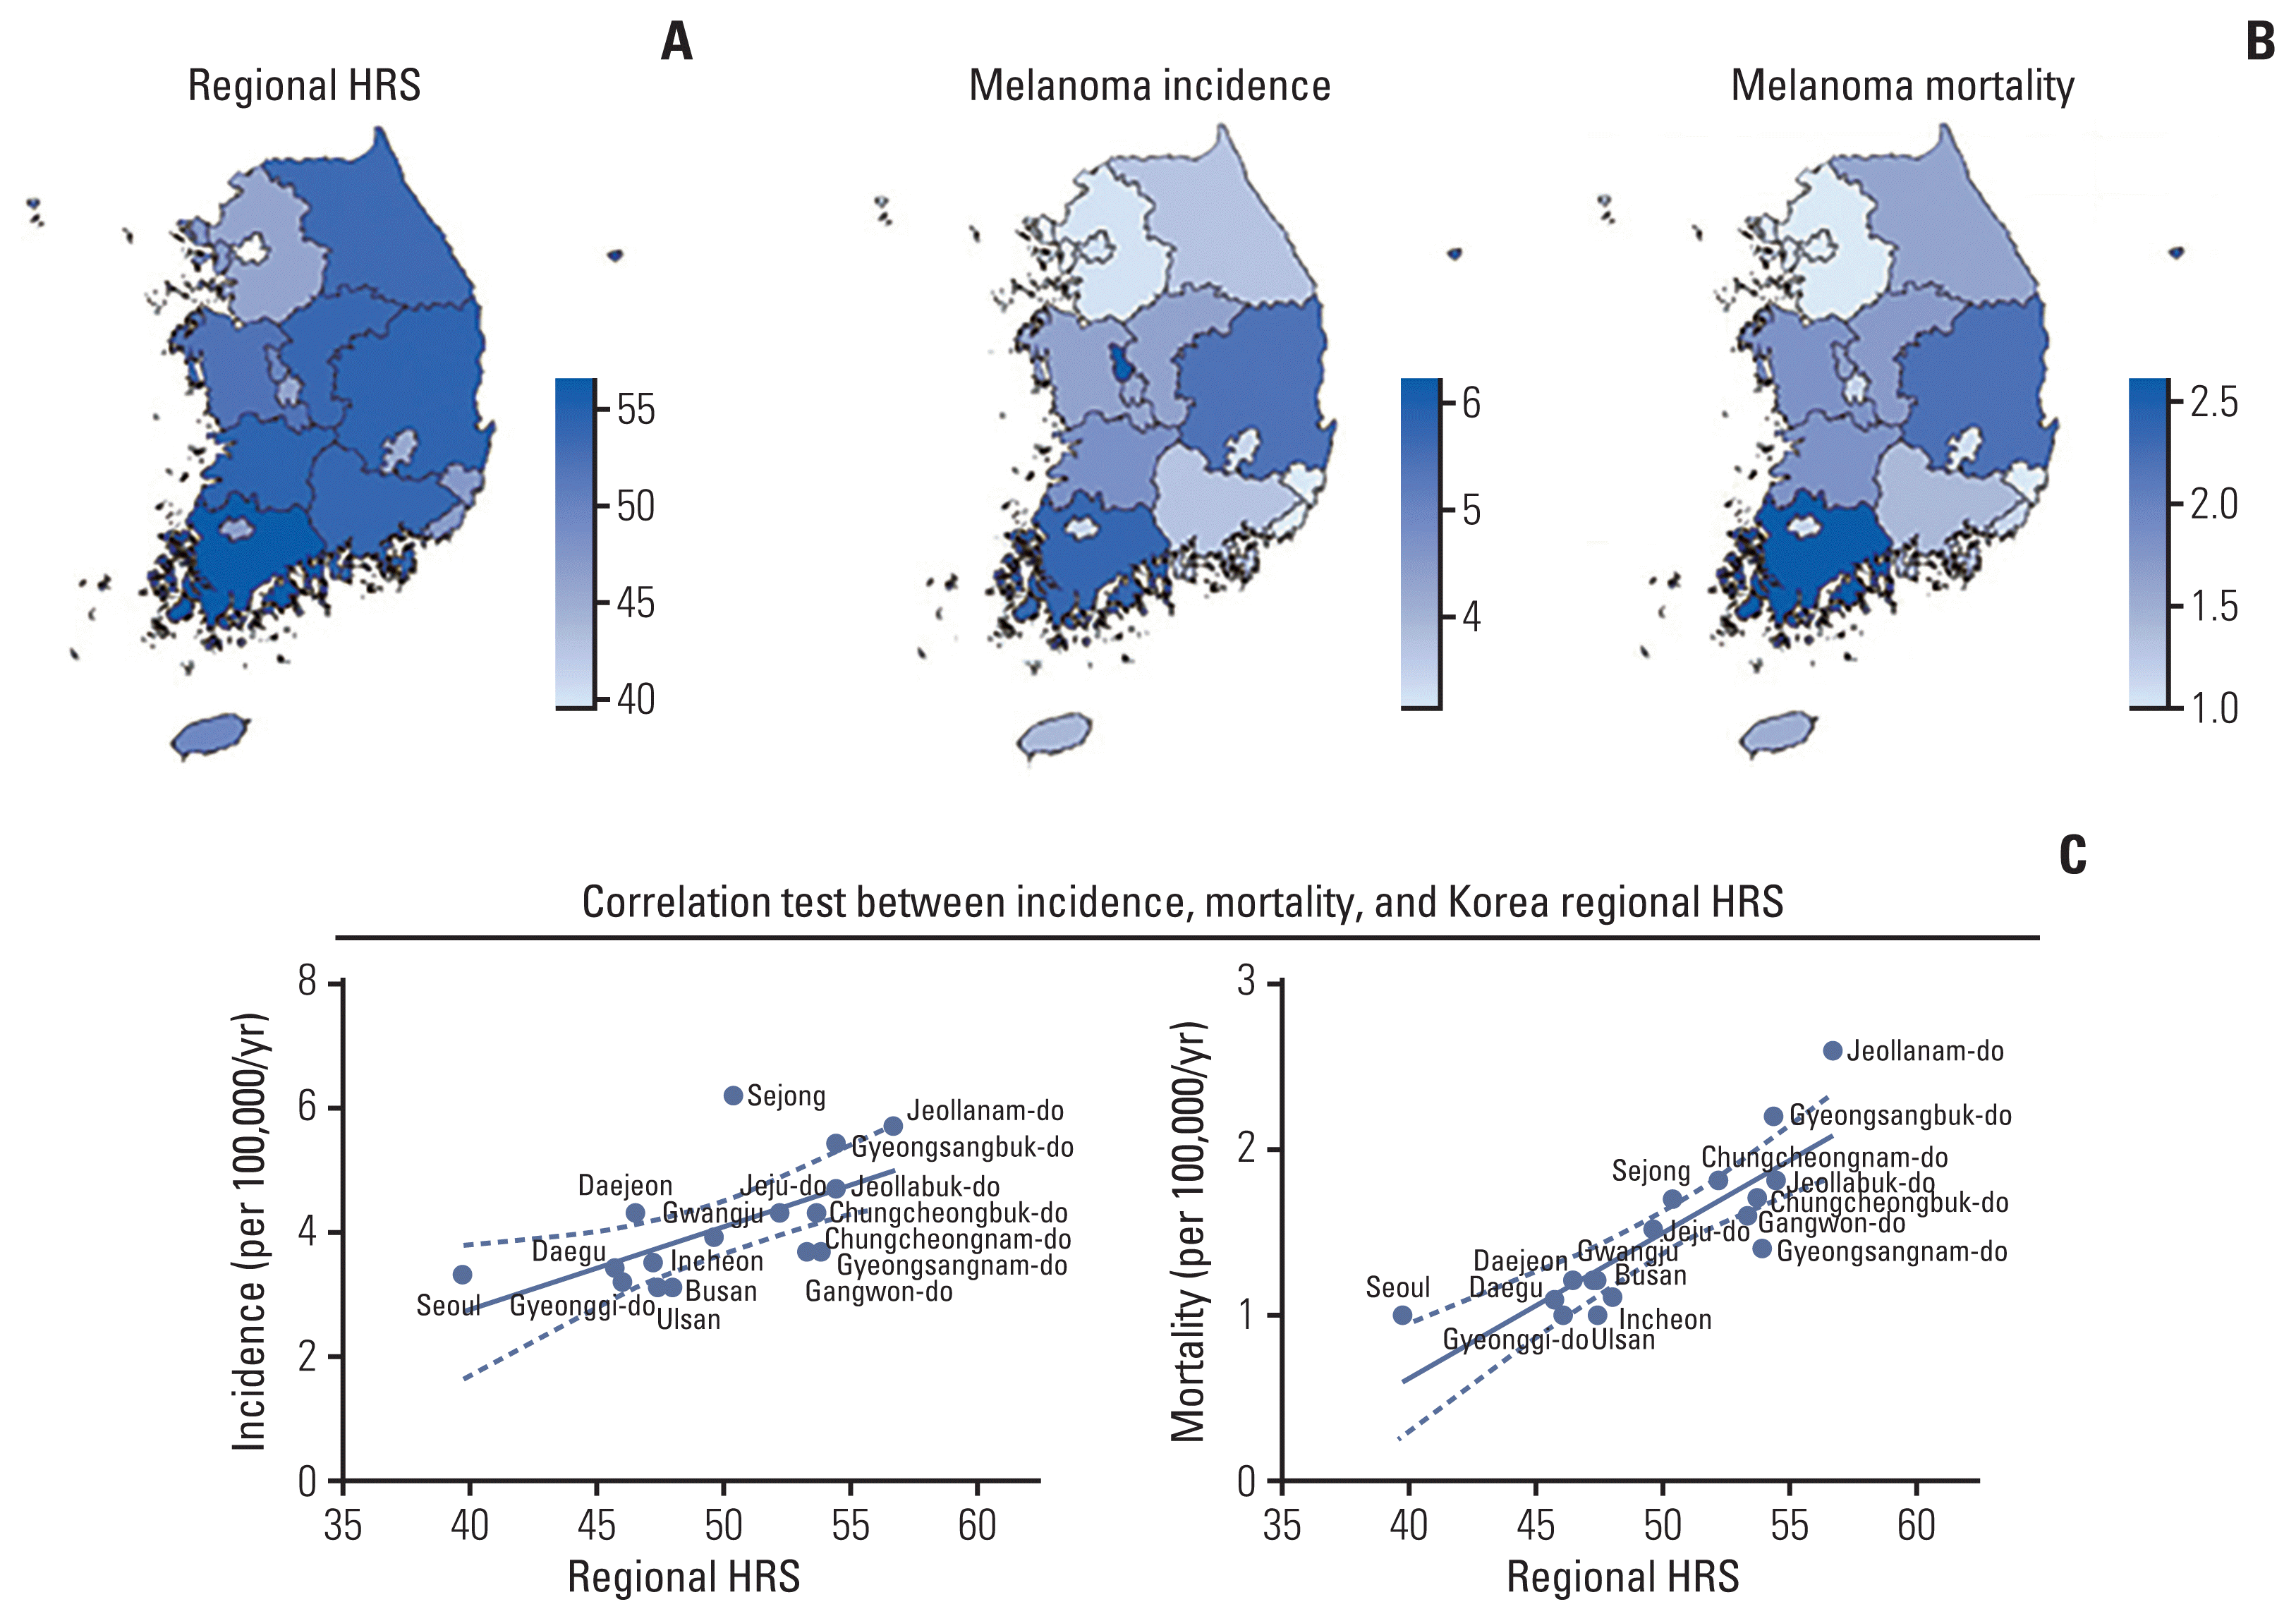
The regional HRS was lowest in Seoul and highest in Jeollanam-do at 39.7 and 56.7, respectively. The regional HRSs were significantly correlated with the incidence of melanoma (p < 0.01; PCC, 0.613) (Fig. 3, S3 Table). The multiple linear regression analysis results showed that the HRS was positively correlated with melanoma incidence in high sun-exposed sites (p < 0.001) (Table 4).

2. Survival

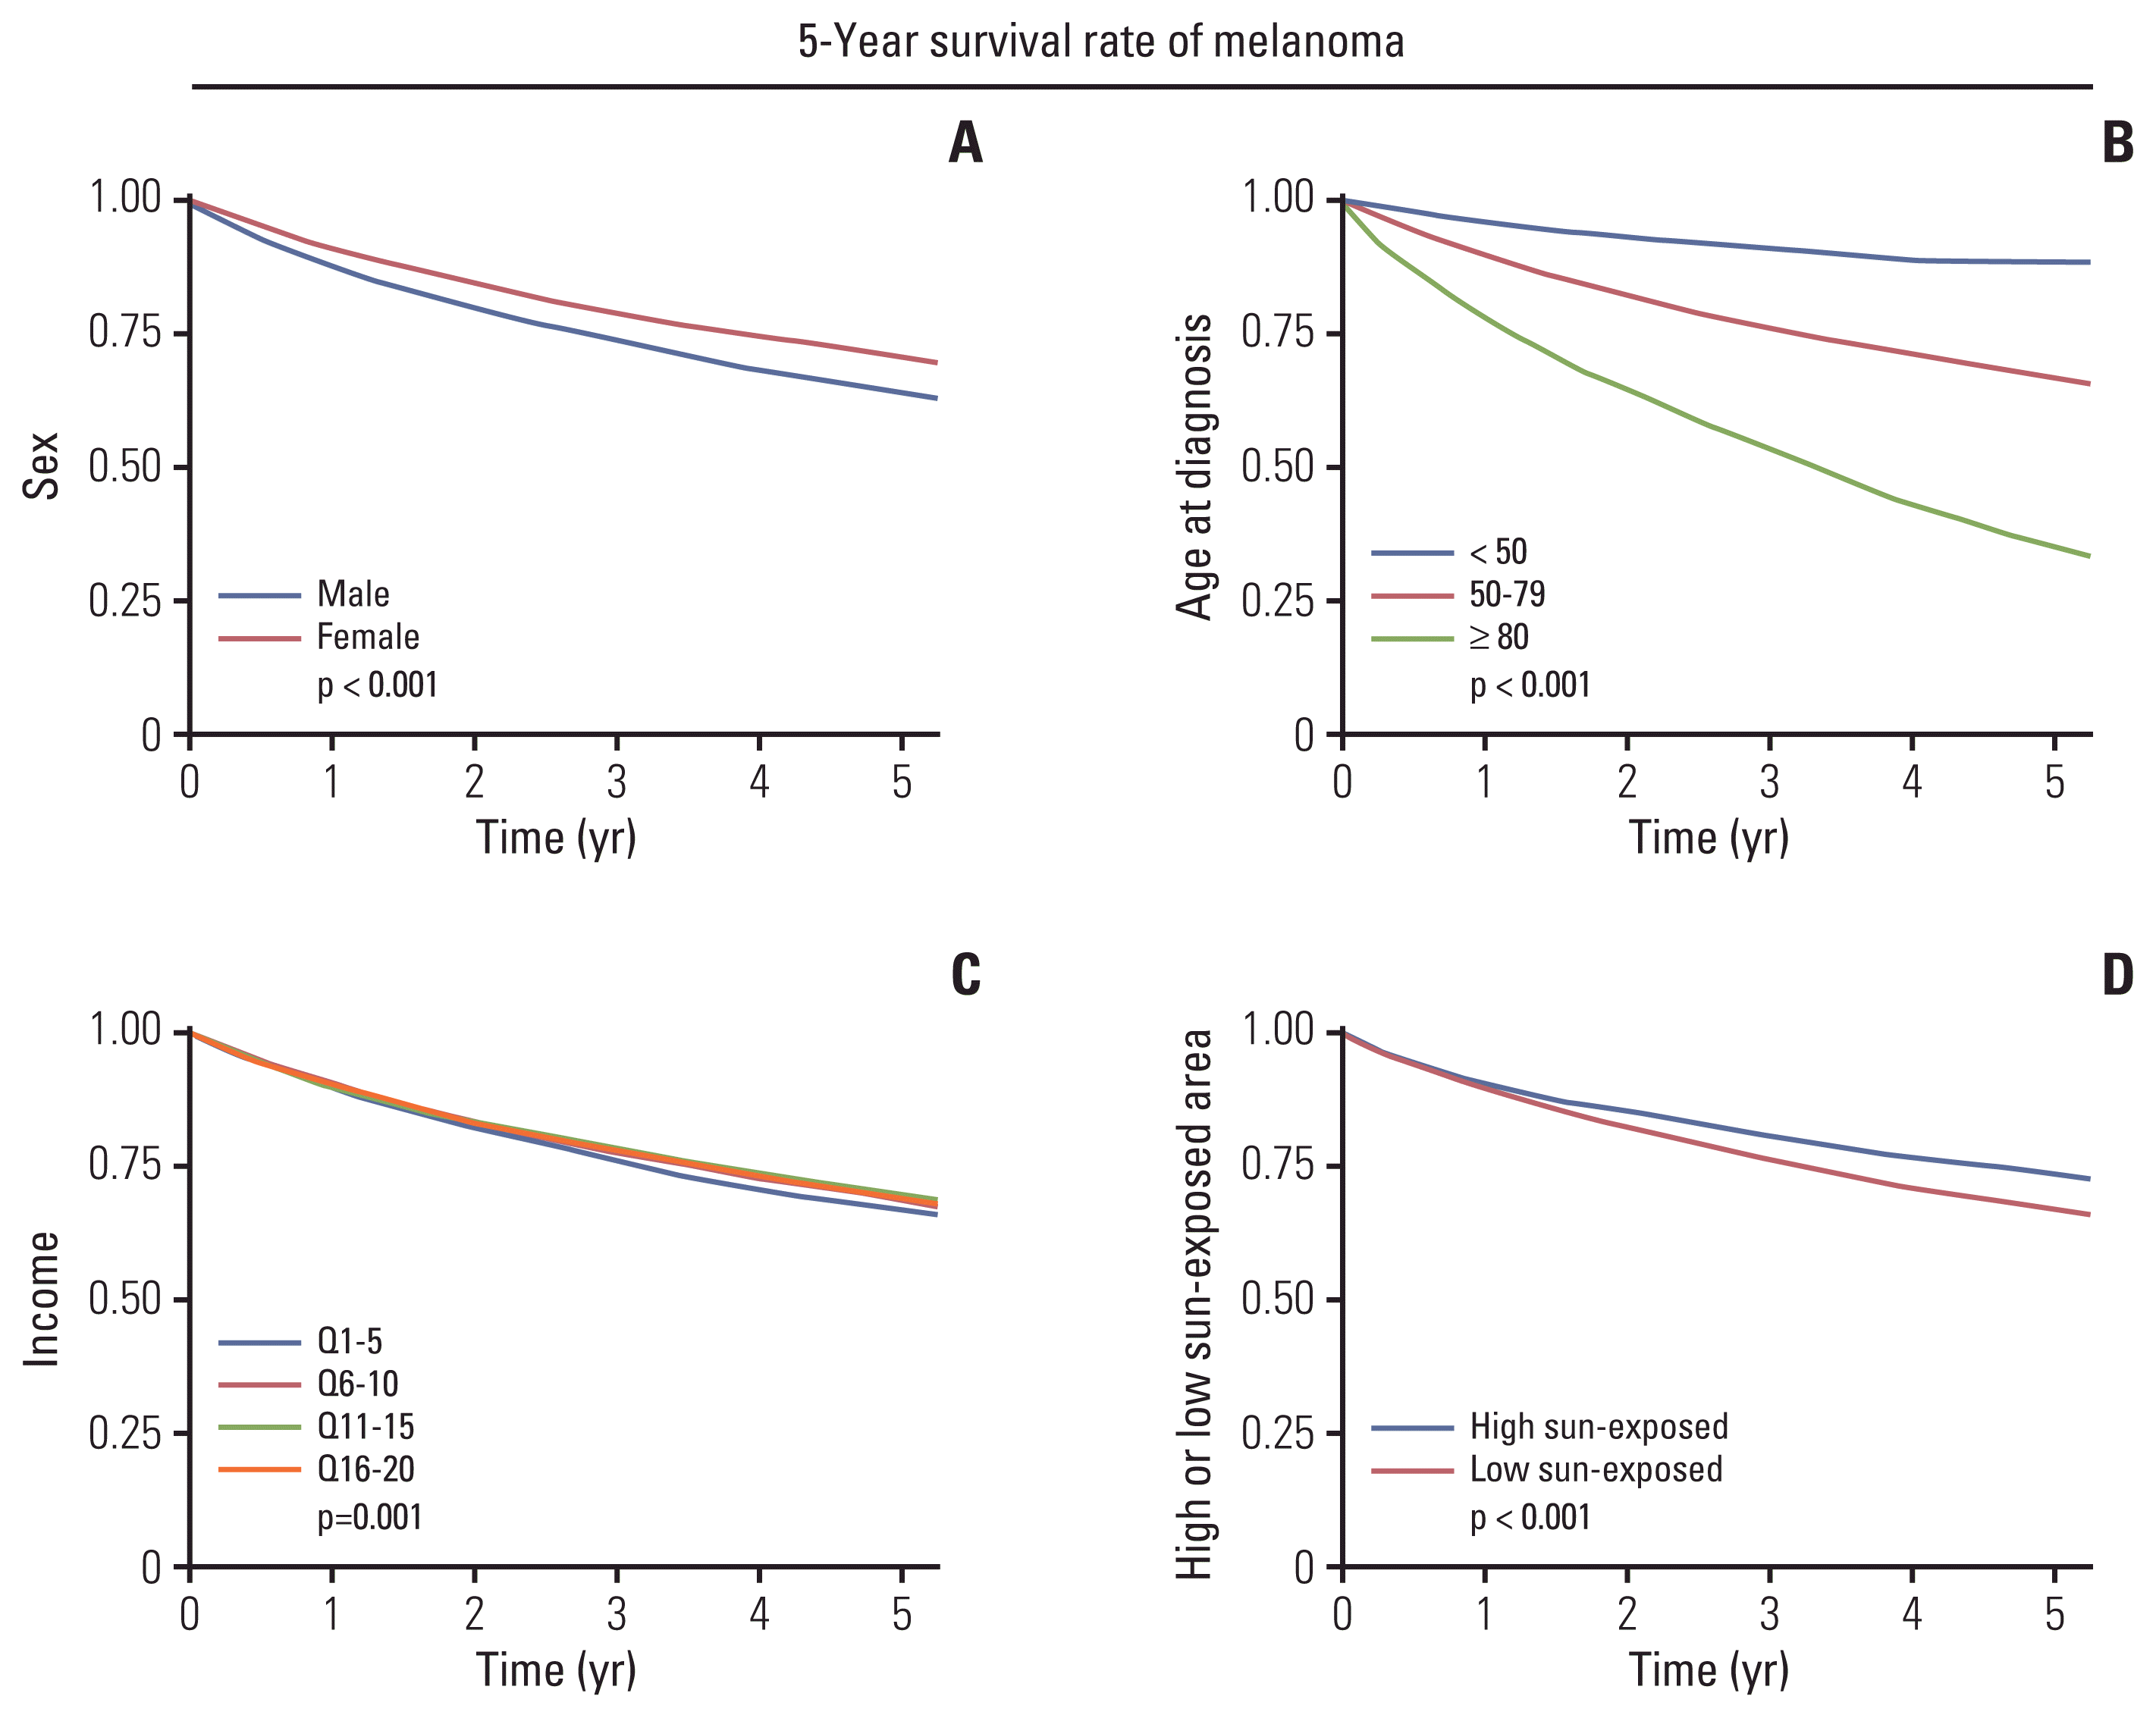
The annual mortality rate remained constant from 9.6% in 2004 to 8.6% in 2017 (Table 5). Subgroup analyses revealed that the 5-year survival rate was better in women than in men, with the difference being significant (p < 0.001; 78.4% vs. 72.8%). As expected, the survival rate declined with age (p < 0.001; < 50, 90.6%; 50–79, 75.4%; ≥ 80, 50.2%). The patients with melanoma in low sun-exposed sites had a worse survival rate than those in high sun-exposed sites at 5-year follow-up (p < 0.05; 75.9% vs. 79.4%) (Figs. 4 and 5). The higher income was a better survival rate than the lower income (p < 0.001; Q1–5, 72.9%; Q6–10, 74.3%; Q11–15, 74.8%; Q16–20, 74.7%) (Fig. 4).
Similar to the incidence, there was a strong correlation between the regional HRS and regional mortality (p < 0.001; PCC, 0.840) (Fig. 3, S3 Table). Multiple linear regression analysis results showed that the HRS was positively correlated with melanoma mortality (p < 0.001) (Table 4). Furthermore, multivariate logistic regression analysis revealed that the higher the HRS, the poorer the prognosis (p < 0.001) (Table 6).

Discussion

This study showed the nationwide trends of melanoma incidence and survival rate by age, sex, income, area of residence, and anatomical sites using NHI claims data from 2004 to 2017. We used NHI claims data, KOSIS, KMA, and Korea Health Promotion Institute data for comprehensively studying melanoma epidemiology. To our knowledge, this was the first study to use such varied types of nationwide data.
We found that the incidence of melanoma gradually increased from 2004 to 2017 at 3.0/100,000/yr in 2017. The incidence has increased in most countries, although in Asian countries, it remains relatively low [17]. Among 100,000 people, the incidence was reported at 1.75/100,000/yr in Japan, 0.65/100,000/yr in Taiwan, and 8.0/100,000/yr in China [18]. Australasian, North American, European populations were most greatly burdened by melanoma, especially older people, at 54/100,000/yr in Australasia, 21/100,000/yr in North America, 16/100,000/yr in Western Europe, 8/100,000/yr in Central Europe, and 8/100,000/yr in Eastern Europe [19]. We suspect that the increased incidence of melanoma may be related to the development of diagnostic technologies and increased public awareness. It can be assumed that the increase in outdoor leisure activities and the westernization of lifestyles have also had an effect.
We classified and analyzed patients with melanoma according to their exposure site to sunlight. We observed that low sun-exposed sites were more greatly affected by melanoma than high sun-exposed sites in South Korea. Previous studies have reported similar results. Shaikh et al. [20] found 19,900 patients diagnosed with melanoma in the face and neck and 75,696 patients with melanoma in the trunk and limbs in the United States from 1989 to 2009. Likewise, Tomizuka et al. [18] also reported that melanoma in the trunk and limbs was more prevalent than melanoma in the head and neck in Japan (3,505 vs. 280).
Sunlight exposure and the increased likelihood of developing skin cancer have been a frequent subject of research. Parkin et al. [2] reported that approximately 86% of melanoma was associated with UV exposure. The risk for melanoma doubled after just one blistering sunburn during childhood [21]. Irrelevant by anatomical site, we found a significant correlation between incidence of melanoma and amount of solar irradiation. Interestingly, our results showed statistically significant in the melanoma patients of low sun-exposed sites (Fig. 1C). The exact reason for these results cannot be fully elucidated in this study. However, we speculate that physical stress, such as trauma and genetic factors, and intermittent-sun exposure may be associated complexly in melanoma development [2224]. Several studies have reported that the association between melanoma and sun exposure may differ according to anatomical sites. Caini et al. [7] has reported that melanoma on the head and neck was more greatly related to continuous sun exposure, whereas melanoma on the trunk and limbs was associated with intermittent-sun exposure patterns. Gandini et al. [25] performed the meta-analysis about the risk factors for melanoma and concluded that intermittent-sun exposure was positively associated with melanoma, but the high continuous pattern of sun exposure had the inverse association. Additionally, we obtained global UV radiation level and melanoma incidence data from the World Health Data Platform and International Agency for Research on Cancer, respectively [26], and compared the UV radiation dose and worldwide incidence of melanoma. However, there was no significant correlation globally (S4 Fig.). We speculate that it is because these data from various countries are not standardized and are not analyzed by the anatomical site of the melanoma. Furthermore, genetics, ethnicity, and other factors are also important.
Using the NHI claims data, income could be precisely estimated because the National Health Insurance premium is based on household income [9]. It was found that the top 25% of people had approximately 0.79 higher age-standardized melanoma incidence compared to the bottom 25% (Fig. 2). Previous studies have shown that melanoma incidence was higher among people in high socioeconomic status groups in Canada and the Netherlands [27,28]. We believe that it is because the higher the income, the higher the awareness of healthcare. Studies have also shown that awareness of, and access to, screening for cancer is disproportionately higher in individuals with higher socioeconomic status [29].
We found that being male, lower income, and melanoma at low sun-exposed sites had the lowest survival rate, although the differences only ranged from 2.0% to 5.6% for each variable. We cannot conclude that these results are truly significant because the p-value became extremely low because of the large sample size in the analyses of nationwide data [30].
Some studies have reported differing views on the melanoma prognostic impact according to income. Geller et al. [31] investigated melanoma mortality among the socioeconomically disadvantaged, reporting that those with lower socioeconomic status may be more likely to die than patients of higher socioeconomic status. Hopkins et al. [32] concluded that average household income and education levels were not associated with melanoma survival.
The relationship between melanoma prognosis and anatomical sites is also controversial for each study. Gillgren et al. [33] concluded the survival rates according to anatomical sites, by the following order, starting with the lowest neck-trunk and foot, face, and lower and upper limbs. Howard et al. [34] reported that the dorsal shoulder, superior back, and clavicular sites showed a worse prognosis than the other anatomical regions, including the calves, Achilles, upper arms, forehead, temples, cheeks, and face. A further prospective study will be necessary to elucidate these. On the other hand, Berwick et al. [35] reported that intermittent-sun exposure might increase survival from melanoma. Holidays with sun exposure were associated with favorable melanoma prognostic factors.
Nevertheless, in the case of sex, there is evidence that relative survival remains worse for men. Balzi et al. [36] reported that women had a clear prognostic advantage over men. Sharouni et al. [37], likewise, demonstrated that after adjustment for all other variables (age, breslow thickness, localization, ulceration, and morphological subtype), sex remained significantly associated with a higher risk of dying among men with a relative excess risks for men at 1.37.
Subsequently, we assumed that a regional medical service gap would influence the incidence or mortality of melanoma. To evaluate the medical service gap, we used the Korea regional HRS obtained from the Report for Healthcare Vulnerable Region of Korea 2016 published by the Korea Health Promotion Institute [15]. Results showed a high positive correlation between the Korea regional HRS and both melanoma incidence and mortality. It should be noted that these regional differences will be helpful for the nationwide distribution of medical resources and services in the future.
This study had both strengths and limitations. This study was based on the real-world data of an NHI claims database in South Korea. We collected the long-term data of more than 25,000 patients who had melanoma without selection bias. South Korea has a public health insurance system that covers the entire population and a copayment decreasing policy for RIDs such as melanoma. Therefore, all patients with melanoma were registered in the healthcare system, and their data could be examined. However, this study involves the potential limitations of a retrospective observational design. The NHI claims data did not include information on possible confounding factors such as radiologic and laboratory findings, and the etiologic mechanism of melanoma. Acral melanoma, the most common subtype of melanoma in South Korea, occurs on the palm, sole, and nails (non-sun exposure sites). It does not include the thigh, calf, shin, arm, and forearm (intermittent-sun exposure sites). In NHI claims data, extremities codes do not divide acral site from extremities. Hence, we could not perform subgroup analysis according to the pathological melanoma subtype. The NHI claims data also did not include individual patient’s information such as occupation, lifestyle, and habits. For this reason, the association between patient’s way of life and solar irradiation was not considered. A possible explanation of better survival in the high sun-exposed sites (head and neck melanoma) is the earlier diagnosis because this site is more visible than low sun-exposed melanoma. In multiple linear regression analysis, we only included SID and HRS as independent variables because the other variables such as age, sex, income, and area of residence were not linked with the SID and HRS.
The incidence of melanoma in South Korea is increasing. Sun exposure might be an important pathogenic factor in South Korea for melanoma development in the melanoma patient of high sun-exposed sites. Regions with poor medical services or accessibility had higher incidence and lower survival of melanoma. Our study provides valuable data, which will be helpful for consultations and for establishing healthcare systems for patients with melanoma.
Electronic Supplementary Material

Supplementary materials are available at Cancer Research and Treatment website (https://www.e-crt.org).

Notes

Ethical Statement

The study design was approved by the local institutional review board (IRB No. CHAMC 2021-08-027). The board waived the requirement for informed consent, and we encrypted all personal identifiers and analyzed the data anonymously.

Author Contributions

Conceived and designed the analysis: Lee S, Kim TH, Yoon S, Shin DE, Lee SC, Oh J, Lee SY, Kim DK, Kim S, Jung BS, Kim M.

Collected the data: Lee S, Kim TH, Yoon S, Lee SC.

Contributed data or analysis tools: Lee S, Kim TH, Yoon S, Lee SC, Oh J, Lee SY, Kim DK, Kim S, Jung BS, Kim M.

Performed the analysis: Lee S, Kim TH, Yoon S, Shin DE, Lee SC, Oh J, Lee SY, Kim DK, Kim S, Jung BS, Kim M.

Wrote the paper: Lee S, Kim TH, Yoon S, Shin DE.

Conflicts of Interest

Conflict of interest relevant to this article was not reported.

ACKNOWLEDGMENTS

This research was supported by a Basic Science Research Program through the National Research Foundation of Korea (NRF) funded by the Ministry of Education (No. 2018R1D1A1B07043066) and by a National Research Foundation of Korea (NRF) grant funded by the Korea government (MSIT) (No. 2019R1C1C1004017).

References

1. Geller AC, Swetter SM, Brooks K, Demierre MF, Yaroch AL. Screening, early detection, and trends for melanoma: current status (2000–2006) and future directions. J Am Acad Dermatol. 2007; 57:555–72.
crossref
2. Parkin DM, Bray F, Ferlay J, Pisani P. Estimating the world cancer burden: Globocan 2000. Int J Cancer. 2001; 94:153–6.
crossref
3. Erdei E, Torres SM. A new understanding in the epidemiology of melanoma. Expert Rev Anticancer Ther. 2010; 10:1811–23.
crossref
4. Prado G, Svoboda RM, Rigel DS. What’s new in melanoma. Dermatol Clin. 2019; 37:159–68.
crossref
5. Hildenbrand GL, Hildenbrand LC, Bradford K, Cavin SW. Five-year survival rates of melanoma patients treated by diet therapy after the manner of Gerson: a retrospective review. Altern Ther Health Med. 1995; 1:29–37.
6. Erdmann F, Lortet-Tieulent J, Schuz J, Zeeb H, Greinert R, Breitbart EW, et al. International trends in the incidence of malignant melanoma 1953–2008: are recent generations at higher or lower risk? Int J Cancer. 2013; 132:385–400.
crossref
7. Caini S, Gandini S, Sera F, Raimondi S, Fargnoli MC, Boniol M, et al. Meta-analysis of risk factors for cutaneous melanoma according to anatomical site and clinico-pathological variant. Eur J Cancer. 2009; 45:3054–63.
crossref
8. Pena SD, Di Pietro G, Fuchshuber-Moraes M, Genro JP, Hutz MH, Kehdy Fde S, et al. The genomic ancestry of individuals from different geographical regions of Brazil is more uniform than expected. PLoS One. 2011; 6:e17063.
crossref
9. Seong SC, Kim YY, Khang YH, Park JH, Kang HJ, Lee H, et al. Data resource profile: the National Health Information Database of the National Health Insurance Service in South Korea. Int J Epidemiol. 2017; 46:799–800.
10. Oh CM, Cho H, Won YJ, Kong HJ, Roh YH, Jeong KH, et al. Nationwide trends in the incidence of melanoma and non-melanoma skin cancers from 1999 to 2014 in South Korea. Cancer Res Treat. 2018; 50:729–37.
crossref
11. Weber A, Leitzmann MF, Sedlmeier AM, Baurecht H, Jochem C, Haferkamp S, et al. Association between physical activity, grip strength and sedentary behaviour with incidence of malignant melanoma: results from the UK Biobank. Br J Cancer. 2021; 125:593–600.
crossref
12. Segi M. Cancer mortality for selected sites in 24 countries 1950–1957. Sendai: Tohoku University School of Medicine;1960.
13. Korean Statistical Information Service. Population trend survey, resident population (mid-year) in five-year age groups - vital statistics: annual 1993–2020 [Internet]. Daejeon: Statistics Korea;2020. [cited 2020 Aug 24]. Available from: https://kosis.kr/statHtml/statHtml.do?orgId=101&tblId=DT_1B040M5&conn_path=I2 .
14. Korea Meteorological Administration. Domestic climate data: average annual value data (30 years) [Internet]. Seoul: Korea Meteorological Administration;2020. [cited 2020 Aug 16]. Available from: http://web.kma.go.kr/weather/climate/average_30years.jsp?yy_st=1991&x=27&y=15&stn=0&norm=Y&obs=0 .
15. Report for healthcare vulnerable region of Korea [Internet]. Seoul: Korea Health Promotion Institution;2016. [cited 2020 Aug 16]. Avaliable from: https://www.khealth.or.kr/kps/publish/view?menuId=MENU00888&page_no=B2017001&pageNum=2&siteId=&srch_text=&srch_cate=&srch_type=&str_clft_cd_list=&str_clft_cd_type_list=&board_idx=9176 .
16. Chan YH. Biostatistics 104: correlational analysis. Singapore Med J. 2003; 44:614–9.
17. Nikolaou V, Stratigos AJ. Emerging trends in the epidemiology of melanoma. Br J Dermatol. 2014; 170:11–9.
crossref
18. Tomizuka T, Namikawa K, Higashi T. Characteristics of melanoma in Japan: a nationwide registry analysis 2011–2013. Melanoma Res. 2017; 27:492–7.
crossref
19. Karimkhani C, Green AC, Nijsten T, Weinstock MA, Dellavalle RP, Naghavi M, et al. The global burden of melanoma: results from the Global Burden of Disease Study 2015. Br J Dermatol. 2017; 177:134–40.
crossref
20. Shaikh WR, Dusza SW, Weinstock MA, Oliveria SA, Geller AC, Halpern AC. Melanoma thickness and survival trends in the United States 1989 to 2009. J Natl Cancer Inst. 2016; 108:djv294.
21. Lew RA, Sober AJ, Cook N, Marvell R, Fitzpatrick TB. Sun exposure habits in patients with cutaneous melanoma: a case control study. J Dermatol Surg Oncol. 1983; 9:981–6.
crossref
22. Jung HJ, Kweon SS, Lee JB, Lee SC, Yun SJ. A clinicopathologic analysis of 177 acral melanomas in Koreans: relevance of spreading pattern and physical stress. JAMA Dermatol. 2013; 149:1281–8.
crossref
23. Minagawa A, Omodaka T, Okuyama R. Melanomas and mechanical stress points on the plantar surface of the foot. N Engl J Med. 2016; 374:2404–6.
crossref
24. Costello CM, Pittelkow MR, Mangold AR. Acral melanoma and mechanical stress on the plantar surface of the foot. N Engl J Med. 2017; 377:395–6.
crossref
25. Gandini S, Sera F, Cattaruzza MS, Pasquini P, Picconi O, Boyle P, et al. Meta-analysis of risk factors for cutaneous melanoma: II. Sun exposure. Eur J Cancer. 2005; 41:45–60.
crossref
26. World Health Organization. The global health observatory: Data>GHO>Indicators>UV radiation [Internet]. Geneva: World Health Organization;2020. [cited 2020 Sep 15]. Available from: https://www.who.int/data/gho/data/indicators/indicator-details/GHO/uv-radiation .
27. Johnson-Obaseki SE, Labajian V, Corsten MJ, McDonald JT. Incidence of cutaneous malignant melanoma by socioeconomic status in Canada: 1992–2006. J Otolaryngol Head Neck Surg. 2015; 44:53.
crossref
28. van der Aa MA, de Vries E, Hoekstra HJ, Coebergh JW, Siesling S. Sociodemographic factors and incidence of melanoma in the Netherlands, 1994–2005. Eur J Cancer. 2011; 47:1056–60.
crossref
29. Warren Andersen S, Blot WJ, Lipworth L, Steinwandel M, Murff HJ, Zheng W. Association of race and socioeconomic status with colorectal cancer screening, colorectal cancer risk, and mortality in Southern US adults. JAMA Netw Open. 2019; 2:e1917995.
crossref
30. Demidenko E. The p-value you can’t buy. Am Stat. 2016; 70:33–8.
31. Geller AC, Miller DR, Lew RA, Clapp RW, Wenneker MB, Koh HK. Cutaneous melanoma mortality among the socioeconomically disadvantaged in Massachusetts. Am J Public Health. 1996; 86:538–43.
crossref
32. Hopkins ZH, Moreno C, Carlisle R, Secrest AM. Melanoma prognosis in the United States: Identifying barriers for improved care. J Am Acad Dermatol. 2019; 80:1256–62.
crossref
33. Gillgren P, Brattstrom G, Frisell J, Persson JO, Ringborg U, Hansson J. Effect of primary site on prognosis in patients with cutaneous malignant melanoma: a study using a new model to analyse anatomical locations. Melanoma Res. 2005; 15:125–32.
crossref
34. Howard MD, Wee E, Wolfe R, McLean CA, Kelly JW, Pan Y. Anatomic location of primary melanoma: Survival differences and sun exposure. J Am Acad Dermatol. 2019; 81:500–9.
crossref
35. Berwick M, Armstrong BK, Ben-Porat L, Fine J, Kricker A, Eberle C, et al. Sun exposure and mortality from melanoma. J Natl Cancer Inst. 2005; 97:195–9.
crossref
36. Balzi D, Carli P, Giannotti B, Buiatti E. Skin melanoma in Italy: a population-based study on survival and prognostic factors. Eur J Cancer. 1998; 34:699–704.
crossref
37. El Sharouni MA, Witkamp AJ, Sigurdsson V, van Diest PJ, Louwman MW, Kukutsch NA. Sex matters: men with melanoma have a worse prognosis than women. J Eur Acad Dermatol Venereol. 2019; 33:2062–7.
crossref

Fig. 1
Comparisons between solar irradiation and melanoma incidence during 2004–2017 in South Korea. ( A) Heatmap with the average value of solar irradiation by the district. The scale bar denotes the annual average solar irradiation quantity ( MJ/m2). ( B) Heatmap of melanoma incidence. The melanoma incidence is shown by high sun-exposed sites, low sun-exposed sites, and both together. The scale bar denotes the incidence of melanoma per 100,000/year. (C) Results of the Pearson’s correlation analysis between solar irradiation and melanoma incidence. High sun-exposed sites and low sun-exposed sites were linearly related significantly ( Pearson correlation coefficient 0.702 for high sun-exposed sites and 0.549 for sun and low sun-exposed sites, and 0.637 for high and low sun-exposed sites).
crt-2021-871f1.gif
Fig. 2
Changes in melanoma incidence according to income. As income estimated from insurance premium data increased, melanoma incidence per 100,000/yr also increased (p < 0.05).
crt-2021-871f2.gif
Fig. 3
Correlation analysis between incidence, mortality, and Korea regional healthcare ranking score (HRS) during 2004–2017 in South Korea. (A) Heatmap with average the value of the regional HRS by the district. The scale bar denotes the HRS evaluated by the Korea Health Promotion Institute. (B) Heatmap of melanoma incidence and mortality. (C) Results of Pearson’s correlation analysis between incidence, mortality, and Korea regional HRS. The correlations were significant (p < 0.001; incidence Pearson’s correlation coefficient [PCC], 0.613 and p < 0.001; mortality PCC, 0.840).
crt-2021-871f3.gif
Fig. 4
The 5-year survival rate of melanoma. Survival analyses result using the Kaplan-Meier method. After the log-rank test, the 5-year survival rate of women was better than that of men (78.4% vs. 72.8%) (p < 0.001). That declined with age (p < 0.001; < 50, 90.6%; 50–79, 75.4%; ≥ 80, 50.2%). Patients with melanoma in low sun-exposed sites had shorter survival than those with melanoma in high sun-exposed sites (p < 0.001; 75.9% vs. 79.4%). The higher income was better survival rate than the lower income (p < 0.001; Q1–5, 72.9%; Q6–10, 74.3%; Q11–15, 74.8%; Q16–20, 74.7%).
crt-2021-871f4.gif
Fig. 5
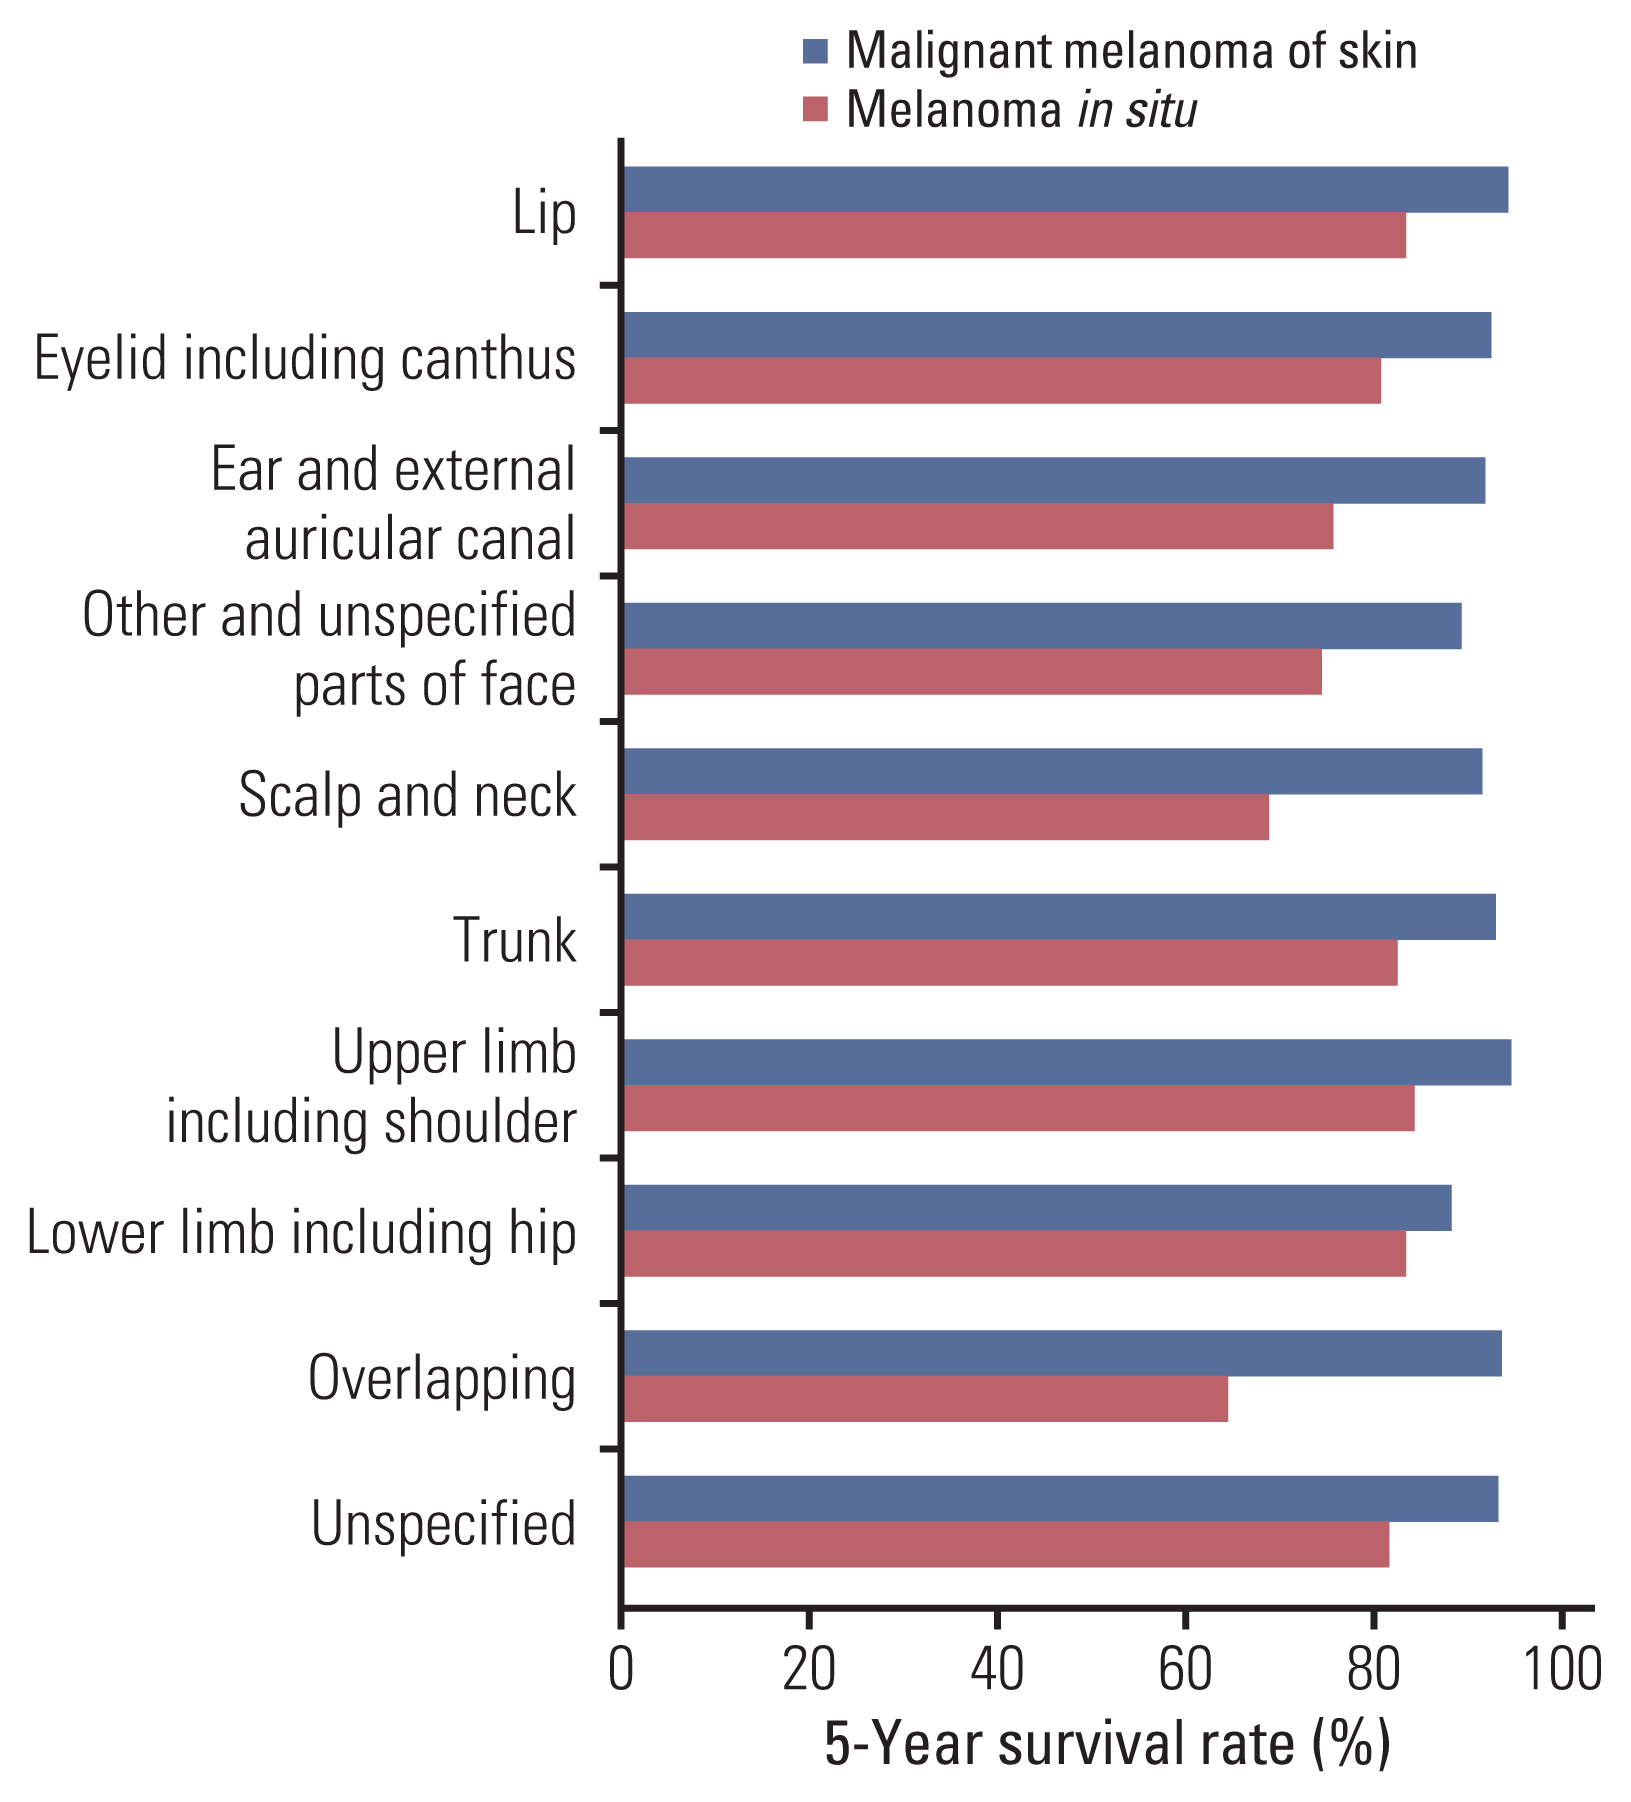
Five-year survival rate of melanoma by anatomical locations. Survival analyses result using Kaplan-Meier method. After the log-rank test, the 5-year survival rate of overlapping malignant melanoma of skin (C43.8) was lower than the other anatomical locations in C43 (Malignant melanoma of skin) (64.5%). In D03 (Melanoma in situ), D03.7 (Melanoma in situ of lower limb, including hip) had the lowest survival rate (88.2%).
crt-2021-871f5.gif
Table 1
Incidence and prevalence of melanoma by sex and age in South Korea, 2004–2017
Age (yr) Incidence Prevalence Incidence per 100,000/yr Prevalence per 100,000/yr


Total Male Female Total Male Female Total Male Female Total Male Female
Total 25,591 11,783 13,808 49,035 22,254 26,781 2.6 1.2 1.4 4.8 2.2 2.6

0–4 112 65 47 122 70 52 0.6 0.3 0.2 0.6 0.4 0.3

5–9 215 115 100 240 126 114 0.8 0.4 0.4 0.9 0.5 0.4

10–14 273 126 147 331 153 178 0.8 0.4 0.4 1.0 0.5 0.5

15–19 367 186 181 445 228 217 1.0 0.5 0.5 1.2 0.6 0.6

20–24 528 241 287 681 318 363 1.2 0.6 0.7 1.6 0.7 0.8

25–29 654 271 383 873 397 476 1.5 0.6 0.9 2.0 0.9 1.1

30–34 807 338 469 1,203 527 676 1.2 0.5 0.7 1.8 0.8 1.0

35–39 1,069 439 630 1,807 786 1,021 1.5 0.6 0.9 2.6 1.1 1.5

40–44 1,230 550 680 2,252 1,045 1,207 1.7 0.8 0.9 3.1 1.4 1.7

45–49 1,583 708 875 3,165 1,379 1,786 2.2 1.0 1.2 4.4 1.9 2.5

50–54 1,987 964 1,023 4,245 2,006 2,239 2.6 1.3 1.4 5.6 2.6 2.9

55–59 2,275 1,139 1,136 5,061 2,454 2,607 3.0 1.5 1.5 6.5 3.2 3.3

60–64 2,474 1,263 1,211 5,487 2,643 2,844 4.2 2.1 2.0 9.1 4.4 4.7

65–69 2,575 1,341 1,234 5,498 2,663 2,835 4.0 2.1 1.9 8.5 4.1 4.4

70–74 2,847 1,459 1,388 5,809 2,779 3,030 3.7 1.9 1.8 7.5 3.6 3.9

75–79 2,721 1,241 1,480 5,196 2,335 2,861 2.5 1.2 1.4 4.7 2.1 2.6

≥80 3,874 1,337 2,537 6,620 2,345 4,275 3.8 1.3 2.5 6.3 2.2 4.0
Table 2
Age-standardized incidence and prevalence rates of melanoma in South Korea, 2004–2017
Year Incidence Prevalence Incidence per 100,000/yr Prevalence per 100,000/yr


Total Male Female Total Male Female Total Male Female Total Male Female
2004 1,450 694 756 2,006 931 1,075 2.6 1.3 1.4 3.6 1.7 1.9

2005 1,419 679 740 2,135 1,002 1,133 2.5 1.2 1.3 3.7 1.7 1.9

2006 1,497 703 794 2,393 1,123 1,270 2.5 1.2 1.3 4.0 1.9 2.1

2007 1,725 834 891 2,806 1,335 1,471 2.8 1.4 1.4 4.5 2.1 2.3

2008 1,615 775 840 2,869 1,369 1,500 2.5 1.2 1.3 4.4 2.1 2.3

2009 1,513 696 817 2,971 1,342 1,629 2.3 1.0 1.2 4.4 2.0 2.4

2010 1,641 740 901 3,230 1,428 1,802 2.4 1.1 1.3 4.6 2.1 2.6

2011 1,847 841 1,006 3,566 1,613 1,953 2.6 1.2 1.4 4.9 2.3 2.7

2012 1,834 839 995 3,737 1,679 2,058 2.5 1.2 1.3 5.0 2.3 2.7

2013 1,884 850 1,034 3,979 1,786 2,193 2.5 1.2 1.4 5.2 2.4 2.8

2014 2,170 990 1,180 4,402 1,985 2,417 2.8 1.3 1.5 5.5 2.5 3.0

2015 2,107 961 1,146 4,530 2,038 2,492 2.6 1.2 1.4 5.4 2.5 2.9

2016 2,436 1,074 1,362 5,027 2,235 2,792 3.0 1.4 1.6 5.9 2.7 3.2

2017 2,453 1,107 1,346 5,384 2,388 2,996 3.0 1.4 1.6 6.2 2.8 3.4
Table 3
Characteristics of melanoma patients by anatomical location
Anatomical location Sex, n (%) Age (yr) (mean±SD) Income distribution by insurance premium, n (%)


Male Female Q1–5 Q6–10 Q11–15 Q16–20 Indistinguishable
C430: Lip 139 (44.1) 176 (55.9) 63.1±16.5 52 (16.5) 43 (13.7) 74 (23.5) 112 (35.6) 34 (10.8)

C431:Eyelid, including canthus 331 (42.1) 455 (57.9) 61.3±18.7 111 (14.1) 138 (17.6) 168 (21.4) 294 (37.4) 75 (9.5)

C432: Ear and external auricular canal 234 (51.1) 224 (48.9) 63.5±17.5 76 (16.6) 77 (16.8) 96 (21.0) 167 (36.5) 42 (9.2)

C433: Other and unspecified parts of face 1,087 (43.3) 1,423 (56.7) 68.6±16.2 425 (16.9) 363 (14.5) 532 (21.2) 923 (36.8) 267 (10.6)

C434: Scalp and neck 547 (54.8) 452 (45.2) 62.2±17.8 153 (15.3) 141 (14.1) 255 (25.5) 372 (37.2) 78 (7.8)

D030: Lip 65 (39.6) 99 (60.4) 52.6±20.6 18 (11.0) 23 (14.0) 47 (28.7) 62 (37.8) 14 (8.5)

D031: Eyelid, including canthus 157 (41.4) 222 (58.6) 55.8±21.7 70 (18.5) 66 (17.4) 93 (24.5) 123 (32.5) 27 (7.1)

D032: Ear and external auricular canal 172 (52.8) 154 (47.2) 52.8±21.7 64 (19.6) 52 (16.0) 65 (19.9) 115 (35.3) 30 (9.2)

D033: Other and unspecified parts of face 489 (47.1) 550 (52.9) 59.6±21.2 196 (18.9) 157 (15.1) 234 (22.5) 364 (35.0) 88 (8.5)

D034: Scalp and neck 328 (52.4) 298 (47.6) 54.3±20.9 105 (16.8) 105 (16.8) 154 (24.6) 224 (35.8) 38 (6.1)

C435: Trunk 917 (45.2) 1,110 (54.8) 59.2±16.9 322 (15.9) 336 (16.6) 452 (22.3) 757 (37.3) 160 (7.9)

C436: Upper limb, including shoulder 513 (46.8) 584 (53.2) 60.0±17.2 164 (14.9) 201 (18.3) 249 (22.7) 406 (37.0) 77 (7.0)

C437: Lower limb, including hip 1,338 (49.7) 1,354 (50.3) 62.4±16.1 432 (16.0) 438 (16.3) 662 (24.6) 975 (36.2) 185 (6.9)

C438: Overlapping malignant melanoma of skin 288 (48.3) 308 (51.7) 61.8±16.0 94 (15.8) 103 (17.3) 141 (23.7) 212 (35.6) 46 (7.7)

C439: Unspecified 6,491 (47.0) 7,332 (53.0) 61.4±17.9 2,147 (15.5) 2,174 (15.7) 3,133 (22.7) 5,331 (38.6) 1,038 (7.5)

D035: Trunk 406 (47.7) 445 (52.3) 54.7±19.8 147 (17.3) 139 (16.3) 188 (22.1) 310 (36.4) 67 (7.9)

D036: Upper limb, including shoulder 176 (42.7) 236 (57.3) 54.3±22.1 80 (19.4) 61 (14.8) 80 (19.4) 156 (37.9) 35 (8.5)

D037: Lower limb, including hip 331 (47.9) 360 (52.1) 56.4±18.7 115 (16.6) 106 (15.3) 162 (23.4) 264 (38.2) 44 (6.4)

D038: Other sites 543 (40.6) 796 (59.4) 55.0±19.9 213 (15.9) 232 (17.3) 281 (21.0) 506 (37.8) 107 (8.0)

D039: Unspecified 868 (40.0) 1,303 (60.0) 54.2±20.0 338 (15.6) 309 (14.2) 486 (22.4) 858 (39.5) 180 (8.3)

Total 11,783 (46.0) 13,808 (54.0) 63.1±16.5 4,078 (15.9) 5,778 (22.6) 9,621 (37.6) 4,026 (15.7) 2,088 (8.2)

SD, standard deviation.

Table 4
Multivariate analyses for the association with the incidence or mortality of melanoma
Variable Incidence per 100,000/yr Mortality per 100,000/yr
Anatomic sites Total
Low sun-exposed High sun-exposed
Intercept −1.295 (1.890) −1.766 (0.573) −3.244 (2.316) −2.733 (0.767)
SID −0.026 (0.029) −0.014 (0.009) −0.036 (0.036) 0.008 (0.012)
HRS 0.091 (0.041)* 0.059 (0.012)*** 0.156 (0.050)** 0.082 (0.017)***
Adj R-squared 0.160 0.573 0.334 0.674
p-value 0.116 0.001 0.023 < 0.001

Values are presented as estimate (standard error). HRS, healthcare ranking score; SID, solar irradiation dose.

* p < 0.05,

** p < 0.01,

*** p < 0.001.

Anatomic sites was divided into low sun-exposed sites (Non-sun: C43.5–43.9, D03.5–D03.9 by ICD-10), high sun-exposed sites (Sun: C43.0–43.4, D03.0–D03.4 by ICD-10) or together (total).

Table 5
The annual mortality rate of melanoma in South Korea, 2004–2017
Year Prevalence Death Mortality ratea) (%)
2004 2,006 192 9.6
2005 2,135 185 8.7
2006 2,393 262 10.9
2007 2,806 280 10.0
2008 2,869 302 10.5
2009 2,971 318 10.7
2010 3,230 312 9.7
2011 3,566 323 9.1
2012 3,737 364 9.7
2013 3,979 372 9.3
2014 4,402 397 9.0
2015 4,530 407 9.0
2016 5,027 394 7.8
2017 5,384 462 8.6

a) (Mortality cases/Prevalent cases)×100.

Table 6
Multiple logistic regression for mortality
Variable aORa) 95% CI p-value
Sex (ref. male) 0.008 0.006–0.011 < 0.001
Age 0.597 0.561–0.634 < 0.001
Income (ref. Q1–5) 1.063 1.061–1.065 < 0.001
 Q6–10 1.033 0.932–1.146 0.535
 Q11–15 0.899 0.818–0.989 0.029
 Q16–20 0.821 0.753–0.895 < 0.001
SID 0.995 0.984–1.006 0.345
HRS 1.016 1.008–1.023 < 0.001

aOR, adjusted odds ratio; CI, confidence interval; HRS, healthcare ranking score; SID, solar irradiation dose.

a) Adjustment for sex, age, income, SID, and HRS.

TOOLS
Similar articles