Journal List > Cancer Res Treat > v.54(3) > 1516078552

Min, Chang, and Sung: Emergency Department Utilization of Adult Cancer Patient in Korea: A Nationwide Population-Based Study, 2017-2019

Abstract

Purpose

The current study aimed to identify the overall characteristics of cancer-related emergency department (ED) visits by adult in Korea, including analyses of factors associated with ED stay time and outcomes nationwide.

Materials and Methods

We collected data on cancer-related ED visits from the National Emergency Department Information System (NEDIS) database between 2017 and 2019.

Results

ED visits by cancer patients comprised 5.5% (667,935 visits) of total ED visits from 2017 to 2019, which was slightly higher than in other counties. Patients with cancer who visited the ED were over 50 years old, the majority being males, and patients with cancer visited EDs in certified tertiary hospitals more frequently than patients without cancer. In multivariate analyses, the adjusted odds ratio for a length of stay more than 8 hours in the ED of certified tertiary hospitals was 126.34 (95% confidence interval, 1.422 to 1.460) when compared to hospitals. Nevertheless, the longer the patients stayed in the ED, the more likely they were to be admitted.

Conclusion

The longer ED stay and higher proportion of cancer patient hospitalizations suggest that cancer patients visit ED to be admitted as well as to receive acute care. The frequency of ED visits and admission may be adjusted to some extent depending on outpatient education, such as self-management of symptoms and situations. Improving cancer care in local communities should be met though provisions such as linking treatment between hospitals or supplying appropriate medical personnel, even for the efficient use of ED resources in hospitals.

Introduction

More cancer patients seem to visit the emergency department (ED) for acute care in Korea. This may be due, in part, to an increase in the number of outpatient clinics for systemic chemotherapy, which has inevitably raised the occurrence of cancer-related emergencies [1]. Recent studies have shown that many patients visit the ED for various symptoms and management issues caused by cancer treatment, as well as typical oncologic emergencies such as febrile neutropenia, malignant pericardial effusion, and tumor lysis syndrome [24]. About 6.3% of patients discharged from the index hospitalization and 10% of patients receiving cancer treatment in outpatient clinics were reported to have visited the ED four or more times in a year. These patients are referred to as frequent attenders of the ED [5,6].
Apparently, EDs should be considered as the main route for accessing cancer care [1]. The ED currently plays an important role in continuing cancer treatment because many cases of cancer-related ED visits result in hospital admission [1,2,7]. Moreover, ED utilization by cancer patients should be examined simultaneously in terms of the effective operation of the ED. A higher ED occupancy of cancer patients may lead to overcrowding in the ED and resource depletion for non-oncologic emergencies.
For both the service provision of suitable cancer care in the ED and the more effective operation of the ED, it is necessary first to comprehensively understand the ED utilization status by cancer patients. However, national data on ED utilization by cancer patients in Korea have not yet been analyzed. Only a few previous reports investigated cancer-related ED visits at a single institution level, and found that cancer-related ED visits comprised 25.5% of all visits in a tertiary hospital [8], and cancer-related frequent attenders accounted for 50.3% of all frequent attenders of the ED [9]. Thus, the current study aimed to identify the national characteristics, length of stay (LOS), and hospitalizations of cancer-related ED visits using the National Emergency Department Information System (NEDIS) database, a national ED-based patient registry in Korea, including analyses of factors associated with staying time and outcomes of ED nationwide.

Materials and Methods

1. Data source

We used the NEDIS database from 2017 to 2019. In brief, the NEDIS database was established in 2003 on the basis of Article 15 of the Emergency Medical Service Act to evaluate the quality of emergency medical services and provide evidence for the development of a national emergency care plan. Since 2016, over 95% of EDs in Korea have participated in the NEDIS database and transmitted information about visiting patient. The annual number of EDs participating in the NEDIS database was 413 out of 416 in 2017 (99.3%), 399 out of 401 in 2018 (99.5%), and 401 out of 402 in 2019 (99.8%). The NEDIS database design and variables have been described in detail elsewhere [10,11].

2. Study population

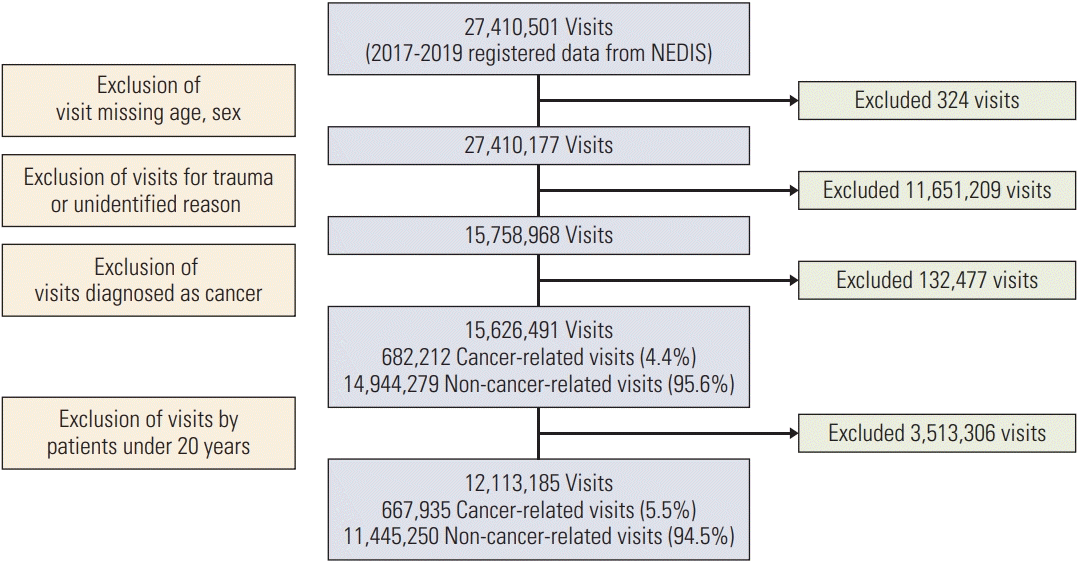
We included ED visits by patients over the age of 20. The initial dataset from January 2017 to December 2019 contained a total of 27,410,510 discharge records of ED visits. Visits with missing age (324 visits) and sex (0 visits) information and visits for trauma treatment or unidentified reasons (11,651,209 visits) were sequentially excluded. Cancer related ED visits were defined as cases recorded from C00 to C96 in the primary or secondary ED diagnosis using the Korean Classification of Diseases, 7th revision (KCD-7), which is a modified version of the International Classification of Diseases, the 10th revision (ICD-10). In Korea, patients being treated for cancer should be enrolled in electronic medical records with an accurate cancer diagnosis to receive special benefits from the National Health Insurance (NHI). As the study aimed to investigate ED visits of cancer patients who were being treated, cases that were not coded as cancer in the ED but were subsequently coded as cancer after hospitalization were excluded. After the exclusion of 3,513,306 visits by cancer patients aged under 19, the final number of study subjects included 667,935 cancer-related visits and 11,445,250 non-cancer-related visits out of a total of 12,113,185 visits (Fig. 1).

3. Variables

The data contained demographic characteristics such as age, sex, insurance status, and information about ED utilization, including ED type, ED region, hospital service level, arrival time, and patient transportation. Clinical variables of initial triage scale, vital signs, primary cancer type, disposition, ED diagnosis, and diagnosis after hospitalization were also included. Initial triage was designated according to the Korean Triage and Acuity Scale (KTAS), which prioritizes patients according to the five ordinal scales reflecting both clinical severity and acuity (resuscitation, emergent, urgent, less urgent, non-urgent). For service level of hospital (certified tertiary hospital, general hospital, hospital), we applied the classification of the Medical Law of Korea (https://www.law.go.kr/laws/medical law). A “hospital” is a medical institution with 30 or more beds and provides treatment mainly for inpatients, and a “general hospital” has more than 100 beds with some requirements for more than or less than 300 beds. “Certified tertiary hospital” specializes in medical treatment with high difficulty for severe diseases, which can be designated by the Ministry of Health and Welfare of Korea. The variables of insurance status (NHI, Medicaid, uninsured), type of ED (regional emergency center, local emergency center, local emergency institution), region of ED (metropolitan city, province), mode of arrival (ambulance, non-ambulance), time of arrival (9 am–6 pm, 6 pm–9 am), LOS in the ED (under 2 hours, 2–3 hours, 4–7 hours, more than 8 hours), disposition (discharged to home, transferred to another hospital, admitted, death in the ED), and admission destination (general ward, intensive care unit) were categorized.

4. Statistical analysis

We compared the demographic, clinical, and disposition characteristics between cancer-related and non-cancer-related visits. Among the cancer-related visits, we assessed differences according to the hospital service level. Comparisons between the groups were performed using chi-squared test on categorical variables; continuous variables were categorized as described above. We also calculated frequency and percentage of the most common cancer type and primary diagnosis for the cancer-related visits.
Multivariate analysis was conducted to investigate the independent predictors associated with the LOS in ED and hospital admission. For hospital admission, potential predictors including age, sex, insurance status, ED region, hospital service level, time of arrival, mode of arrival, KTAS classification, and LOS. Disposition status were tested with univariate logistic regression analysis and entered to multivariate model with forward stepwise entry of statistically significant parameters. A similar analysis was performed with prolonged LOS. The prolonged LOS defined as LOS in ED more than 8 hours based on existing literature [12,13].
All tests were two-tailed, and results with p-values < 0.05 were considered statistically significant. All data preparation and statistical analyses were conducted using SAS ver. 9.4 (SAS Institute Inc., Cary, NC).

Results

1. General characteristics of ED visits for cancer-related visits compared to non-cancer-related visits

ED visits by cancer patients comprised 5.5% (667,935 visits) of total ED visits from 2017 to 2019. The number of ED visits would not have been underestimated because visits for trauma treatment or unidentified reasons were all excluded in non-cancer-related visits, and the diagnostic code for cancer in the ED was perceived as relatively accurate to provide patients with a special benefit from NHI. Male cancer patients visited the ED more frequently than female cancer patients (57.9% vs. 42%) (Table 1). Cancer patients were more likely than non-cancer patients to visit larger hospitals, such as EDs in certified tertiary hospitals (67.5% vs. 30.4%). Cancer-related ED visits were more concentrated during the daytime than in the evening, and 29% of cancer patients stayed in the ED longer than eight hours. Cancer patients stayed in the ED for an average of 8.7 hours (±17 hours) and while non-cancer patients stayed for 3.5 hours (±8.3 hours). When the average LOS in the ED was multiplied by the number of visits, cancer-related visits comprised 12.7% of total ED visits by time. Approximately half of ED visits by cancer patients led to hospitalization (50.4%).
The most common cancer-related ED visits were for patients with lung cancer (14.1%) and liver cancer (12.2%) (Table 2). ED visits associated with colon, stomach, breast, and pancreatic cancers followed. Patients with cancer exhibited a range of primary or secondary ED diagnoses (Table 3), including fever, pneumonia, abdominal and pelvic pain, other gastroenteritis and colitis, paralytic ileus, and intestinal obstruction.

2. Cancer-related ED visits by hospital service level

The characteristics of cancer-related visits were displayed by a subgroup of hospital levels in Table 3 because the rate of cancer-related ED visits varied greatly by hospital service levels in Table 1. After further exclusion of cases missing the LOS in the ED and cases in Sejong City (administrative capital) in consideration of the specificity, a total of 667,864 visits were analyzed. A higher proportion of male visits is associated with lower hospital service levels. Higher hospital service levels are associated with more daytime visits, longer ED stays, and higher KTAS levels. The proportion of visits that lasted longer than eight hours in certified tertiary hospitals was 36.3%, compared to 14.3% in general hospitals. However, the proportion of admitted cases in certified tertiary hospital (45.2%) was slightly lower than in general hospitals (48.0%).

3. Multivariate logistic regression analyses for prolonged LOS and hospital admission

According to multivariate analyses, cancer patients stayed longer in EDs located in metropolitan cities (adjusted odds ratio [aOR], 1.44; 95% confidence interval [95% CI], 1.422 to 1.460) than in provinces, and cancer patients without insurance were hospitalized less (aOR, 0.80; 95% CI, 0.708 to 0.892) than NHI patients (Table 4). Hospital service level was the most significant factor associated with the LOS of cancer patients in the ED. The aOR for a prolonged LOS was 126.34 (95% CI, 89.446 to 178.448) in the ED of certified tertiary hospitals compared to hospitals. Patients who visited the ED during the daytime stayed for a shorter amount of time in the ED and were admitted more than those who visited the ED in the evening. The aOR for admission in certified tertiary hospitals was lower than that of general hospitals and hospitals, although a more critical clinical status according to the KTAS classification was significantly associated with a higher admission rate (Table 4). Nevertheless, the longer patients stayed in the ED, the more likely they were to be admitted.

Discussion

According to data analyzed between 2017 to 2019, the proportion of adult cancer-related ED visits in Korea was slightly higher than in other countries. Previous results from the United States reported that 1.2%–4.2% of adult ED visits were related to cancer [1,2,4], and 2.8% of ED visits were related to cancer in a French nationwide study [14]. Cancer patients who visited the ED were over 50 years old with a more predominance, and they visited EDs in certified tertiary hospitals more frequently than EDs in other hospital service level. Importantly, the longer ED stay and higher proportion of cancer patient hospitalizations suggest that cancer patients visit ED to be admitted as well as to receive acute care, at least in certified tertiary hospitals.
There were more cancer-related ED visits, especially for those with lung cancer, liver cancer, colorectal and stomach cancers, and breast cancer. To some extent, this may reflect the frequency of cancer occurrence in Korea, and the occurrence of an emergency based on the severity of a specific cancer type [4]. For example, many ED visits related to lung cancer suggested that lung cancer patients suffered more from acute symptoms, probably due to the rapid progression of their cancer or the side effects of chemotherapy. Although fever was the most common cause of cancer-related ED visits in the current study, many prior studies have reported pain as the primary reason for ED visits, followed by digestive and respiratory symptoms [3,7,8].
Consistent with the findings of this study, clinical practitioners have observed the ED situation, in which the higher the level of hospital service, the more crowded EDs are with cancer patients. The results indicated that from 2017 to 2019, 67.5% (450,671 visits) of cancer-related visits were to certified tertiary hospitals, and 36.3% (163,584 visits) of those ED visits in Korea lasted for more than 8 hours. Even after excluding the effects of clinical severity by KTAS classification, patients stayed significantly longer in the EDs of certified tertiary hospitals. A previous domestic study in a tertiary hospital reported that about 57.6% of cancer patients stayed in the ED for more than 6 hours, and the average LOS was 20.1 hours [15]. The reasons for lengthy ED stay included delayed clinical decisions, shortage of hospital beds, and delayed transfers to other hospitals [16]. The results suggest that patients were more likely to be admitted if they stayed longer in the ED, and it seems that cancer patients may visit the ED of certified tertiary hospitals for admission during the daytime and wait a long time for a hospital bed. Recently, Phillip et al. [17], reported that patients with advanced stage cancer visited the ED due to worsening symptoms, and because the ED visit was known as a quick way to get admitted.
The overall proportion of admission for cancer patients in ED was 45.9% in the present study, which was between 28.8% and 59.7% of two recent results from the U.S. nationwide studies [1,2]. In comparison, 48.5% of ED cancer patients in total and 48.6% of ED cancer patients treated in certified tertiary hospitals were discharged home in the current study. In a previous study, 31% of cancer patients who visited the ED were admitted; however, the authors described that only 8.2% of cancer-related ED visits and 26% of admitted patients were oncologic emergencies [18]. Even during non-emergencies, cancer patients are more likely to visit the ED, when they experience unexpected symptoms and clinical situations. Aprile et al. [19], reported that 21.6% of unplanned hospital presentations by cancer outpatients were caused by the patients’ seeking reassurance from their treating specialist. The frequency of ED visits and admissions may be adjusted to some extent depending on outpatient and discharge education, such as self-management for possible symptoms and situations. Tertiary hospitals with a high number of cancer patients visiting the ED may be able to operate a separate clinic in the ED, as has been reported in some cases [20,21].
In addition, general hospitals and hospitals in local communities had higher rates of admission for cancer patients than certified tertiary hospitals. There may be some reasons to hospitalize patients, such as lenient criteria for admission, a lack of medical staff to examine cancer patients in the ED, or that the patient is unable to receive care at home. It might be technically and structurally difficult for hospitals in local communities to care for patients with cancer after systemic treatment. In order to provide suitable care, primary care services need to secure appropriate medical personnel, connect with the hospital where the patient was treated to obtain proper information, or operate palliative care independently.
The most important limitation of the dataset is its inability to differentiate the stages of cancer at each visit and connect data with the clinical history of chemotherapy. Because the study was based on anonymized data, it was impossible to determine repeated visits by the same patient. Prospective studies are needed to answer more specific questions regarding the ED care of patients with cancer. In addition, ED diagnosis and coding of the material may have been recorded inaccurately.
Generally, the current result quantified the reality that cancer patients have to wait a long time for hospitalization and treatment in the ED of a certified tertiary hospital, and it indicated that cancer patients visit ED to be admitted as well as to receive acute care, and that the ED of a certified tertiary hospital may be overcrowded with cancer patients. Patients often experience delays in treatment and management with other concerns and uncertainties in the ED [18]. Hospitals should provide adequate outpatient management to prevent avoidable ED visits and specialty consultation in various ways after systemic treatment. In terms of the medical provision system, improving the care of cancer patients in the local community requires provisions, such as linking treatment between hospitals or supplying appropriate medical personnel, even for the efficient use of ED resources in hospitals.

Notes

Ethical Statement

This study protocol was approved by the Institutional Review Board of the National Medical Center (approval number: NMC-2011-086); the requirement for written informed consent was waived because of the retrospective nature of the study.

Author Contributions

Conceived and designed the analysis: Min HS, Chang HJ, Sung HK.

Collected the data: Min HS, Sung HK.

Contributed data or analysis tools: Min HS, Chang HJ.

Performed the analysis: Min HS.

Wrote the paper: Min HS.

Supervision and revision of the manuscript: Chang HJ, Sung HK.

Conflicts of Interest

Conflict of interest relevant to this article was not reported.

References

1. Rivera DR, Gallicchio L, Brown J, Liu B, Kyriacou DN, Shelburne N. Trends in adult cancer-related emergency department utilization: an analysis of data from the nationwide emergency department sample. JAMA Oncol. 2017; 3:e172450.
2. Hsu J, Donnelly JP, Moore JX, Meneses K, Williams G, Wang HE. National characteristics of emergency department visits by patients with cancer in the United States. Am J Emerg Med. 2018; 36:2038–43.
crossref
3. Caterino JM, Adler D, Durham DD, Yeung SJ, Hudson MF, Bastani A, et al. Analysis of diagnoses, symptoms, medications, and admissions among patients with cancer presenting to emergency departments. JAMA Netw Open. 2019; 2:e190979.
crossref
4. Scholer AJ, Mahmoud OM, Ghosh D, Schwartzman J, Farooq M, Cabrera J, et al. Improving cancer patient emergency room utilization: a New Jersey state assessment. Cancer Epidemiol. 2017; 51:15–22.
crossref
5. Wong TH, Lau ZY, Ong WS, Tan KB, Wong YJ, Farid M, et al. Cancer patients as frequent attenders in emergency departments: a national cohort study. Cancer Med. 2018; 7:4434–46.
crossref
6. Dufton PH, Drosdowsky A, Gerdtz MF, Krishnasamy M. Socio-demographic and disease related characteristics associated with unplanned emergency department visits by cancer patients: a retrospective cohort study. BMC Health Serv Res. 2019; 19:647.
crossref
7. Mayer DK, Travers D, Wyss A, Leak A, Waller A. Why do patients with cancer visit emergency departments? Results of a 2008 population study in North Carolina. J Clin Oncol. 2011; 29:2683–8.
crossref
8. Jung M. Research on the actual conditions of cancer patients in the emergency room in a university hospital in Seoul. Seoul: The Graduate School of Information in Clinical Nursing, Hanyang University;2009.
9. Shin TG, Song JW, Song HG, Hong CK. Characteristics of frequent users of emergency department. J Korean Soc Emerg Med. 2011; 22:86–92.
10. Sung HK, Paik JH, Lee YJ, Kang S. Impact of the COVID-19 outbreak on emergency care utilization in patients with acute myocardial infarction: a nationwide population-based study. J Korean Med Sci. 2021; 36:e111.
crossref
11. Ryu JH, Min MK, Lee DS, Yeom SR, Lee SH, Wang IJ, et al. Changes in relative importance of the 5-level triage system, Korean Triage and Acuity Scale, for the disposition of emergency patients induced by forced reduction in its level number: a multi-center registry-based retrospective cohort study. J Korean Med Sci. 2019; 34:e114.
crossref
12. Liew D, Liew D, Kennedy MP. Emergency department length of stay independently predicts excess inpatient length of stay. Med J Aust. 2003; 179:524–6.
crossref
13. Warren MB, Campbell RL, Nestler DM, Pasupathy KS, Lohse CM, Koch KA, et al. Prolonged length of stay in ED psychiatric patients: a multivariable predictive model. Am J Emerg Med. 2016; 34:133–9.
crossref
14. Peyrony O, Fontaine JP, Beaune S, Khoury A, Truchot J, Balen F, et al. EPICANCER-cancer patients presenting to the emergency departments in France: a prospective nationwide study. J Clin Med. 2020; 9:1505.
crossref
15. Lee J. A study on the characteristics of cancer patients in emergency center. Seoul: The Graduate School, Chung-Ang University;2018.
16. Ha BH, Park JY. Triage and length of stay in a cancer center emergency department. Asian Oncol Nurs. 2017; 17:246–51.
crossref
17. Philip J, Remedios C, Breen S, Weiland T, Willenberg L, Boughey M, et al. The experiences of patients with advanced cancer and caregivers presenting to emergency departments: a qualitative study. Palliat Med. 2018; 32:439–46.
crossref
18. Diaz-Couselo FA, O’Connor JM, Nervo A, Tossen G, Guercovich A, Puparelli C, et al. Non-scheduled consultation in oncologic patients. How many of them are true emergencies? An observational prospective study. Support Care Cancer. 2004; 12:274–7.
crossref
19. Aprile G, Pisa FE, Follador A, Foltran L, De Pauli F, Mazzer M, et al. Unplanned presentations of cancer outpatients: a retrospective cohort study. Support Care Cancer. 2013; 21:397–404.
crossref
20. Ahn S, Lee YS, Lim KS, Lee JL. Emergency department cancer unit and management of oncologic emergencies: experience in Asan Medical Center. Support Care Cancer. 2012; 20:2205–10.
crossref
21. Hong AS, Froehlich T, Clayton Hobbs S, Lee SJC, Halm EA. Impact of a cancer urgent care clinic on regional emergency department visits. J Oncol Pract. 2019; 15:e501–9.
crossref

Fig. 1
Flowchart for selection of study population. Among a total of 27,410,501 emergency department visits from 2017 to 2019, 667,935 cancer-related visits and 11,445,250 non-cancer-related visits were investigated in the current study. NEDIS, National Emergency Department Information System.
crt-2021-699f1.gif
Table 1
General characteristic of emergency department visits for cancer-related visits compared to non-cancer-related visits
Characteristic Non-cancer-related visits Cancer-related visits p-value
Age (yr)
 20–29 1,613,495 (14.1) 8,274 (1.2) < 0.001
 30–39 1,685,531 (14.7) 26,119 (3.9)
 40–49 1,731,819 (15.1) 64,419 (9.6)
 50–59 2,069,151 (18.1) 137,754 (20.6)
 60–69 1,674,114 (14.6) 181,520 (27.2)
 70–79 1,489,421 (13.0) 166,179 (24.9)
 ≥ 80 1,181,749 (10.3) 83,670 (12.5)
Sex
 Male 5,285,454 (46.2) 387,120 (57.9) < 0.001
 Female 6,159,796 (53.8) 280,815 (42.0)
Insurance status
 National Health Insurance 10,383,048 (90.7) 604,048 (90.4) < 0.001
 Medical Aid 867,271 (7.6) 59,756 (8.9)
 Uninsured 130,147 (1.1) 1,802 (0.3)
 Unknown 64,784 (0.6) 2,329 (0.4)
Hospital service level
 Hospital 370,536 (3.2) 4,630 (1.7) < 0.001
 General hospital 7,480,404 (65.4) 210,765 (31.5)
 Certified tertiary hospital 3,473,736 (30.4) 450,671 (67.5)
 Others/Unknown 120,574 (1.1) 1,869 (0.3)
Regiona)
 Metropolitan city 5,308,075 (46.4) 409,439 (61.3) < 0.001
 Province 6,134,168 (53.6) 258,481 (38.7)
Time of arrival
 6 pm–9 am 6,569,964 (57.4) 269,327 (40.3) < 0.001
 9 am–6 pm 4,875,286 (42.6) 398,608 (59.7)
Mode of arrival
 Ambulance 2,197,299 (19.2) 126,219 (18.9) < 0.001
 Non-ambulance 9,225,551 (80.6) 539,278 (80.7)
 Unknown 22,409 (0.2) 5,093 (0.4)
Length of stay (hr)
 < 2 5,419,527 (47.3) 120,170 (17.9) < 0.001
 2–3 3,580,094 (31.3) 168,194 (25.2)
 4–7 1,610,512 (14.1) 185,821 (27.8)
 ≥ 8 822,277 (7.2) 193,694 (29.0)
 Unknown 12,840 (0.1) 56 (0.01)
KTAS classification
 Not urgent 1,230,649 (10.8) 61,182 (9.2) < 0.001
 Less urgent 4,377,129 (38.2) 191,853 (28.7)
 Urgent 4,377,369 (38.3) 334,436 (50.1)
 Emergent 692,188 (6.1) 48,052 (7.2)
 Resuscitation 151,096 (1.3) 10,157 (1.5)
 Unknown 616,819 (5.4) 22,255 (3.3)
Disposition
 Discharge home 8,538,108 (74.6) 323,807 (48.5) < 0.001
 Transfer to another hospital 208,414 (1.8) 29,998 (4.5)
 Admission 2,583,534 (22.6) 306,760 (45.9)
 Died in ER 82,530 (0.7) 6,047 (0.9)
 Others/Unknown 32,664 (0.3) 1,323 (0.2)
Admission destination
 General ward 1,856,474 (16.2) 261,550 (39.2) < 0.001
 Intensive care unit 434,231 (3.8) 20,605 (3.1)
 Others/Unknown 9,154,545 (79.9) 385,780 (57.8)
Total (n=12,113,185) 11,445,250 (94.5) 667,935 (5.5)

Values are presented as number (%).

a) Excluded cases of Sejong city.

Table 2
Cancer type and primary diagnosis of cancer-related emergency department visits
KCD-7 code No. of visits (%)
Type of cancer
 C34 Lung 102,478 (14.1)
 C22 Liver 88,719 (12.2)
 C18, C20 Colon 70,362 (9.7)
 C16 Stomach 58,129 (8.0)
 C78, C79 Metastatic cancer 51,474 (7.1)
 C50 Breast 47,291 (6.5)
 C25 Pancreas 44,047 (6.1)
 C24 Extrahepatic bile duct 26,884 (3.7)
 C61 Prostate 20,076 (2.8)
 C56 Ovary 17,547 (2.4)
 C67 Urinary bladder 16,547 (2.3)
 C53 Cervix uteri 12,235 (1.7)
 C92 Myeloid leukemia 11,584 (1.6)
 C90 Multiple myeloma 11,572 (1.6)
 C23 Gallbladder 11,177 (1.5)
Primary diagnosis in ED
 R50 Fever of other and unknown origin 23,878 (5.2)
 J18 Pneumonia, organism unspecified 18,712 (4.1)
 R10 Abdominal and pelvic pain 18,269 (4.0)
 A09 Other gastroenteritis and colitis of infectious and unspecified origin 12,647 (2.8)
 K56 Paralytic ileus and intestinal obstruction without hernia 12,119 (2.6)
 K92 Other diseases of digestive system 11,758 (2.6)
 D70 Agranulocytosis 10,417 (2.3)
 R06 Abnormalities of breathing 9,450 (2.1)
 N17 Acute renal failure 8,664 (1.9)
 R18 Ascites 8,458 (1.8)
 K83 Other diseases of biliary tract 8,019 (1.8)
 E87 Other disorders of fluid, electrolyte and acid-base balance 7,464 (1.6)
 K74 Fibrosis and cirrhosis of liver 7,455 (1.6)
 M81 Osteoporosis without pathological fracture 7,332 (1.6)
 N39 Other disorders of urinary system 7,097 (1.6)

ED, emergency department; KCD-7, Korean Classification of Diseases, 7th revision.

Table 3
Cancer-related emergency department visits according to hospital service levelsa)
Certified tertiary hospital General hospital Hospital Others p-value
Age (yr)
 20–29 6,578 (1.5) 1,672 (0.8) 17 (0.4) 6 (0.3) < 0.001
 30–39 17,125 (3.8) 8,901 (4.2) 74 (1.6) 14 (0.7)
 40–49 43,042 (9.6) 21,025 (10.0) 269 (5.8) 74 (3.9)
 50–59 96,414 (21.4) 39,737 (18.9) 726 (15.7) 862(46.2)
 60–69 126,901 (28.2) 52,716 (25.0) 1,567 (33.9) 315 (16.8)
 70–79 112,459 (25.0) 52,180 (24.8) 1,191 (25.7) 334 (17.9)
 ≥ 80 48,125 (10.7) 344,922 (16.4) 785 (17.0) 263 (14.1)
Sex
 Male 257,671 (57.2) 124,574 (59.1) 3,433 (74.2) 1,396 (74.7) < 0.001
 Female 192,973 (42.8) 86,149 (40.9) 1,196 (25.9) 472 (25.3)
Insurance status
 National Health Insurance 4,159 (92.2) 182,883 (86.8) 4,314 (89.3) 1,660 (88.9) < 0.001
 Medicaid 32,848 (7.3) 26,290 (12.5) 418 (9.0) 191 (10.2)
 Uninsured 803 (0.2) 952 (0.5) 44 (1.0) 3 (0.2)
 Unknown 1,684 (0.4) 598 (0.3) 33 (0.7) 14 (0.8)
Region
 Metropolitan city 321,237 (71.3) 87,624 (41.6) - 559 (29.9) < 0.001
 Province 129,407 (28.7) 123,099 (58.4) 4,629 (100) 1,309 (70.1)
Time of arrival
 6 PM–9 AM 175,829 (39.0) 89,748 (42.6) 2,722 (58.8) 1,000 (53.5) < 0.001
 9 AM–6 PM 274,815 (61.0) 120,975 (57.4) 1,907 (41.2) 868 (46.5)
Mode of arrival
 Ambulance 77,376 (17.2) 47,638 (22.6) 775 (16.7) 416 (22.3) < 0.001
 Non-ambulance 371,698 (82.5) 162,234 (77.0) 3,845 (83.1) 1,451 (77.7)
 Unknown 1,570 (0.4) 849 (0.4) 9 (0.2) 1 (0.1)
Length of stay (hr)
 < 2 42,731 (9.5) 72,467 (34.4) 3,705 (80.0) 1,264 (67.7) < 0.001
 2–3 102,385 (22.8) 64,640 (30.7) 737(15.9) 425 (22.8)
 4–7 141,944 (31.5) 43,567 (20.7) 151 (3.3) 155 (8.3)
 ≥ 8 163,584 (36.3) 30,049 (14.3) 36 (0.8) 24 (1.3)
KTAS classification
 Not urgent 30,298 (6.7) 29,226 (13.9) 1,103 (23.8) 539 (28.9) < 0.001
 Less urgent 130,203 (28.9) 60,555 (28.7) 788 (17.0) 292 (15.6)
 Urgent 247,935 (55.0) 85,413 (40.5) 529 (11.4) 539 (28.9)
 Emergent 35,338 (7.8) 12,513 (5.9) 101 (2.2) 96 (5.1)
 Resuscitation 6,812 (1.5) 3,271 (1.6) 46 (1.0) 27 (1.5)
 Unknown 58 (0.0) 19,745 (9.4) 2,062 (44.6) 375 (20.1)
Disposition
 Discharge home 218,873 (48.6) 100,650 (47.8) 3,132 (67.7) 1,130 (60.5) < 0.001
 Transfer to another hospital 23,546 (5.2) 6,199 (2.9) 193 (4.2) 58 (3.1)
 Admission 103,614 (45.2) 101,230 (48.0) 1,239 (26.8) 670 (35.9)
 Died in ER 3,843 (0.9) 2,138 (1.0) 59 (1.3) 6 (0.3)
 Unknown 768 (0.2) 506 (0.2) 6 (0.1) 4 (0.2)
Admission destination
 General ward 188,696 (41.9) 72,127 (34.2) 262 (5.7) 460 (24.6) < 0.001
 Intensive care unit 12,787 (2.8) 7,693 (3.7) 29 (0.6) 96 (5.1)
 Others/Unknown 249,161 (55.3) 130,903 (62.1) 4,338 (93.7) 1,312 (70.2)
Total (n=667,864)a)

Values are presented as number (%). ER, emergency room; KTAS, Korean Triage and Acuity Scale.

a) Excluded if length of stay is ‘others/unknown’ and if cases are from Sejong city.

Table 4
Multivariate logistic regression models for prolonged length of stay and hospital admission (n=630,538)a)
Prolonged length of stay Hospital admission


Adjusted OR (95% CI) p-value Adjusted OR (95% CI) p-value
Age (yr)

 20–29 1 (reference) 1 (reference)

 30–39 0.99 (0.93–1.05) 0.720 0.86 (0.82–0.92) < 0.001

 40–49 1.07 (1.01–1.13) 0.021 0.97 (0.92–1.02) 0.227

 50–59 1.11 (1.05–1.17) < 0.001 1.18 (1.12–1.24) < 0.001

 60–69 1.14 (1.08–1.20) < 0.001 1.31 (1.24–1.38) < 0.001

 70–79 1.10 (1.04–1.17) 0.001 1.51 (1.43–1.59) < 0.001

 ≥ 80 1.05 (0.99–1.11) 0.121 1.63 (1.55–1.72) < 0.001

Sex

 Male 1 (reference) 1 (reference)

 Female 0.94 (0.93–0.95) < 0.001 0.91 (0.90–0.92) < 0.001

Insurance status

 National Health Insurance 1 (reference) 1 (reference)

 Medical Aid 1.00 (0.87–1.03) 0.751 0.98 (0.97–1.00) 0.090

 Uninsured 0.88 (0.76–1.01) 0.058 0.80 (0.71–0.89) < 0.001

 Unknown 1.02 (0.92–1.14) 0.696 0.70 (0.63–0.77) < 0.001

Hospital service level

 Hospital 1 (reference) 1 (reference)

 General hospital 32.99 (23.37–46.59) < 0.001 1.14 (1.06–1.23) < 0.001

 Certified tertiary hospital 126.34 (89.45–178.45) < 0.001 0.57 (0.53–0.61) < 0.001

 Unknown 2.28 (1.33–3.90) 0.003 1.16 (1.02–1.32) 0.022

Regiona)

 Province 1 (reference) 1 (reference)

 Metropolitan city 1.44 (1.42–1.46) < 0.001 0.78 (0.77–0.79) < 0.001

Time of arrival

 9 AM–6 PM 1 (reference) 1 (reference)

 6 PM–9 AM 1.41 (1.39–1.43) < 0.001 0.72 (0.71–0.72) < 0.001

Mode of arrival

 Ambulance 1 (reference) 1 (reference)

 Non-ambulance 0.96 (0.95–0.98) < 0.001 0.66 (0.65–0.67) < 0.001

 Unknown 1.49 (1.36–1.64) < 0.001 0.62 (0.57–0.68) < 0.001

Length of stay (hr)

 < 2 - 1 (reference)

 2–3 - 1.50 (1.47–1.53) < 0.001

 4–7 - 2.68 (2.63–2.73) < 0.001

 ≥ 8 - 6.71 (6.58–6.84) < 0.001

KTAS classification

 Not urgent 1 (reference) 1 (reference)

 Less urgent 1.62 (1.58–1.67) < 0.001 1.69 (1.65–1.73) < 0.001

 Urgent 1.94 (1.88–1.99) < 0.001 3.18 (3.11–3.25) < 0.001

 Emergent 1.94 (1.88–2.01) < 0.001 6.12 (5.94–6.31) < 0.001

 Resuscitation 1.79 (1.68–1.90) < 0.001 17.82 (16.38–19.39) < 0.001

 Unknown 7.89 (7.55–8.24) < 0.001 1.09 (1.05–1.13) < 0.001

Disposition

 Discharge home 1 (reference) -

 Admission 3.64 (3.60–3.69) < 0.001 -

CI, confidence interval; KTAS, Korean Triage and Acuity Scale; OR, odds ratio.

a) Included only if disposition is ‘discharge home’ or ‘admission’.

TOOLS
Similar articles