

 PDF
PDF Citation
 Print
Print


Introduction
Bladder cancer is the 2nd most common malignancy of the urinary tract [1]. About 75% of bladder cancer cases are initially diagnosed as non-muscle-invasive bladder cancer; however, 50%–70% of patients experience recurrence within 5 years [2]. For this reason, early detection and surveillance after treatment play important roles in the management of bladder cancer.
Current standard methods for diagnosis and surveillance of bladder tumors are based on cystoscopy [3,4]. Cystoscopy has low sensitivity [5] and it causes complications, such as dysuria (50%) and urinary tract infection (5.5%). For this reason, there is always a clinical need for non-invasive, high-performance biomarkers for bladder cancer diagnosis and surveillance.
Numerous biomarkers have been developed in the last decades; however, none of them could replace standard clinical practice [6]. Recent advancements in proteomics are promising in the field of biomarker discovery [7]. Urine proteins and urinary exosomes are considered excellent sources of biomarkers for bladder cancer, owing to their direct contact with the tumor and they reflect intra-tumoral environments with high accessibility [8].
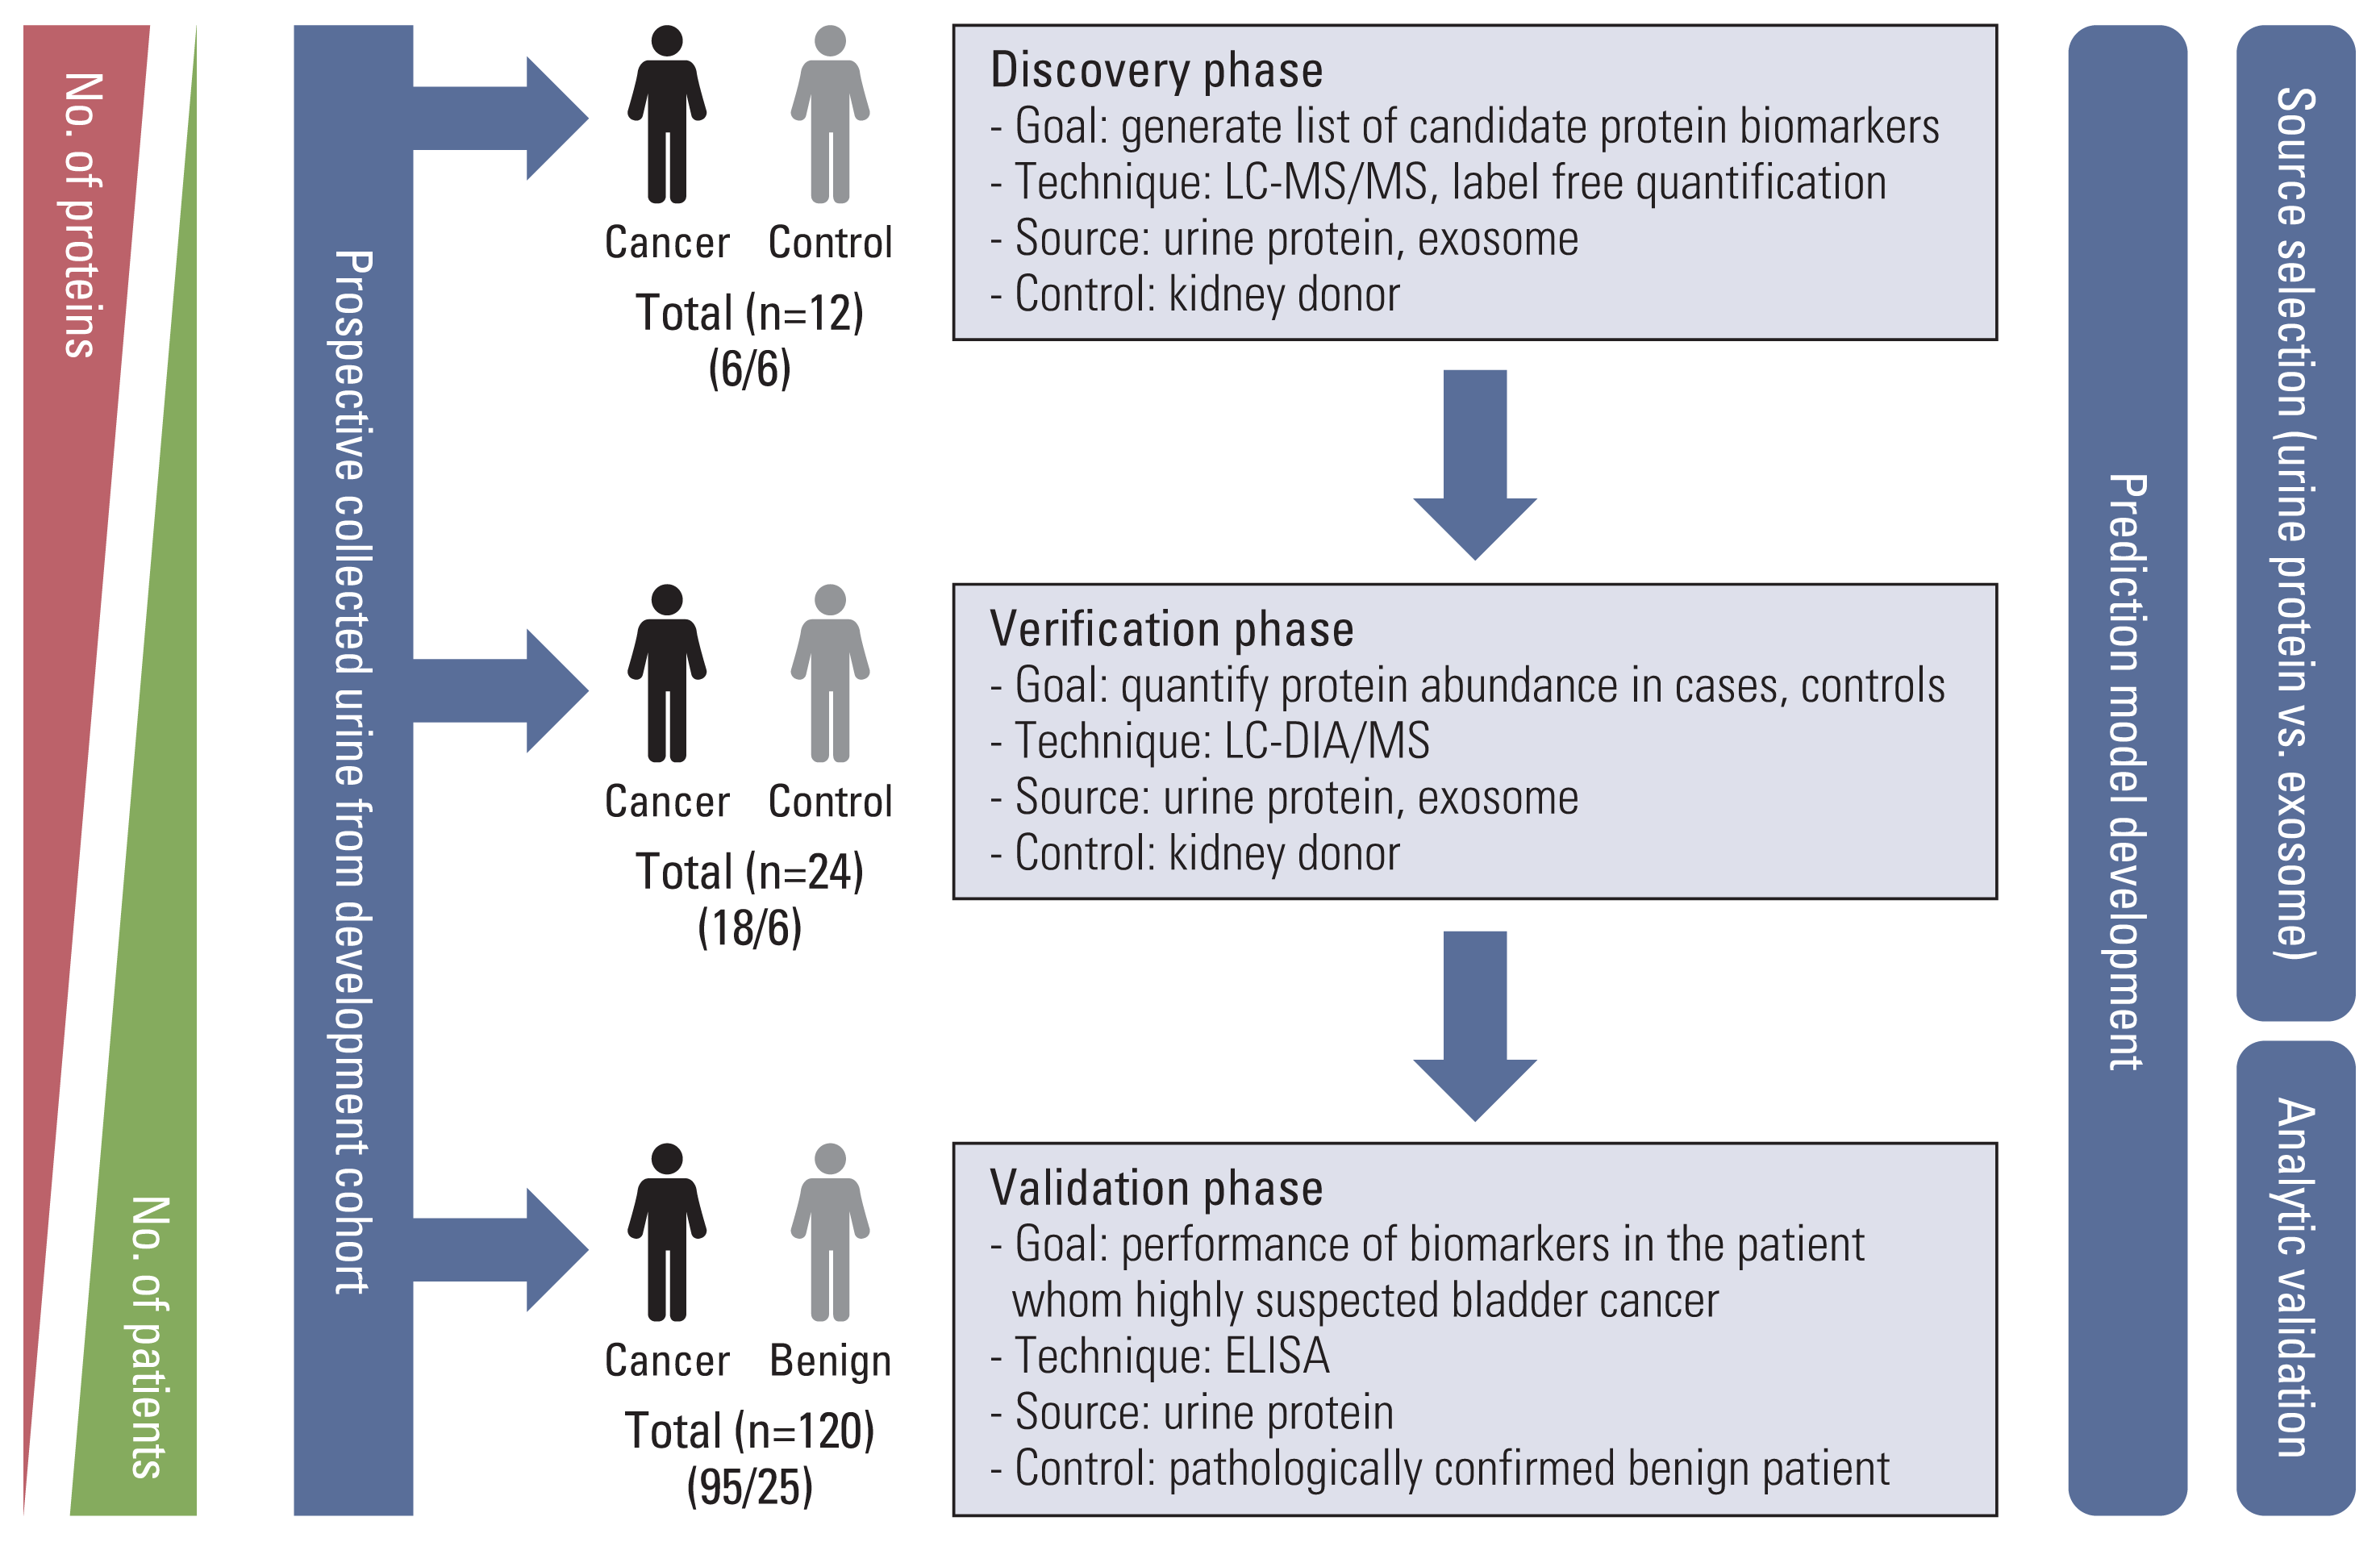
In this study, we designed systematic and precise strategies for biomarker discovery in patients with bladder mass, for source selection (urinary proteins and exosomes), mass screening, candidate biomarker selection, and clinical validation.
Materials and Methods
1. Patient selection and overall study flow
For biomarker discovery and verification, we used prospectively collected urine samples from patients who underwent transurethral resection of bladder tumor (TURB) from October 2016 to August 2017. Urine samples of three patients were used to initially set up the protocol for urinary protein and exosome analysis. Healthy controls were selected from kidney donors who underwent donor nephrectomy before surgery during the same period.
We used the urine specimens of 12 subjects (six with bladder cancer and six for control) for the discovery phase and 24 subjects (18 for bladder cancer and six for control) for the verification phase. For the validation phase, via enzyme-linked immunosorbent assay (ELISA), we used urine samples from 120 patients from the prospective, bio-specimen linked cohort of Seoul National University Prospectively Enrolled Registry for Urothelial Cancer-TURB (SUPER-UC-TURB) [9]. In this validation cohort, 25 patients had a benign disease and 95 patients had urothelial carcinoma, determined by a urological pathologist. All the urine samples were prospectively collected 1–2 days before surgery (20 mL each) and stored at −195°C in liquid nitrogen [9]. An overview of the study is shown in Fig. 1.
2. Liquid chromatography-tandem mass spectrometry
We extracted urinary protein and exosome from collected participants urine. Detailed methods of urinary protein and exosome extraction and preparation described in Supplementary Methods. Using prepared urinary peptides, we performed liquid chromatography-tandem mass spectrometry (LC-MS/MS) analysis. Both data-dependent acquisition (DDA) and data-independent acquisition (DIA) methods, were conducted with an Ultimate 3000 UHPLC system (Dionex, Sunnyvale, CA) coupled to a Q-Exactive Plus mass spectrometer (Thermo Fisher Scientific Inc., Waltham, MA) as previously described with some modifications [10]. Peptide samples were separated on a two-column system with a trap column (300 μm×5 mm) and an analytic column (75 μm×50 cm) with 120-minute gradient from 7% to 32% acetonitrile at 300 mL/min. The column temperature was maintained at 60°C using a column heater. The column eluent was delivered to Q-Exactive Plus via nano-electrospray. For the DDA method for label-free quantification, a survey scan (350 to 1,650 m/z) was acquired with a resolution of 70,000 at m/z 200. The top-20 method was used to select the precursor ion with an isolation window of 1.2 m/z. The tandem mass spectrometry (MS/MS) spectrum was acquired at an HCD-normalized collision energy of 30 with a resolution of 17,500 at m/z 200. The maximum ion injection times for the full and MS/MS scans were 20 and 100 ms, respectively. The HRM DIA method consisted of a survey scan at 35,000 resolution from 400 to 1,220 m/z (AGC target of 3×10⁶ or 60 msec injection time). Then, 19 DIA windows were acquired at a resolution of 35,000 with an automatic gain control target of 3e6 and auto-injection time [11].
3. Data processing for label-free quantification
All MS raw files were processed in MaxQuant (ver. 1.5.3.1) [12]. MS/MS spectra were searched against the Human Uniprot protein sequence database (December 2014, 88,657 entries) using the Andromeda search engine [13]. Primary search was performed using a 6 ppm precursor ion tolerance for the total protein level analysis. The MS/MS ion tolerance was set at 20 ppm. Cysteine carbamido-methylation was set as a fixed modification. The N-acetylation of protein and oxidation of methionine were set as variable modifications. Enzyme specificity was set to full tryptic digestion. Peptides with a minimum length of six amino acids and up to two missed cleavages were considered. The required false discovery rate (FDR) was set to 1% at the peptide, protein, and modification levels. To maximize the number of quantification events across samples, we enabled the ‘Match between Runs’ options on the MaxQuant platform. For label-free quantification, the intensity-based absolute quantification (iBAQ) algorithm [14] was used as part of the MaxQuant platform. Briefly, the iBAQ values calculated by MaxQuant were the raw intensities divided by the number of theoretical peptides. Thus, iBAQ values were proportional to the molar quantities of the proteins.
4. Data processing for the data-independent analysis
To generate spectral libraries, 12 DDA measurements were performed with urine samples. The DDA spectra were searched using MaxQuant against the Uniprot Human Database (December 2014, 88,657 entries) and the iRT standard peptide sequence. A spectral library was generated using the spectral library generation feature of Spectronaut 10. The DIA data from individual samples were analyzed with Spectronaut 10 (Biognosys, Schlieren, Switzerland). First, we converted the DIA raw files into htrm format using the GTRMS converter tool provided with Spectronaut. The FDR was estimated with the mProphet [15] approach and set to 1% at the peptide precursor and protein levels. Proteins were inferred using the software, and quantification information was acquired at the protein level using the q-value < 0.01 criteria, which was used for subsequent analyses.
5. Statistical and bioinformatics analysis for proteomics
A schematic workflow for proteomics analysis in the discovery, verification, and validation phases of this study is shown in Fig. 1. Both phases were conducted via LC-MS/MS using extracted exosome and urine proteins. We selected significantly differentially expressed proteins (DEPs) over 60% of patients for label-free quantification and over 70% of patients for DIA analysis. For pairwise comparison, a two-sample Student’s t test was performed with a permutation-based FDR < 5%.
For exosome analysis, we selected known exosome proteins from the Exocarta database (http://www.exocarta.org) and conducted an enriched analysis. Combined with label-free quantification and DIA DEPs with enrichment analysis, we selected common upregulated and downregulated proteins with common biological processes. After matching the expression patterns using unclustered heatmap analysis, candidates of bladder cancer biomarkers among exosome and urinary proteins were selected.
6. Urinary ELISA for biomarker validation
Candidate biomarkers were selected under the sum of five scoring systems, which reflected significant differences between cancerous and benign urine data. The first and second scores were based on fold changes in the LC-MS/MS–based DIA study (test and repeated test) between cancer and benign patient urine. The third score was based on the area under the curve of the receiver operating characteristic curve (AUROC) of each protein for diagnosis of bladder cancer; AUROC > 0.95 as ten, > 0.9 as eight, > 0.85 as six, > 0.8 as four, and > 0.75 as two points. Fourth and fifth scores were assigned using the multivariable logistic regression model in the repeated DIA study. Under five scoring systems, we selected top eight candidate proteins for ELISA study (S1 Table).
Levels of eight proteins are as follows: alpha-2 macroglobulin (A2M; Magnetic Luminex Assays, catalog No. LXSAHM, R&D Systems Systems Inc., Minneapolis, MN), cofilin-1 (CFL1; catalog No. MBS2886911, MyBioSource Inc., San Diego, CA), apolipoprotein A-I (APOA1; R-PLEX platform, catalog No. F21PR-8, Meso Scale Diagnostics LLC, Rockville, MD), inter-alpha-trypsin inhibitor heavy chain H2 (ITIH2; catalog No. MBS100133, MyBioSource Inc.), afamin (AFM; catalog No. DY8065-05, R&D Systems Inc., Minneapolis, MN), fibrinogen beta chain (FGB; ProcartaPlex Multiplex Immunoassay, catalog No. MAN0016941, Thermo Fisher Scientific Inc.), cell division cycle 5-like protein (CDC5L, catalog No. MBS7227993, MyBioSource Inc.), and CD5 antigen-like protein (CD5L; catalog No. ELH-CD5L, RayBiotech, Peachtree Corners, GA) were analyzed in patient urine samples using commercial ELISA, following the manufacturer’s instructions. Calibration curves were prepared using purified standards before each protein was assessed. We normalized the data if the protein expression was highly skewed (over +2 or less than −2 of skewness), using natural log [ln] transformation [16]. We compared the expression level of each protein between benign and cancerous samples, and between the T stages (benign, Tis, Ta, T1 and > T2).
7. Data analysis of ELISA results
Continuous variables were described as the median±standard deviation (interquartile range), and categorical variables were described as the frequency (%). The statistical significance of two AUROCs followed De Long’s non-parametric approach [17]. Comparison of two samples was performed using Student’s t test and statistical significance was set at p < 0.05, and all reported p-values were 2-sided. All analyses were performed using Python 3.9.0, and statistical analysis was based on packages dependent on SciPy [18]. Detailed methods used for the comparison of the diagnostic performance of each protein for bladder cancer detection are described in Supplementary Methods.
Results
1. Patient characteristics
In the development and verification phases, the patients in the cancer group were older than those in the control group. Abnormal cytological findings (atypical and malignant cells) were significantly higher (p < 0.01) in the cancer group than in the benign group, in the verification phase. In the validation phase, age was not statistically different between the benign and cancerous samples. The percentage of cancerous samples were higher in the male population and positively correlated with abnormal cytology findings. All enrolled patient characteristics are shown in Table 1.
2. Biomarker discovery: label-free quantification
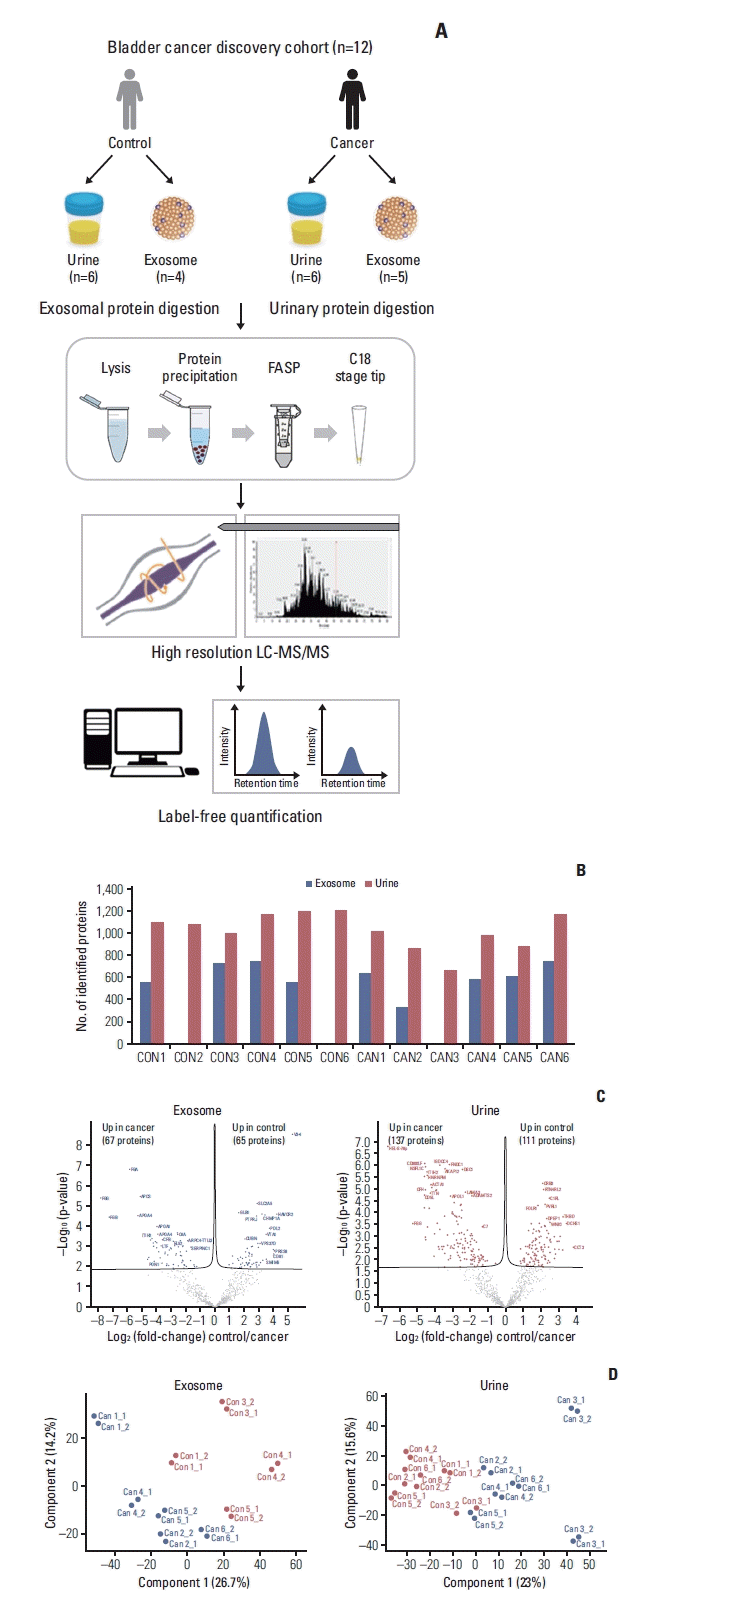
To identify urinary and exosome biomarker candidates, we performed a label-free quantitative proteomic analysis based on data-dependent acquisition (DDA) in a discovery cohort of bladder cancer urine samples (n=12) (Fig. 2A). Urinary exosome was isolated using the precipitation-based Total Exosomes Isolation kit, which is was validated using NanoSight (S2 Fig.). After quality assessment, three samples from two patients in the control group (Donor 2, 6) and one in the bladder cancer group (TURBT 3) failed exosome protein extraction. The average number of identified proteins was 606.2±138.4 for exosomes and 1,021.7±172.1 for urinary proteins (Fig. 2B). Pairwise comparison analysis revealed that there were 132 and 248 DEPs (permutation-based FDR < 5%) between control and bladder cancer groups in exosome and urine samples, respectively (Fig. 2C). We identified 67 upregulated and 65 downregulated exosome proteins, as well as 137 upregulated and 111 downregulated urinary proteins for urothelial carcinoma. From the heatmap with unsupervised hierarchy clustering of exosome and urinary proteins, we visualized differences in protein expression between cancer samples and exosomes in the discovery cohort (S3A and S3B Fig.). Principal component analysis (PCA) of the exosome and urine proteomes showed a clear separation of sample groups (Fig. 2D).
3. Biomarker verification: DIA
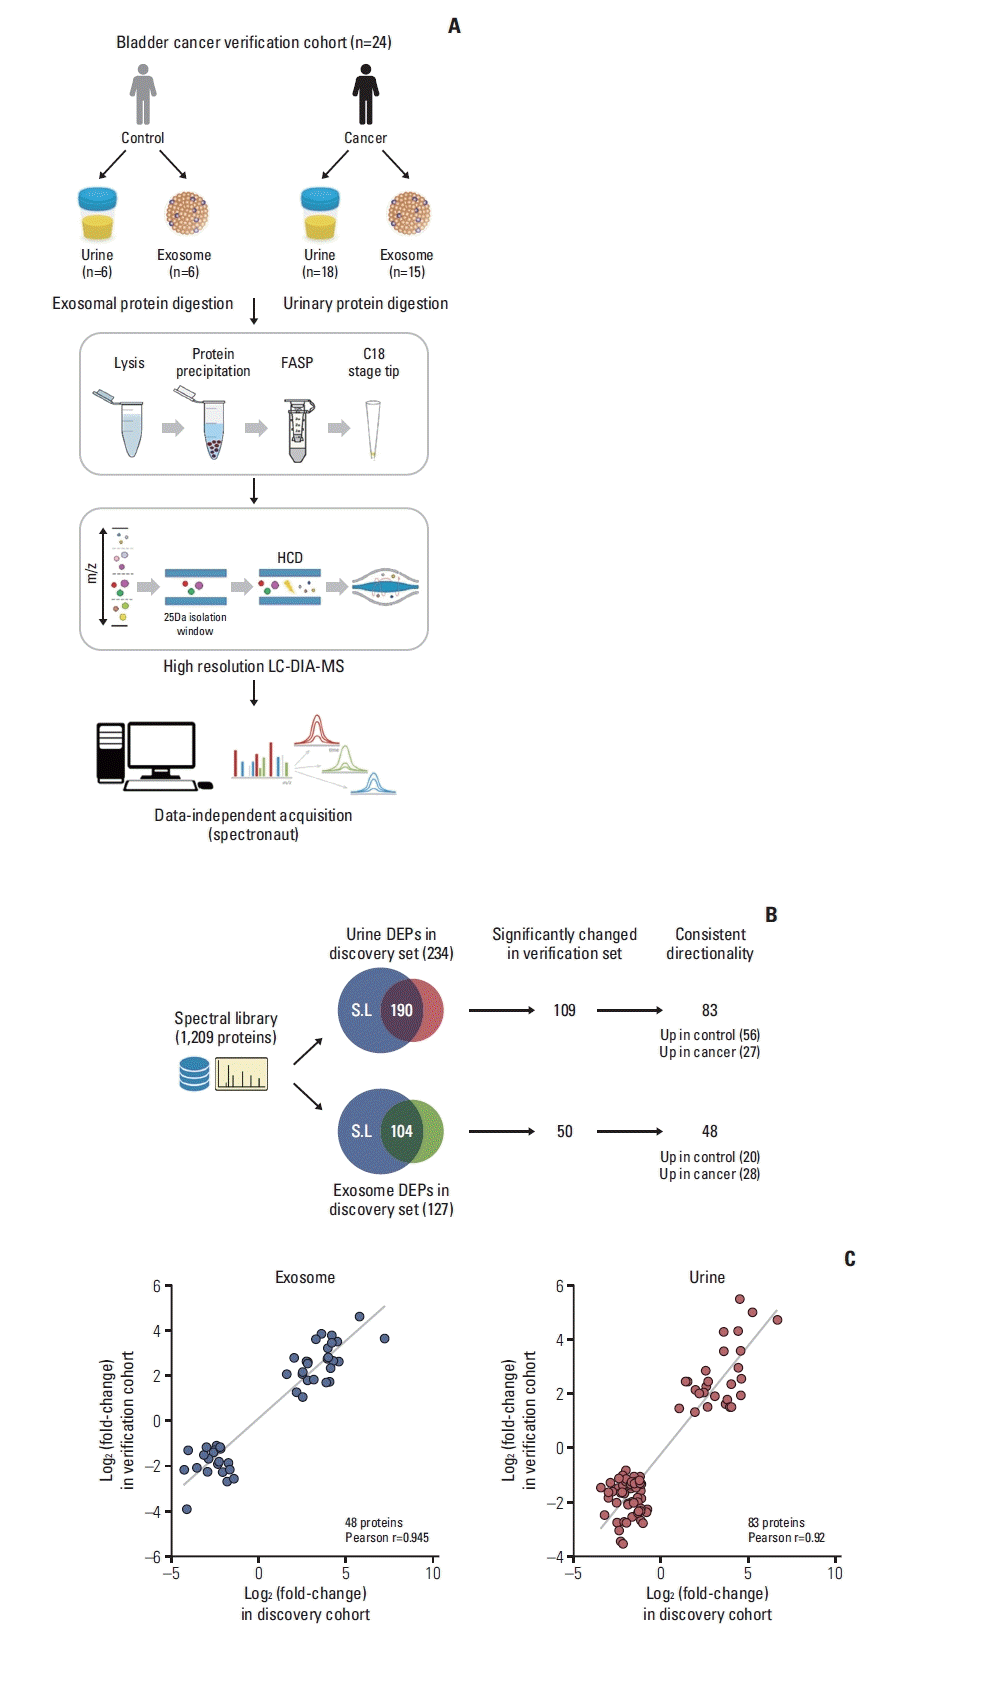
To verify the DEPs in the discovery cohort, we adopted a data-independent acquisition strategy (DIA), both because it can achieve high data completeness [19] (Fig. 3A). First, we constructed spectral library for DIA analysis. A DIA library of about 1,209 proteins was computationally merged from pooled urine. Among the identified DEPs in the discovery phase, 190 candidates for urinary and 104 for exosome proteins were observed from the spectral library (Fig. 3B). For individual sample analysis, we performed DIA measuring of urinary and exosome proteins from 24 participants (Fig. 3A). Exosome protein data of three patients (TURBT 5, 14, 15) were excluded owing to low-quality quantification. The average number of extracted proteins was 796.6±141.0 for exosomes and 1,279.4±159.7 for urinary proteins (S4A Fig.). PCA plot for exosome and urinary proteins are demonstrated in S3B Fig. From the volcano plot and the heatmap with unsupervised hierarchy clustering of exosome and urinary proteins, we visualized differences in protein expression between cancer samples and exosomes in the verification cohort (S4C and S5 Fig.).
Comparing the discovery and verification cohorts, 44% (109/248 urinary DEPs) and 38% (50/132 exosomal DEPs) are consistent at significance levels of 5% of FDR, respectively (Fig. 3B). We next assessed the consistency of urothelial carcinoma-associated protein changes between discovery and verification stages. In exosome samples, 48 proteins differed consistently in abundance by cancer status. Among these proteins, 28 and 20 proteins were up- and downregulated in urothelial carcinoma, respectively. In urine samples, 83 out of 109 proteins (76%) differed consistently in abundance by cancer status, 27 of which had an elevated abundance in urothelial carcinoma and 56 an elevated abundance in control.
Furthermore, quantitative alterations of protein levels between control and urothelial carcinoma were very consistent between the discovery and verification cohorts. Control/Urothelial Carcinoma fold changes of proteins were highly correlated with Pearson’s correlation coefficients at r=0.945 and r=0.92 for the comparisons of exosome and urine, respectively (Fig. 3C).
4. Selection of candidate biomarkers
Owing to limitations in the isolation of some specimens in the discovery and verification phases, we used urinary proteins for biomarker candidate selection. From 27 and 28 upregulated urinary proteins and exosome proteins, nine proteins are abundant in both samples in cancer patients. We selected upregulated urinary proteins in cancer patients as potential biomarkers; however, four proteins were removed because there was no available ELISA antibody. FGB was upregulated seven folds, whereas A2M, CD5L, fibrinogen gamma chain (FGG), complement factor H (CFH), and Rho GDP dissociation inhibitor beta (ARHGDIB) were upregulated five folds in the discovery set. In the verification set, A2M was upregulated six folds, FGB and FGG were upregulated five folds, and APOA1, complement C3 (C3), CFH and apolipoprotein C-III were upregulated four folds. For AUROC, A2M scored ten points, whereas AFM, FGB, FGG, C3, CFH, protein S isoform 1, apolipoprotein M, heparin cofactor 2 (SERPIND1), and plasminogen scored eight points. By multivariable regression modeling, A2M, CFL1, APOA1, CDC5L, and CD5L were selected in the first model, and A2M, CFL1, ITIH2, and AFM were selected for the second model (S1 Table). Finally, we selected high scored eight proteins (A2M, CFL1, APOA1, ITIH2, AFM, FGB, CDC5L, and CD5L) for ELISA study. Among eight selected proteins, three proteins (APOA1, ITIH2, and FGB) also abundant in exosome samples.
5. Biomarker validation using ELISA
Before analysis, we normalized the expression levels of AFM, CD5L, APOA1, ITIH2, and FGB via natural logarithmic transformation (S6A and S6B Fig.). The expression of CDC5L, ITIH2, AFM, CFL1, APOA1, A2M, FGB, and CD5L was significantly different between cancerous and benign samples (Table 2). A2M, CFL1, APOA1, AFM, FGB, and CD5L showed a statistical difference between benign and T1 or T2 tumors. Only ITIH2 showed statistical differences in protein expression levels between benign and Ta tumors (S7 Fig.).
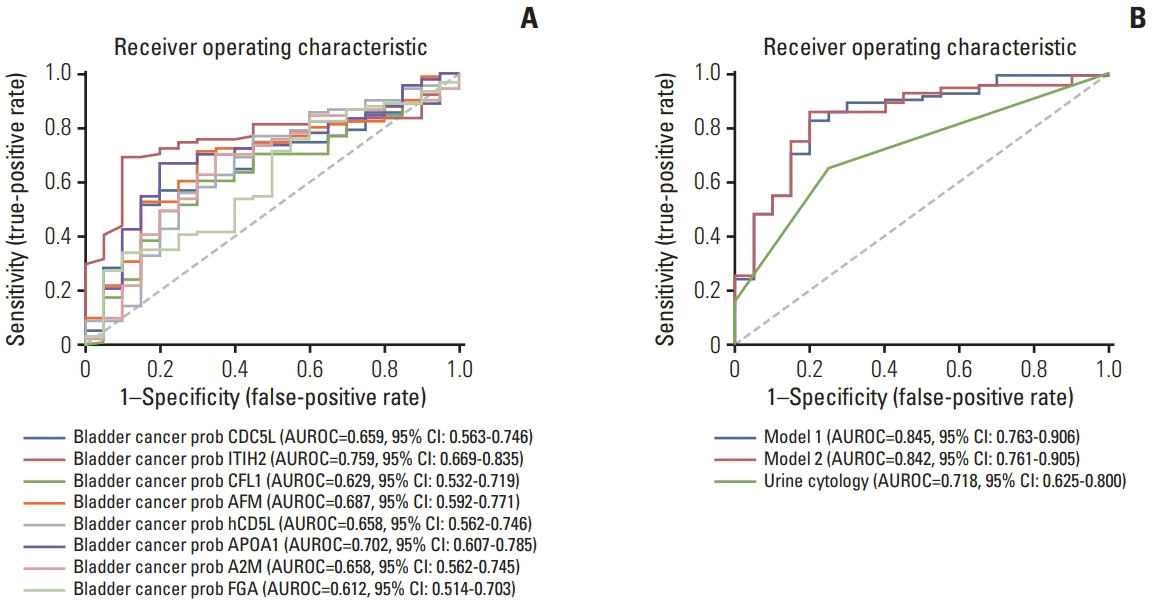
The AUROC of the eight biomarkers ranged from 0.629–0.759, and the AUROC of urine cytology was 0.718 (Fig. 4A). Using the multivariable analysis, ITIH2, AFM, CFL1 were selected for model 1. Model 2 was created by entering all eight biomarkers. The AUROC of model 1 was 0.845 (95% confidence interval [CI], 0.764 to 0.906) and that of model 2 was 0.842 (95% CI, 0.761 to 0.905). Model 1 (p=0.036) and model 2 (p=0.039) showed statistically significant differences in the AUROC of urine cytology (0.718; 95% CI, 0.625 to 0.800) (Fig. 4B).
The optimal cutoff values of model 1 and 2 were 0.735 and 0.870, respectively. The sensitivity, specificity, positive predictive value, and negative predictive value of model 1 were 0.880, 0.813, 0.485, and 0.949, respectively, and those of model 2 were 0.850, 0.747, 0.425, and 0.958, respectively. With a combination of urine cytology and the predicted value of model 1, AUROC for cancer prediction was 0.851 (95% CI, 0.770 to 0.912), and that of the combination of urine cytology and model 2 was 0.827 (95% CI, 0.743 to 0.893) (S7 Fig.).
Discussion
In this study, we aimed to develop multiplex urinary biomarkers for bladder cancer diagnosis. Using a combined approach of urine and exosome proteins to identify candidate biomarkers using LC/MS-MS, we selected several candidate proteins, in the discovery and verification phases. After narrowing down the candidate proteins using statistical methods, we finalized eight of the most promising biomarkers. Using ELISA result, we developed two diagnostic models, which were more accurate than urine cytology. With the combination of urine cytology and the developed model with cutoff value application, the AUROC of model 1 with urine cytology was 0.851 and that of model 2 with urine cytology was 0.827.
In recent decades, numerous urinary biomarkers have been discovered and some of them have been approved for clinical use, however, the diagnostic performance is still limited in patients with haematuria [6]. The combination of biomarkers shows higher accuracy than a single biomarker alone, as shown in previous studies [20,21]. In the present study, we developed a multiplex biomarker panel using the eight candidate proteins selected from the high-throughput LC-MS/MS-based biomarker discovery and verification phase. The AUROC of each protein for bladder cancer diagnosis was 0.612–0.759, which was similar to that of urine cytology (0.718). The AUROC of multiplex model of three proteins (0.845) and model of all proteins (0.842) were higher than that of single proteins (0.612–0.759) and outperformed that of urine cytology (0.718), which showed acceptable performance for clinical application.
Urine is an easily accessible body fluid and a large amount of protein in it is considered a good candidate for biomarker discovery. However, the problem with using urinary protein as a biomarker is that we do not know which protein is delivered from cancer cells. Urinary exosome has benefit in it containing intracellular molecules of cancer cells [22], however for gathering urine exosome needs additional extraction procedure. In this study, using qualified urine preprocessing methods, we found that there were no differences between urinary and exosome protein yields using a commercial exosome extraction kit (Fig. 2B, S4C Fig.). Besides, there are risks of quality check failures when using exosome proteins as biomarkers (S4C Fig.). Unlike other cancers, bladder cells are in direct contact with cancer cells, which are retained in the bladder for a long time before being excreted, thus urine contains many cancer and peritumoral environment-derived proteins [23]. For this reason, we used urine proteins, and not exosome proteins, for multiplex biomarker panel composition.
In present study, we selected CDC5L, ITIH2, AFM, CFL1, APOA1, A2M, FGB, and CD5L for final urine biomarkers. Most of them shows differential expression of bladder cancer and benign population in previous studies, however clinical application of these proteins is still under discovering. APOA1 and FGB were relatively well-known biomarker for bladder cancer detection and prognosis [24,25]. CDC5L protein related with cell cycle regulation and related with pathologic grade, distant metastasis in bladder cancer in recent study [26]. Downregulation of another ITIHs family, ITIH5 associated with poor prognosis in bladder cancer [27]. In present study, ITIH2 level was lower in cancer patients, and we carefully guess biologic activity of ITIH2 maybe similar with ITIH5. The prognostic effect or biological role of AFM, A2M, and CD5L is still unclear, however some bioinformatics studies shows potential relationship of AFM and A2M for bladder cancer detection [28,29].
This study has several limitations. Only urine from a selected number of participants could be used for high-throughput LC-MS/MS owing to technical limitations. We only performed annalistic validation of the biomarkers. Despite these limitations, this study has strength with developed multiplex prediction model in a clinically indistinguishable setting of TURB. We plan to conduct a large prospective validation study for bladder cancer diagnosis, surveillance.
In conclusion, we successfully developed a multiplex urinary biomarker-based model using next-generation proteomics in patients with bladder mass. Multiple urinary biomarker-based panels overcome the predictive ability of urine cytology alone. With the combination of urine cytology and the developed model, diagnostic performance further increased. A large-scale prospective validation study is required for future studies.
 XML Download