Introduction
Materials and Methods
1. Data sources
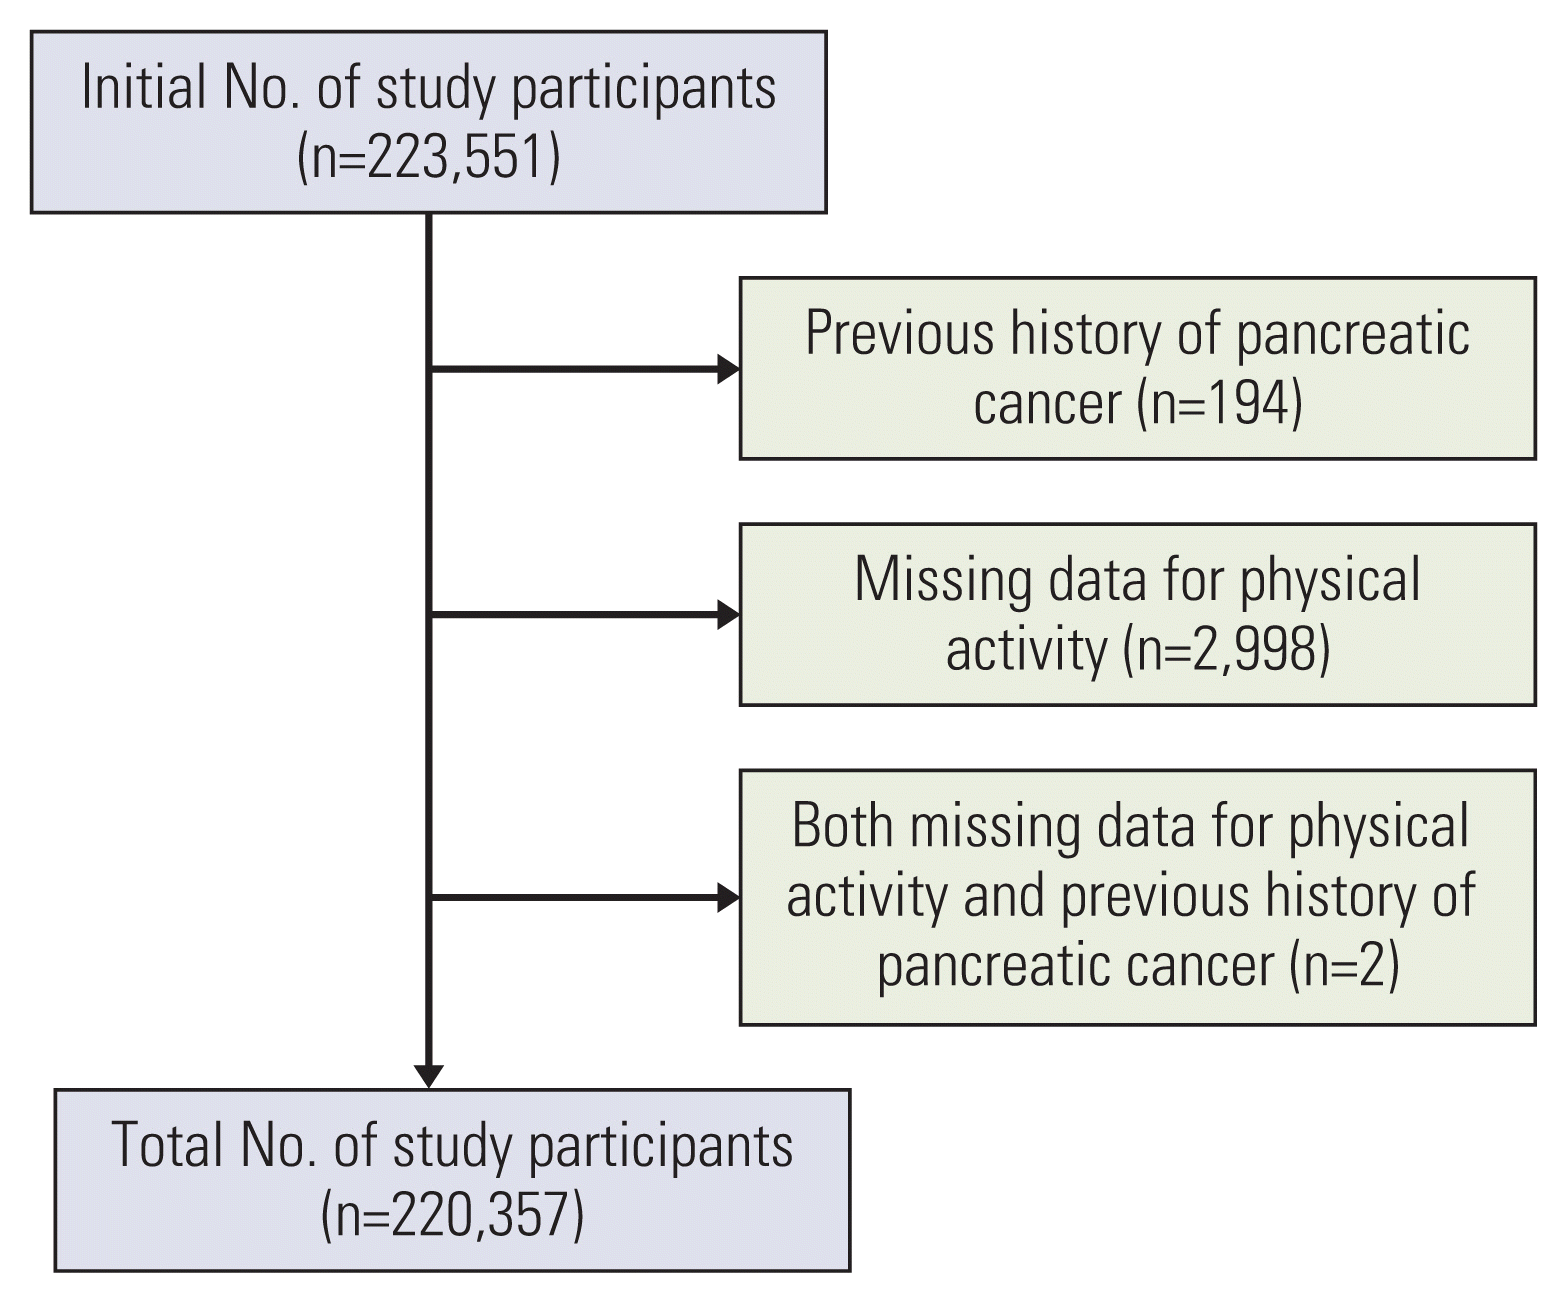
2. Study participants
3. Health survey examinations and laboratory measurements
4. Assessment of physical activity
5. Outcome definitions
6. Statistical analysis
Results
Table 1
| Characteristic | Overall | Frequency of high intensity physical activity | ||||
|---|---|---|---|---|---|---|
| Group 1 (n=129,264) | Group 2 (n=66,580) | Group 3 (n=14,122) | Group 4 (n=10,391) | p for trenda) | ||
| Person-year (total) | 965,829.1 | 566,486.9 | 291,642.6 | 61,965.9 | 45,733.7 | |
| Person-year (average) | 4.38±0.45 | 4.38±0.49 | 4.38±0.38 | 4.39±0.37 | 4.40±0.46 | < 0.001 |
| Age (yr) | 58.1±8.8 | 59.4±9.3 | 55.7±7.5 | 56.7±7.7 | 60.1±8.5 | < 0.001 |
| Sex | ||||||
| Male | 123,935 (56.2) | 61,919 (47.9) | 46,173 (69.4) | 9,224 (65.3) | 6,619 (63.7) | < 0.001 |
| Female | 96,422 (43.8) | 67,345 (52.1) | 20,407 (30.6) | 4,898 (34.7) | 3,772 (36.3) | |
| BMI (kg/m2) | 24.0±2.9 | 23.9±3.0 | 24.1±2.8 | 24.1±2.7 | 24.1±2.8 | < 0.001 |
| WC (cm) | 82.0±8.2 | 81.7±8.4 | 82.5±7.9 | 82.1±7.9 | 82.6±7.9 | < 0.001 |
| Systolic BP (mm Hg) | 125.3±15.2 | 125.4±15.5 | 124.9±14.6 | 125.3±14.6 | 126.2±15.1 | < 0.001 |
| Diastolic BP (mm Hg) | 77.7±9.9 | 77.5±10.1 | 78.0±9.8 | 77.8±9.8 | 77.9±9.9 | 0.004 |
| Total cholesterol (mg/dL) | 200.0±37.5 | 200.3±38.0 | 199.7±36.8 | 199.2±36.5 | 198.5±37.5 | < 0.001 |
| Triglyceride (mg/dL) | 118 (83–170) | 118 (83–170) | 120 (84–174) | 111 (78–162) | 113 (79–163) | < 0.001 |
| HDL-cholesterol (mg/dL) | 55.4±32.5 | 56.0±36.2 | 54.1±25.6 | 55.8±29.0 | 55.7±28.0 | 0.495 |
| LDL-cholesterol (mg/dL) | 118.3±39.0 | 118.6±39.6 | 117.7±37.6 | 117.9±39.3 | 117.3±40.7 | 0.002 |
| Fasting blood glucose (mg/dL) | 100.8±25.4 | 100.5±25.6 | 101.0±25.3 | 101.2±24.2 | 102.0±24.8 | < 0.001 |
| SCr (mg/dL) | 1.15±1.49 | 1.06±1.25 | 1.31±1.83 | 1.26±1.72 | 1.11±1.27 | 0.091 |
| eGFR (mL/min/1.73 m2) | 80.6±20.2 | 80.8±19.4 | 80.4±21.7 | 80.2±21.2 | 79.8±18.8 | < 0.001 |
| AST (U/L) | 26.6±16.5 | 26.5±17.1 | 26.7±15.4 | 26.8±14.4 | 27.3±18.2 | < 0.001 |
| ALT (U/L) | 25.4±19.4 | 24.9±19.2 | 26.3±19.8 | 25.5±18.9 | 25.1±18.9 | 0.659 |
| GGT (U/L) | 39.1±53.9 | 37.5±54.6 | 42.0±52.2 | 39.2±52.4 | 39.6±57.8 | 0.036 |
| Smoking amount (pack-year) | 7.8±13.9 | 7.1±14.1 | 8.9±13.4 | 8.2±13.2 | 8.1±14.6 | < 0.001 |
| Alcohol drinker (%) | 14.3 | 12.4 | 16.4 | 18.2 | 19.4 | < 0.001 |
| Incidence of pancreatic cancer (%) | 377 (0.17) | 244 (0.19) | 107 (0.16) | 16 (0.11) | 10 (0.10) | < 0.001 |
| Duration of PA (mo) | 30.8±10.9 | 30.7±12.2 | 31.4±11.4 | 29.5±9.8 | 27.6±10.3 | < 0.001 |
| MET (min/wk) | 874±346 | 817±330 | 932±294 | 1,231±382 | 1,527±419 | < 0.001 |
| Sitting time (hr/day) | 7.1±3.4 | 7.2±3.6 | 6.9±3.1 | 7.0±2.9 | 7.1±3.5 | 0.065 |
| Moderate intensity PA | ||||||
| Number (wk) | 2.8±1.3 | 2.6±1.1 | 2.9±1.4 | 2.4±1.5 | 2.2±1.7 | < 0.001 |
| Minutes | 25.9±8.1 | 27.9±7.5 | 28.6±9.4 | 27.5±10.3 | 25.4±11.2 | < 0.001 |
Values are presented as mean±standard deviation or number (%). Group 1, performing 0 day per week; group 2, performing 1-3 days per week; group 3, performing 4-5 days per week; group 4, performing 6-7 days per week. ALT, alanine aminotransferase; AST, aspartate aminotransferase; BMI, body mass index; BP, blood pressure; eGFR, estimated glomerular filtration rate; GGT, γ-glutamyltransferase; HDL, high-density lipoprotein; LDL, low-density lipoprotein; MET, metabolic equivalent of task; PA, physical activity; SCr, serum creatinine; WC, waist circumference.
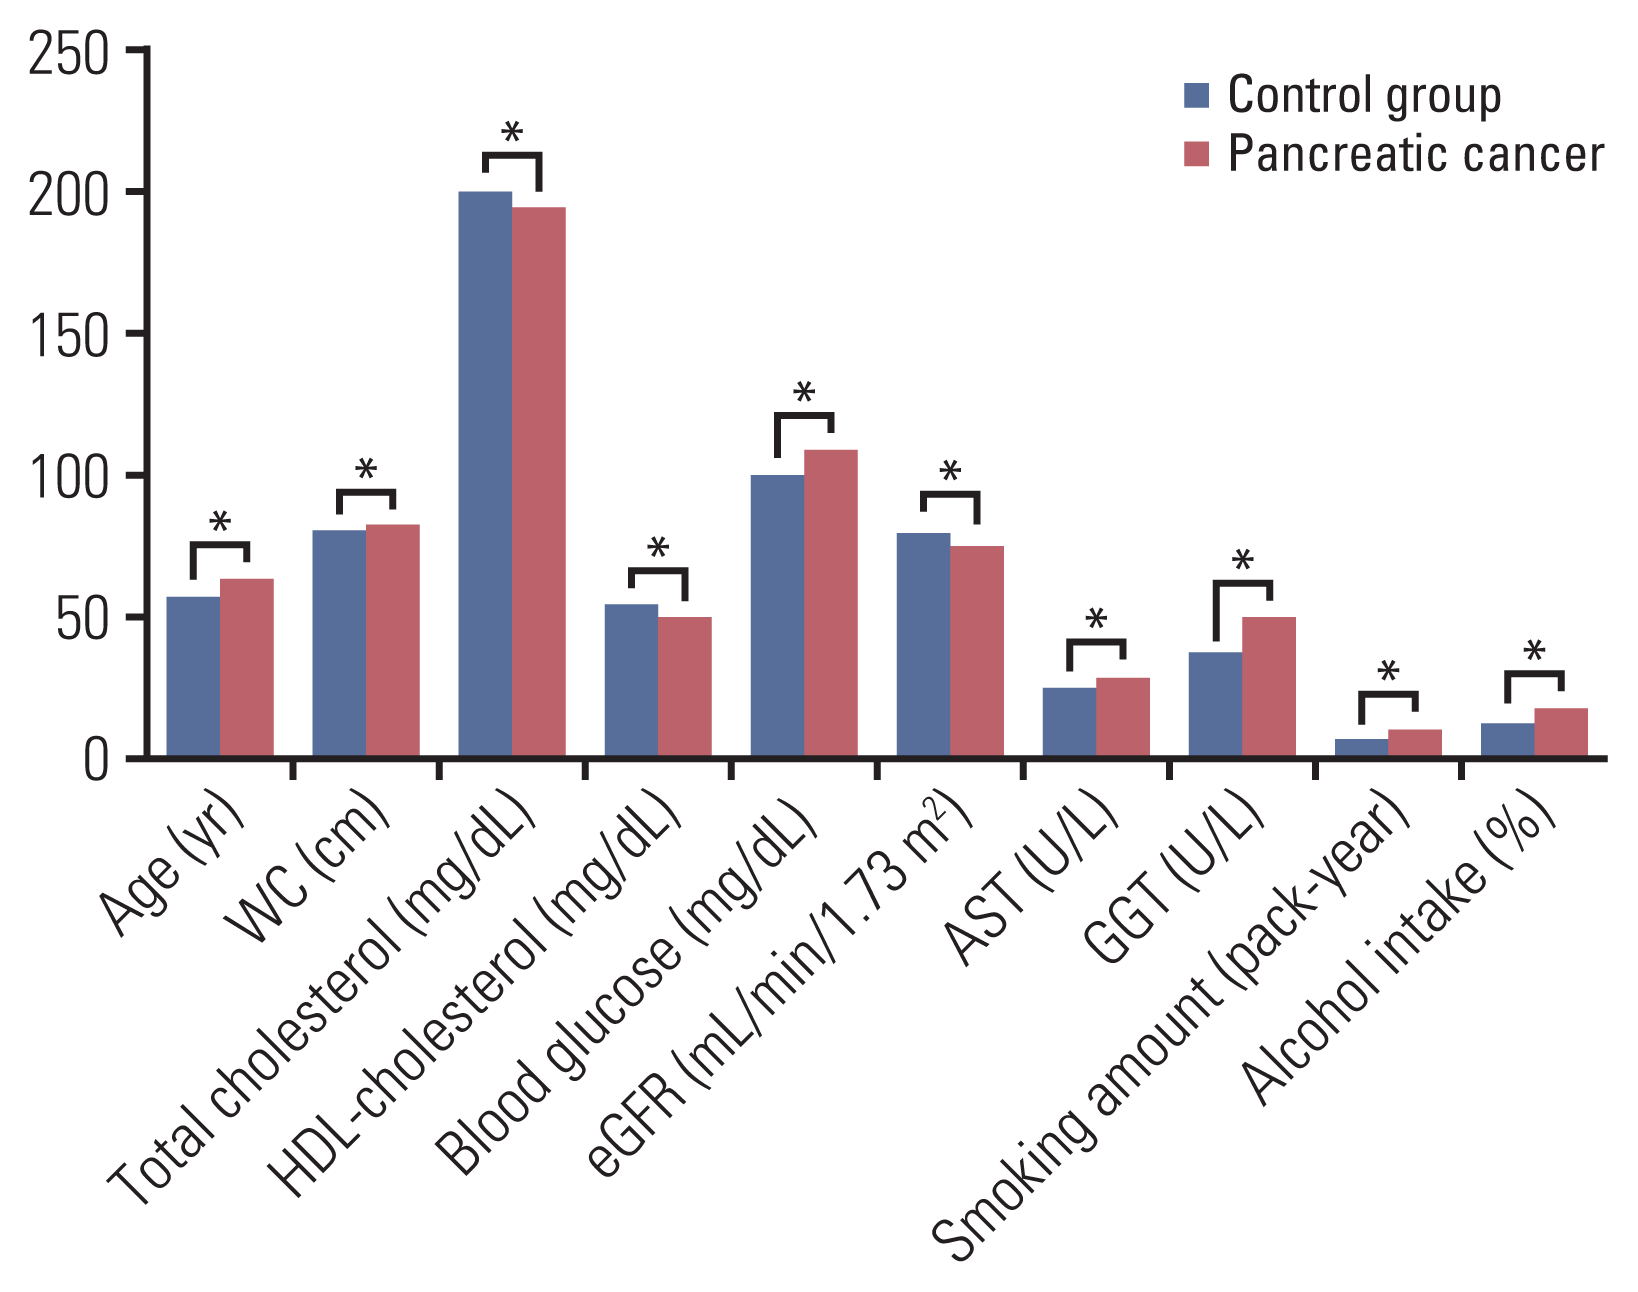
Fig. 2

Table 2
| Characteristic | Participants without pancreatic cancer (n=219,980) | Participants with pancreatic cancer (n=377) | p-valuea) |
|---|---|---|---|
| Person-year (average) | 4.39±0.44 | 2.59±1.24 | < 0.001 |
| Age (yr) | 58.1±8.8 | 64.8±10.1 | < 0.001 |
| Sex | |||
| Male | 123,690 (56.2) | 245 (65.0) | < 0.001 |
| Female | 96,290 (43.8) | 132 (35.0) | |
| BMI (kg/m2) | 24.0±2.9 | 23.9±2.8 | 0.803 |
| WC (cm) | 82.0±8.2 | 83.5±7.8 | < 0.001 |
| Systolic BP (mm Hg) | 125.3±15.2 | 127.7±15.5 | 0.003 |
| Diastolic BP (mm Hg) | 77.7±9.9 | 77.7±10.1 | 0.934 |
| Total cholesterol (mg/dL) | 200.0±37.5 | 195.1±37.5 | 0.011 |
| Triglyceride (mg/dL) | 141.6±93.8 | 146.8±92.9 | 0.288 |
| HDL-cholesterol (mg/dL) | 55.4±32.5 | 51.0±12.9 | < 0.001 |
| LDL-cholesterol (mg/dL) | 118.3±39.0 | 115.6±37.6 | 0.180 |
| Fasting blood glucose (mg/dL) | 100.8±25.4 | 109.9±35.7 | < 0.001 |
| SCr (mg/dL) | 1.15±1.49 | 1.19±1.55 | 0.615 |
| eGFR (mL/min/1.73 m2) | 80.6±20.2 | 75.8±19.3 | < 0.001 |
| AST (U/L) | 26.6±16.4 | 29.3±32.2 | 0.002 |
| ALT (U/L) | 25.4±19.3 | 26.0±17.3 | 0.482 |
| GGT (U/L) | 39.0±53.8 | 51.6±85.3 | 0.004 |
| Smoking amount (pack-year) | 7.8±13.9 | 11.6±20.8 | < 0.001 |
| Alcohol drinker (%) | 14.3 | 19.1 | 0.009 |
| MET (min/wk) | 874±378 | 858±345 | < 0.001 |
| Sitting time | 7.1±3.6 | 7.1±3.8 | 0.104 |
| Moderate intensity PA | |||
| Number (wk) | 2.8±1.4 | 2.3±1.2 | < 0.001 |
| Minutes | 26.0±8.6 | 25.7±9.1 | < 0.001 |
Values are presented as mean±standard deviation or number (%). ALT, alanine aminotransferase; AST, aspartate aminotransferase; BMI, body mass index; BP, blood pressure; eGFR, estimated glomerular filtration rate; GGT, γ-glutamyltransferase; HDL, high-density lipoprotein; LDL, low-density lipoprotein; MET, metabolic equivalent of task; PA, physical activity; SCr, serum creatinine; WC, waist circumference.
Table 3
Incidence density: number of incident pancreatic cancer per 10,000 person-year. Adjusted model: multivariate adjustment for age, sex, BMI, systolic BP, fasting blood glucose, LDL-cholesterol, eGFR, GGT, smoking amount (pack-year), and alcohol intake. Group 1, performing 0 day per week; group 2, performing 1-3 days per week; group 3, performing 4-5 days per week; group 4, performing 6-7 days per week. BMI, body mass index; BP, blood pressure; eGFR, estimated glomerular filtration rate; GGT, γ-glutamyltransferase; LDL, lowdensity lipoprotein.


 PDF
PDF Citation
 Print
Print


 XML Download