Journal List > Cancer Res Treat > v.54(3) > 1516078518

Kim, Kim, Lee, Lee, Kim, Lee, and Kim: Hypo-trimethylation of Histone H3 Lysine 4 and Hyper-tri/dimethylation of Histone H3 Lysine 27 as Epigenetic Markers of Poor Prognosis in Patients with Primary Central Nervous System Lymphoma

Abstract

Purpose

This study aimed to investigate the methylation status of major histone modification sites in primary central nervous system lymphoma (PCNSL) samples and examine their prognostic roles in patients with PCNSL.

Materials and Methods

Between 2007 and 2020, 87 patients were histopathologically diagnosed with PCNSL. We performed immunohistochemical staining of the formalin-fixed paraffin-embedded samples of PCNSL for major histone modification sites, such as H3K4, H3K9, H3K27, H3K14, and H3K36. After detection of meaningful methylation sites, we examined histone modification enzymes that induce methylation or demethylation at each site using immunohistochemical staining. The meaningful immunoreactivity was validated by western blotting using fresh tissue of PCNSL.

Results

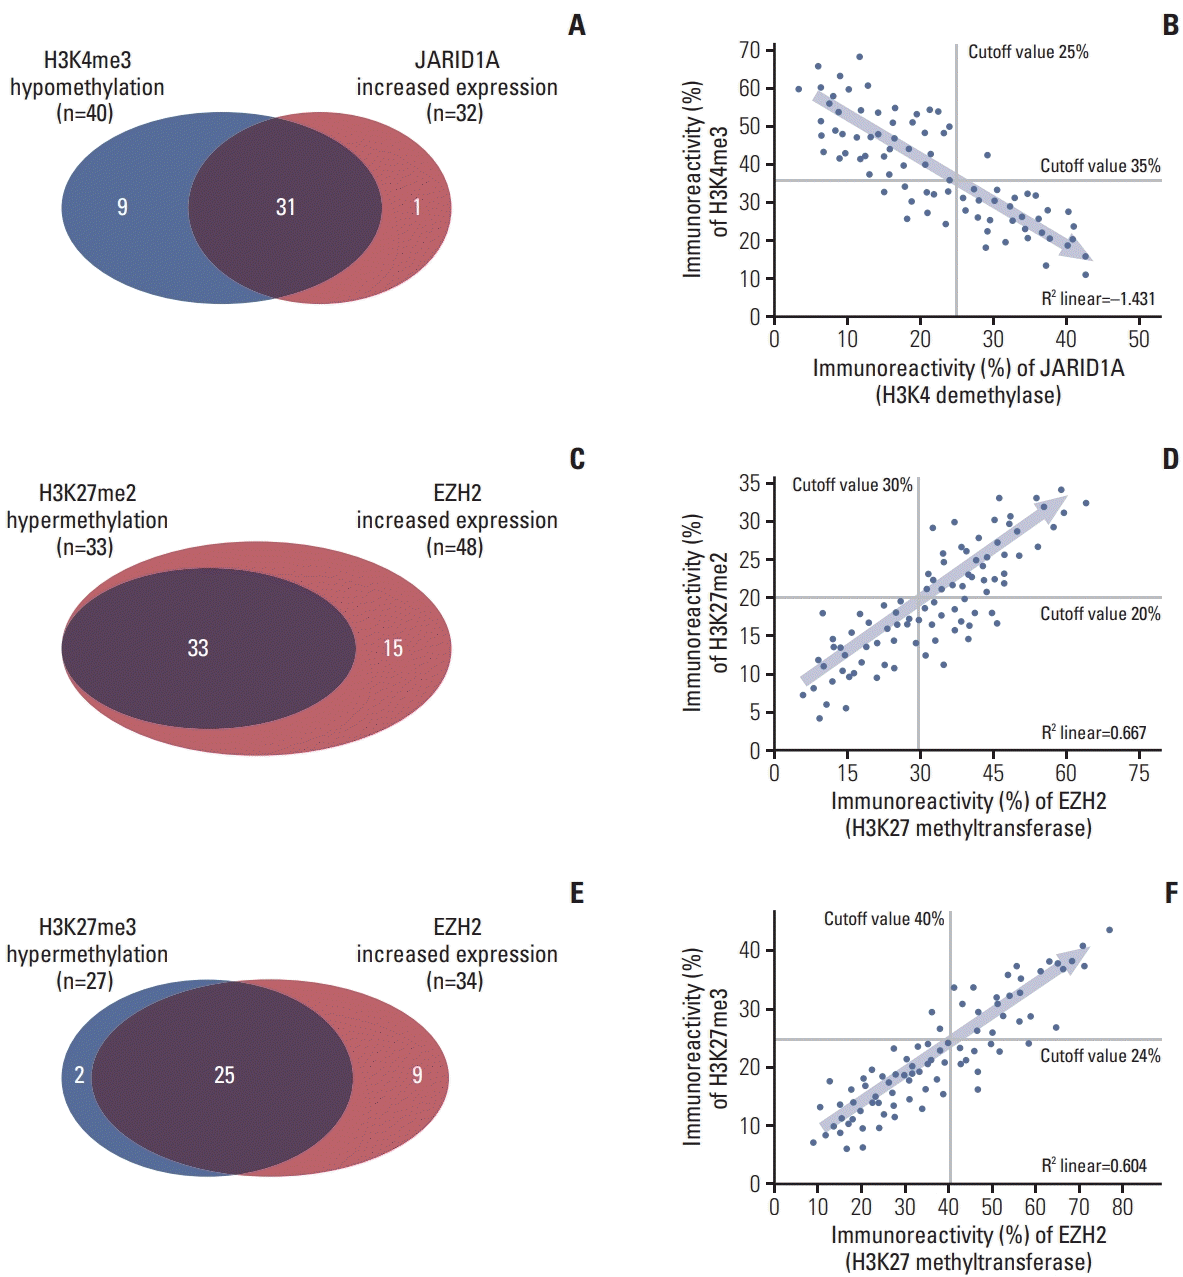
More frequent recurrences were found in hypomethylation of H3K4me3 (p=0.004) and hypermethylation of H3K27me2 (p < 0.001) and H3K27me3 (p=0.002). These factors were also statistically related to short PFS and overall survival in the univariate and multivariate analyses. Next, histone modification enzymes inducing the demethylation of H3K4 (lysine-specific demethylase-1/2 and Jumonji AT-rich interactive domain [JARID] 1A-D]) and methylation of H3K27 (enhancer of zeste homolog [EZH]-1/2) were immunohistochemically stained. Among them, the immunoreactivity of JARID1A inversely associated with the methylation status of H3K4me3 (R2=−1.431), and immunoreactivity of EZH2 was directly associated with the methylation status of H3K27me2 (R2=0.667) and H3K27me3 (R2=0.604). These results were validated by western blotting in fresh PCNSL samples.

Conclusion

Our study suggests that hypomethylation of H3K4me3 and hypermethylation of H3K27me2 and H3K27me3 could be associated with poor outcomes in patients with PCNSL and that these relationships are modified by JARID1A and EZH2.

Introduction

Primary central nervous system lymphoma (PCNSL) is an extranodal, malignant, non-Hodgkin lymphoma of the large B-cell type that is usually confined to the brain, eyes, leptomeninges, or spinal cord, in the absence of systemic lymphoma. PCNSLs account for up to 1% of all lymphomas, 4%–6% of all extranodal lymphomas, and approximately 3% of all primary brain tumors worldwide, including Korea [1]. Although the incidence of PCNSL is relatively low, it has increased steadily over the last two decades, particularly in elderly patients, who represent the majority in the immunocompetent populations [2].
Although PCNSL is a highly aggressive tumor with a poor prognosis in untreated patients, in contrast to most malignant brain tumors, PCNSL is sensitive to corticosteroids, chemotherapy, and radiotherapy, and durable complete responses and long-term survival seem possible with these treatments. For systemic non-Hodgkin lymphomas, the cyclophosphamide, doxorubicin, vincristine, prednisolone (CHOP) regimen is routinely used, and it induces responses with relatively good outcomes. However, this regimen is not recommended for PCNSL as it offers no survival advantage over radiotherapy alone [3]. The apparent inability of these chemotherapeutic regimens to cross the blood-brain barrier and eradicate the microscopic disease is a major challenge. Recently, high-dose methotrexate has been regarded as the most important and beneficial single drug for PCNSL, based on convergent results from many prospective and retrospective studies [4]. The therapeutic outcome has substantially improved in the past two decades as a result of better curative treatment strategies. However, treatment of this disease remains challenging because remissions are frequently of short duration, and recurrences are also observed.
The prognostic scoring system for clinical outcomes is well established by the International Extranodal Lymphoma Study Group (IELSG), whose variables include age of 60 years or more, serum level of lactate dehydrogenase (LDH), protein concentration in the cerebrospinal fluid (CSF), deep brain involvement, and the performance status [5]. In terms of the histopathological features of PCNSL, several markers, such as the overexpression of c-Myc and the B cell lymphoma (BCL)-2 and BCL6 translocation, have been reported as prognostic markers [6]. Recently, the advancement of molecular genetic analysis in cancers is expected to improve the prediction efficacy for response to treatment and clinical outcomes. Further efforts to define effective prognostic biomarkers in PCNSL are ongoing, especially regarding genetic and epigenetic mechanisms.
Epigenetic machinery induces stable changes in genetic expression after transcription, without altering the DNA sequences. An important insight into epigenetic alteration is that some of the most frequent genetic mutations in cancers are those related to chromatin and epigenetics, especially those related to proteins with histone modifications. Histone modification plays an essential role in normal cell function and tumorigenesis. Mutation or deletion of these epigenetic modifications often renders the cells unable to epigenetically “switch on” critical gene sets that are required to differentiate, repair DNA, and other essential cellular functions. Failure to activate these genes locks cells into a genotoxic state that is conducive to oncogenesis and/or relapse of cancer. Among these epigenetic alteration mechanisms, histone modification is a major part of the mechanism that post-transcriptionally regulates the gene expression. This modification can involve methylation, acetylation, ubiquitylation, or phosphorylation of histone proteins. The methylation of histone proteins usually occurs at the side chains of arginine and lysine residues within the N-terminal region. Several enzymes regulating the methylation status of histone H3 lysine residues have been reported to have pathological and clinical significance in several cancers [7]. Although several studies have reported the epigenetic role of the enhancer of zeste homolog 2 (EZH2), an H3K27 methyltransferase, in extranodal lymphoma [7,8], there have not yet been any comprehensive studies on PCNSL.
In this study, we examined the methylation status of histone H3 lysine residues as major histone modification sites using immunohistochemical analysis of PCNSL samples obtained by biopsy or surgical resection. The primary aim of this study was to identify the specific methylation status of histone H3 lysine, which plays a prognostic role in patients with PCNSL. We also investigated the unique methylation and demethylation enzymes that modify the specific methylation status with the ability to predict the prognosis of patients with PCNSL.

Materials and Methods

1. Sample collection

We conducted a translational cohort study using formalin-fixed, paraffin-embedded (FFPE) tissue specimens of PCNSL that were obtained by biopsy or surgical resection at our institute from January 2007 to December 2019. During this period, 95 patients were histopathologically diagnosed with PCNSL. All patients included in this study had been recently diagnosed with PCNSL and received treatment and follow-up at our institution until death. Our institute is the sole regional university hospital, covering a population of 1,500,000 people. Patients with human immunodeficiency virus infection detected via serum screening were excluded from this study. The available histological samples were obtained from the Department of Pathology Archives of our institute. All hematoxylin and eosin-stained slides were reviewed again by two different pathologists (E.H. Lee and D.C. Kim) using the 2016 revision to the World Health Organization (WHO) classification of myeloid neoplasms and acute leukemia [9] and were blinded to the clinical and pathological parameters. Samples in a poor condition were excluded for the following reasons: the tumor was almost entirely necrotized, or the tumor contribution to the section was less than 80%. In addition, patients with insufficient medical data were excluded from the analysis.

2. Clinical data

Epidemiological characteristics (including sex, age at the time of diagnosis of PCNSL, and performance status), type of primary treatment for PCNSL, type of salvage treatment for recurrent and progressive disease, duration of the follow-up, and time of death were retrospectively reviewed from the medical records of each patient. For prognostic assessment, additional factors, such as the serum LDH level, protein concentration in the CSF, and deep brain involvement, were evaluated using the literature criteria provided by IELSG [5]. All patients were treated with the same protocol of high-dose methotrexate-based combination chemotherapy followed by adjuvant whole-brain radiotherapy.
Radiological characteristics of brain lesions were evaluated using magnetic resonance imaging (MRI) at the time of the initial diagnosis of PCNSL. The number was classified as unifocal or multifocal, based on the mass enhanced with gadolinium on T1 weighted MRI. The basal ganglia, corpus callosum, brain stem, and cerebellum were defined as deep brain structures. Peritumoral edema was categorized as < or ≥ 2 cm from the brain tumor, as assessed by the T2-weighted MRI. In cases of multiple brain lesions, regardless of the number of lesions, different patterns of enhancement on MRI were counted as heterogeneous enhancement. Radiological evaluation was performed by two different neuroradiologists (Y.M. Lee and M.O. Sunwoo) who were blinded to the clinical and pathological parameters.
In terms of pathological characteristics, routine analysis of diagnostic markers was performed at the time of initial diagnosis, such as pathological diagnosis according to the 2016 WHO classification, cell type, Epstein-Barr virus (EBV) in situ hybridization, Ki67 index, and immunoreactivity of B-cell Bcl-2/6, p53, multiple myeloma (MUM)-1, and c-Myc. These features were obtained from pathological reports.

3. Immunohistochemical staining and its interpretation

Immunohistochemical staining was used to examine the expression levels of methylated histone H3 lysine residues (H3K4me1, H3K4me3, H3K9me1, H3K9me2, H3K9me3, H3K14, H3K27me1, H3K27me2, H3K27me3, H3K36me1, H3K36me2, and H3K36me3). After confirming the significance of the hypomethylation of H3K4me3 and hypermethylation of H43K27me2/3, additional immunohistochemical staining for H3K4 demethylase (lysine-specific histone demethylase [LSD] 1–2 and Jumonji AT-rich interactive domain [JARID] 1A-D) and H3K27 methyltransferase (EZH 1 and 2) was performed. We sequentially obtained three or four sections from each FFPE block of PCNSL per patient. For immunohistochemical analysis, the labeled streptavidin-biotin method was applied to sections from FFPE tissues that had been used for disease diagnosis. Individual monoclonal or polyclonal primary antibodies were used according to the manufacturer’s instructions (S1 Table).
Appropriate positive and negative immunohistochemical controls were used in this study. Negative controls were samples in which the primary antibody was omitted. Sections from the normal brain cortex obtained from autopsy specimens were used as positive controls to detect each marker. Ten fields were selected from the regions with the highest concentrations of immunohistochemically stained nuclei and were examined at high magnification (×400). Each field corresponded to a total cell number ranging from 700–1,000 cells relative to the cellularity of the tumor specimen and area of necrosis; normal glial cells, normal epithelial cells of the brain, and endothelial cells were excluded. Considering 1,000 cells by manual counting, we recorded the immunoreactivity of proteins and markers as the percentage of immunohistochemically stained cells.
Two different neuropathologists (E.H. Lee and D.C. Kim), who were blinded to patient clinical and radiological information, reviewed all slides. If the difference between the percentages of immunoreactive cells calculated independently by the two pathologists was less than 5%, the mean of the two percentages was used. If the difference was 5% or more, defined as discordance, two reviewers determined the mean percentage of immunoreactivity after repeatedly counting the cells, and there were only three discordant cases (3.4%) of immunoreactivity. Digital images were captured using a microscope (model BX41TF, Olympus, Tokyo, Japan) and a digital camera (DP70, Olympus).
As there is no universal cutoff value for the immunoreactivity of these markers, the area under the receiver operating characteristic (ROC) curve was used to determine the optimal threshold of the mean percentage of immunoreactive cells from 1,000 cells. Sensitivity was calculated as the true-positive rate (the number of true-positives divided by the sum of the numbers of true-positives and false-negatives), specificity was estimated as the true-negative rate (the number of true-negatives divided by the sum of the numbers of true-negatives and false-positives), and accuracy as the sum of the number of true-positives and true-negatives divided by the total number of positives and negatives. True positives were those in which the immunoreactivity percentage above the cutoff value had a positive influence on overall survival (OS), and true negatives, in which the immunoreactivity percentage below the cutoff value had a negative influence on OS. We determined the threshold of immunoreactivity with the highest sensitivity and specificity. Through a sensitivity-specificity analysis, a cutoff point for immunoreactivity at which sensitivity and specificity crossed and that was correlated with longer survival was determined for each marker. Sequential correlation analysis for OS among the patients was performed according to the cutoff value established for these markers.

4. Western blotting analysis

Frozen samples of PCNSL obtained by the surgical resection of patients were processed for protein assays using standard western blotting analysis as follows. In brief, the samples were homogenized in 5 V of buffer containing 300 mM sucrose, 4 mM 4-(2-hydroxyethyl)-1-piperazineethanesulfonic acid (HEPES), 2 mM ethyleneglycoltetraacetic acid (EGTA), 1 mM phenylmethylsulfonyl fluoride, and 20 mM leupeptin using a polytron homogenizer at the maximum speed in five 5-second bursts. The homogenates were incubated at 4°C for 30 minutes and then centrifuged at 10,000 ×g for 30 minutes at 4°C. The lysates were collected, and the protein concentration was determined using the BCA Protein Assay kit (Abcam, Cambridge, MA). Equal amounts of proteins were separated by sodium dodecyl sulfate–polyacrylamide gel electrophoresis and transferred to polyvinylidene difluoride membranes (GE Healthcare Biosciences, Piscataway, NJ). The blots were initially blocked overnight with 5% milk in buffer containing 20 mM Tris-hydrogen chloride (Tris-HCl) (pH 7.4), 137 mM sodium chloride (NaCl), 0.05% Tween-20, and then incubated for 1 hour with anti-H3K4me3 antibody (1:500), anti-H3K27me2 antibody (1:500), anti-H3K27me3 antibody (1:500) (all from Abcam). After washing, the blots were incubated for 1 hour at room temperature with a horseradish peroxidase-linked goat anti-mouse secondary IgG antibody (1:500). The internal control was a monoclonal anti–glyceraldehyde 3-phosphate dehydrogenase (anti-GAPDH) antibody (1:250, Sigma, St. Louis, MO). The bound antibodies were visualized using an Amersham enhanced chemiluminescence kit. H3K4me3, H3K27me2, and H3K27me3 were quantified densitometrically using suitable autoradiographs of 300 mM sucrose, 4 mM HEPES, and EGTA. The relative intensity of the target bands was quantified using the Image J software and normalized to the intensity of GAPDH.

5. Survival and statistical analyses

Medical records of the clinical history and radiographic reports of all study subjects were analyzed to determine the progression-free survival (PFS) and overall survival (OS). Recurrence was defined as the development of a new lesion on T1-weighted MRI with contrast enhancement in the case of complete remission after conventional treatment of PCNSL. PFS was defined as an increase in the enhancing lesion on T1-weighted MRI by 50%. PFS was calculated from the date of initial treatment to recurrence and/or progression. The date of death was confirmed and recorded. OS was defined as the time from the date of pathological diagnosis of PCNSL until death. The date of biopsy or surgical resection of PCNSL was recorded as the date of diagnosis.
Statistical analyses were performed using SPSS ver. 20.0 (IBM Corp., Armonk, NY). Differences between subgroups were analyzed with Student’s t-test for normally distributed continuous values, Mann-Whitney U test for non-normally distributed continuous values, and chi-squared tests for categorical variables. OS was calculated using the Kaplan-Meier method. Comparisons among groups were performed using the log-rank test. Variables that were significantly associated with longer PFS and OS in patients with PCNSL in univariate analyses were further examined using multivariate analysis. Several additional variables associated with PFS and OS in the literature and of interest to investigators were also included in the multivariate analysis. In this analysis, the Cox proportional hazards regression model was used to assess the independent effects of specific factors on PFS and OS and to define the hazard ratios of significant covariates. Differences were considered statistically significant at two-sided p-values < 0.05.

Results

1. Characteristics of patients and tumors

Among 95 patients, who were histopathologically diagnosed with PCNSL between January 2007 and December 2019, 87 were ultimately enrolled in the study. Eight cases (8.4%) were excluded from this study as their tissues were almost entirely necrotized, or the tumor contribution to the sections was less than 80%, or the medical data were insufficient. The mean age of these patients at the time of PCNSL diagnosis was 57.6 years (range, 32.4 to 81.2 years). There were 45 men (51.7%) and 42 women (48.3%). Six patients (6.9%) had ocular involvement of the tumor. Serum LDH levels were elevated in 32 patients (36.8%), and CSF protein concentration was elevated in 54 patients (62.1%). Sixty-two patients (71.3%) exhibited an independent performance status in daily activity with an Eastern Cooperative Oncology Group performance score of 0–1, while 25 patients (28.7%) exhibited a score of 2–3. In terms of risk evaluation for prognosis, 28 patients (32.2%) were categorized as low risk (IELSG score of 0–1), 24 (39.1%) as intermediate risk (IELSG score of 2–3), and 25 (28.7%) as high risk (IELSG score of 4–5) (Table 1).
Regarding radiological features, 57 patients (65.5%) had unifocal, while 30 (34.5%) had multifocal brain lesions. There was involvement of the deep brain in 38 patients (43.7%) and CSF dissemination of tumor cells in five patients (5.7%). The maximal tumor size was 3 cm or larger in 40 patients (46.0%), and peritumoral edema was 2 cm or larger in 33 patients (37.9%). In T1-weight MRI, 19 patients (21.8%) showed homogenous enhancement of contrast. Thirty-one patients (35.6%) underwent gross total resection of the tumor for curative purposes, and 56 patients (64.4%) underwent biopsy or partial resection of the tumor for diagnostic purposes (Table 1).
Histopathological findings showed that 74 patients (85.1%) had diffuse large B-cell lymphoma (DLBCL), 32 (36.8%) had germinal center B-cell (GCB) lymphoma, and 55 (63.2%) had activated B-cell (ABC) lymphoma. Immunohistochemical staining showed positivity for BCL-2 in 66 patients (75.9%), BCL-6 in 69 patients (79.3%), p53 in 38 patients (43.7%), MUM-1 in 50 patients (57.5%), and c-Myc in 41 patients (47.1%). EBV was detected in 19 patients (21.8%) using in situ hybridization analysis. Ki67 was 50% or more in 56 patients (64.4%) (Table 1).
All patients were treated with high-dose methotrexate-based combination chemotherapy and/or whole-brain radiotherapy. They were followed-up for 6 months, and the median follow-up duration was 54.6 months (range, 6.0 to 150 months). Twenty-eight patients (32.2%) experienced recurrence or progression; mean time-to-progression was 19.8 months (range, 6.0 to 51.5 months) and mean PFS was 104.3 months (95% confidence interval [CI], 90.6 to 118.0 months). Eleven patients (12.6%) succumbed to the disease; the mean time-to-death was 21.0 months (range, 12.5 to 30.5 months). Mean OS was 132.1 months (95% CI, 122.2 to 141.9 months).

2. Immunohistochemical staining of histone H3 lysine residues

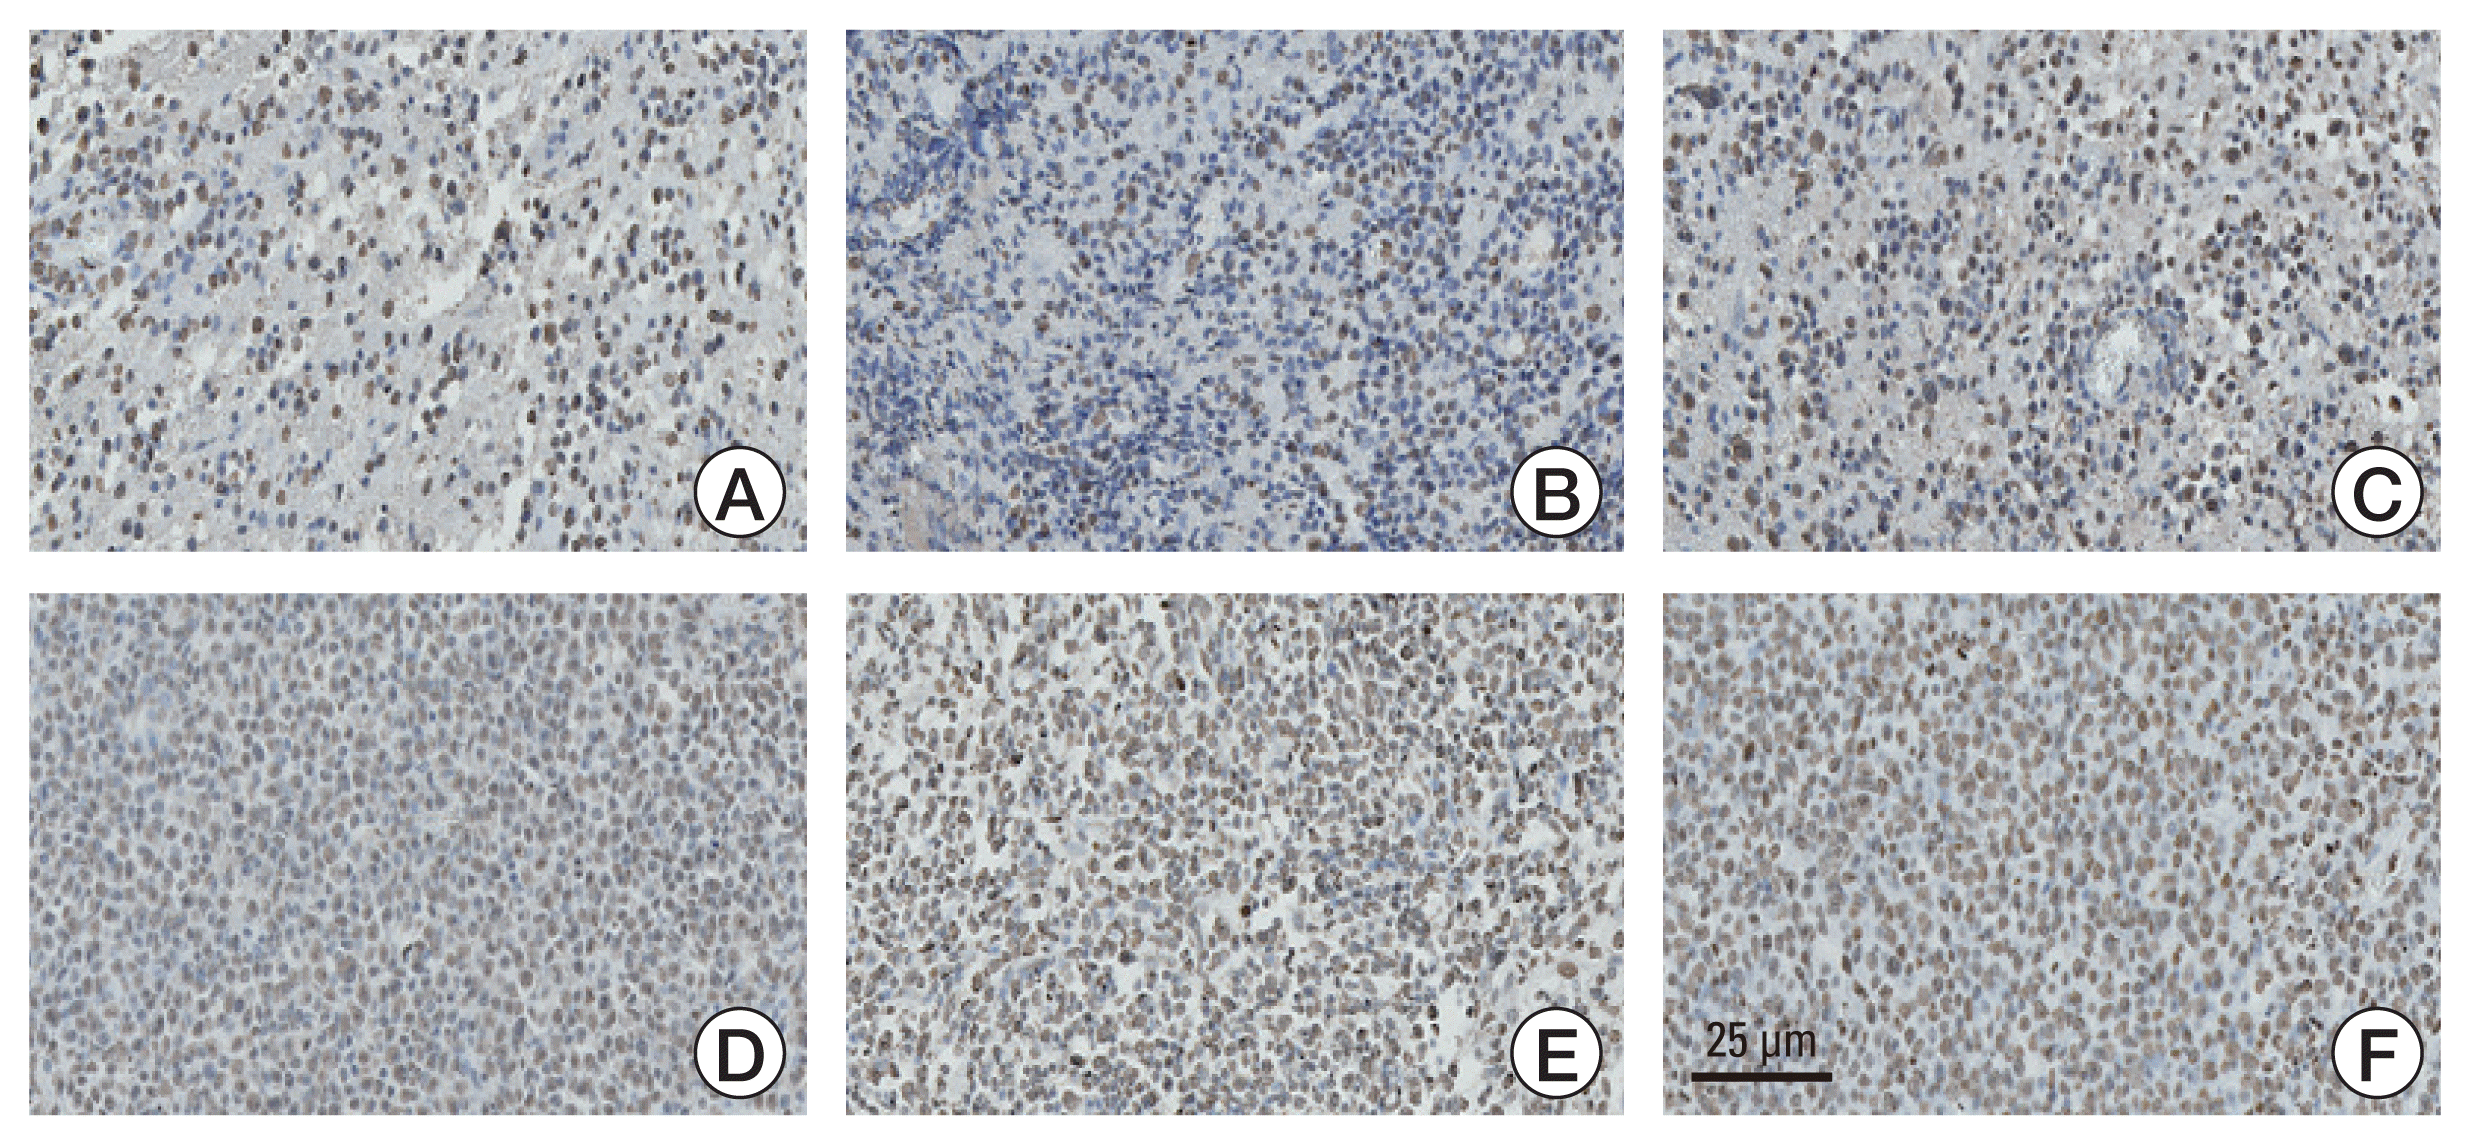
The commercially available histone H3 lysine residues were examined by immunohistochemical staining (Fig. 1) and categorized as high and low immunoreactivity according to the cutoff value, which was determined by ROC curve analysis (S2 Table).
The hypermethylation of H3K4me1 was observed in 55 patients (63.2%), H3K4me3 in 47 patients (54.0%), H3K9me1 in 24 patients (27.6%), H3K9me2 in 48 patients (55.2%), H3K9me3 in 52 patients (59.8%), H3K14 in 39 patients (44.8%), H3K27me1 in 41 patients (47.1%), H3K27me2 in 33 patients (37.9%), H3K27me3 in 27 patients (31.0%), H3K-36me1 in 44 patients (50.6%), H3K36me2 in 48 patients (55.2%), and H3K36me3 in 51 patients (58.6%) (Table 2). Among them, patients with hypomethylation of H3K4me3 had significantly more frequent recurrences than those with hypermethylation (p=0.004). In addition, patients with hypermethylation of H3K27me2 and H3K27me3 had more frequent recurrences than those with hypomethylation of the two (p < 0.001 and p=0.002, respectively) (Table 2).

3. Association of the methylation status of histone H3 lysine residues with PFS and OS

Patients with hypermethylation of H3K4me1 and H3K4me3 had longer mean PFS (112.4 months and 131.4 months, respectively) than those with hypomethylation (75.0 months and 69.3 months, respectively; p=0.052 and p=0.006, respectively) (Table 3). Also, patients with hypomethylation of H3K27me2 and H3K27me3 had longer mean PFS (130.3 months and 122.4 months, respectively) than those with hypermethylation (49.4 months and 48.5 months, respectively; p < 0.001 and p=0.001, respectively) (Table 3). The Kaplan-Meier survival curve showed the same results (Fig. 2). There was no statistical difference in PFS according to the methylation status of the histone H3 lysine residue.
Patients with hypermethylation of H3K4me1 and H3K4-me3 had longer mean OS (142.7 months and 142.9 months, respectively) than those with hypomethylation (90.6 months and 64.4 months, respectively; p=0.065 and p=0.002, respectively) (Table 3). Also, patients with hypomethylation of H3K27me2 and H3K27me3 had longer mean PFS (147.5 months and 145.4 months, respectively) than those with hypermethylation (76.5 months and 67.5 months, respectively; p=0.019 and p=0.011, respectively) (Table 3). The Kaplan-Meier survival curve showed the same results (Fig. 3). There was no statistical difference in OS according to the methylation status of the histone H3 lysine residue.

4. Histone-modifying enzymes of H3K4 and H3K27 in immunohistochemical analysis

After detecting the relationship between the hypomethylation of H3K4me3 and hypermethylation of H43K27me2/3 and the prognosis of patients with PCNSL, additional immunohistochemical staining for H3K4 demethylase (LSD1 and 2, JARID1A-D) and H3K27 methyltransferase (EZH1 and 2) was performed to examine the specific role of these modification enzymes in patients with PCNSL. In addition, these modifying enzymes were categorized as high and low immunoreactivity according to the cutoff value, which was determined by ROC curve analysis (S3 Table).
Among 40 samples with hypomethylated H3K4me3, 31 (77.5%) showed increased expression of JARID1A (H3K4 demethylase) in immunohistochemical analysis (Fig. 4A). A significant linear correlation between H3K4 and the expression of JARID1A was also observed in the reverse proportion (R2 linear=−1.431) (Fig. 4B). This result indicates that JARID1A, as an H3K4 demethylase, plays a major role in the hypomethylation of H3K4me3. Other H3K4 demethylases did not have a role in the hypomethylation of H3K4me3 in PCNSL cells. In addition, a total of 33 samples (100%) with hypermethylated H3K27me2 showed increased expression of EZH2 (H3K27 methyltransferase) in immunohistochemical analysis (Fig. 4C). A significant linear correlation between the hypermethylation of H3K27me2 and the expression of EZH2 was also observed in direct proportion (R2 linear=0.667) (Fig. 4D). This result indicates that EZH2, as an H3K27 methyltransferase, plays a major role in the hypermethylation of H3K27me2. Moreover, 25 out of 27 samples with hypermethylated H3K27me3 (92.6%) had increased expression of EZH2 (H3K27 methyltransferase) in immunohistochemical analysis (Fig. 4E). A significant linear correlation between the hypermethylation of H3K27me3 and the expression of EZH2 was also observed in direct proportion (R2 linear=0.604) (Fig. 4F). This result indicates that EZH2, as an H3K27 methyltransferase, plays a major role in the hypermethylation of H3K27me3. Other H3K27 methyltransferases did not have significant roles in the hypermethylation of H3K27me2 and H3K27me3 in PCNSL cells.
Univariate analysis showed several meaningful associations of PFS and OS with the expression of H3K4 methyltransferase and H3K27 demethylase. Patients with underexpression of JARID1A (H3K4 methyltransferase) had longer mean PFS than those with overexpression of JARID1A (121.7 months vs. 72.9 months, p=0.018). Also, patients with underexpression of EZH2 (H3K27 demethylase) had longer mean PFS than those with overexpression of EZH2 (126.4 months vs. 68.1 months, p=0.002) (Table 4). In terms of OS, same results showed that patients with underexpression of JARID1A and EZH2 had longer mean OS than those with overexpression of JARID1A and EZH2 (150.9 months vs. 98.2 months and 167.4 months vs. 74.3 months, respectively) (Table 4). There was no statistical difference in PFS and OS according to the expression of other H3K4 methyltransferases and H3K27 demethylases. The Kaplan-Meier survival curve showed the same results as the underexpression of JARID1A and EZH2 should be associated with longer PFS and OS (S4 and S5 Figs.).
Multivariate analysis using the Cox regression model showed that hypermethylation of H3K4me3 (hazard ratio [HR], 3.76; 95% CI, 1.86 to 5.65), hypomethylation of H3K-27me2 (HR, 5.14; 95% CI, 3.42 to 6.86), hypomethylation of H3K-27me3 (HR, 4.73; 95% CI, 2.97 to 6.49), underexpression of JARID1A (HR, 2.92; 95% CI, 1.61 to 4.23), and underexpression of EZH2 (HR, 4.42; 95% CI, 2.15 to 6.69) were independently associated with longer PFS (Table 5). Hypermethylation of H3K4me1, underexpression of LSD2, underexpression of JARID1B, and underexpression of EZH1, which had a tendency for longer PFS in univariate analysis, were not associated with longer PFS after multifactor adjustment. In addition, hypermethylation of H3K4me1 (HR, 2.78; 95% CI, 1.21 to 4.35), hypermethylation of H3K4me3 (HR, 2.68; 95% CI, 1.28 to 4.08), hypomethylation of H3K27me2 (HR, 4.60; 95% CI, 3.02 to 6.18), hypomethylation of H3K27me3 (HR, 6.31; 95% CI, 3.94 to 8.68), underexpression of JARID1A (HR, 3.32; 95% CI, 1.57 to 5.07), and underexpression of EZH2 (HR, 5.08; 95% CI, 2.81 to 7.35) were independently associated with longer OS (Table 5).

5. Histone-modifying enzymes of H3K4 and H3K27 in western blotting analysis

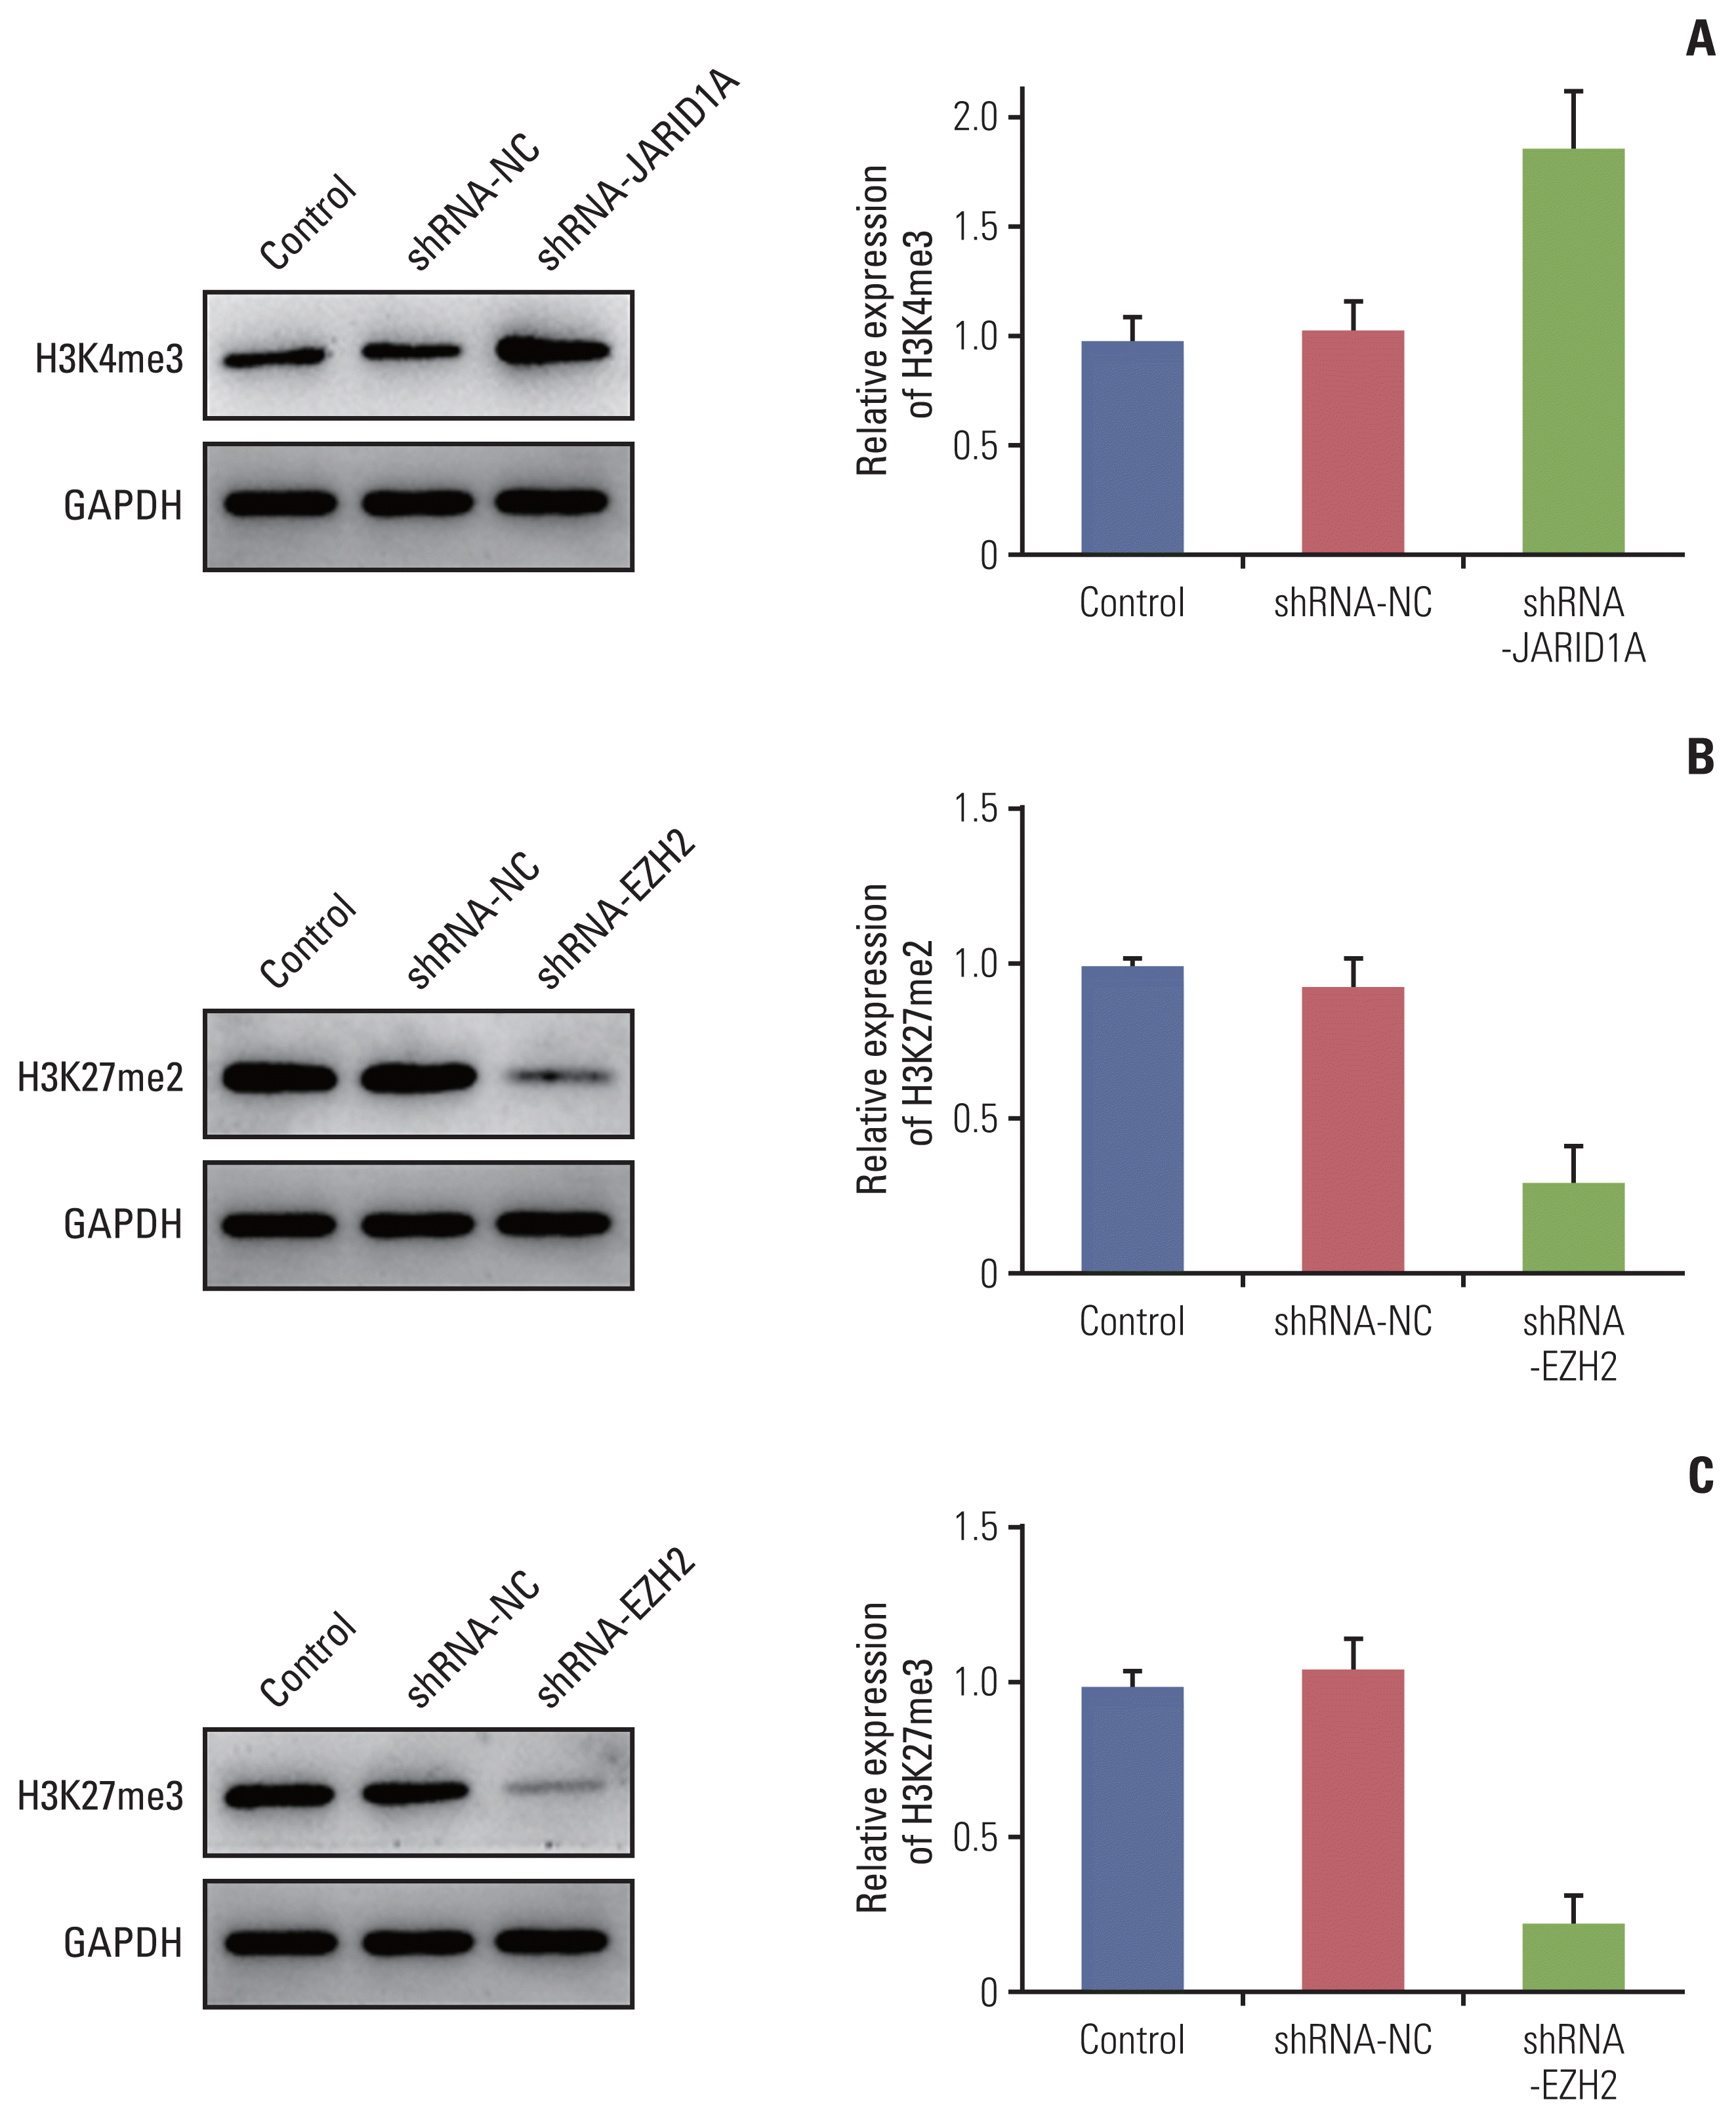
The expression of H3K4me3 was significantly upregulated in the silenced JARID1A cells than the negative control cells (p < 0.001) (Fig. 5A). However, the expression levels of H3K27me2 and H3K27me3 were significantly downregulated in the silenced EZH2 cells than the negative control cells (p < 0.001) (Fig. 5B and C).

Discussion

The primary aim of this study was to identify the specific methylation status of histone H3 lysine residues that play a prognostic role in patients with PCNSL using immunohistochemical analysis of 87 PCNSL samples. To the best of our knowledge, this study is the first translational research to suggest the epigenetic role of histone H3 lysine methylation status in predicting the prognosis of patients with PCNSL because of the rarity of the disease. Although several reports have shown that H3K27 mutation is associated with poor prognosis in pediatric high-grade gliomas [1012], there have been no comprehensive studies suggesting the epigenetic role of the methylation status of histone H3 lysine in predicting the prognosis in other cancers, including PCNSL. These mutations in pediatric high-grade gliomas are mutually exclusive recurrent somatic missense mutations in the amino tail of histone H3 genes: a lysine-to-methionine substitution at position 27 of histone 3.1 or 3.3 (H3K27M) and a glycine-to-arginine (or valine) substitution at position 34 of histone 3.3 (H3.3G34R/V) [11,12]. In terms of associated gene mutations, H3K27M mutant gliomas have PDGFRA amplification or ACVR1 mutations, and H3G34R/V mutant gliomas have the ATRX mutation. TP53 mutations are common in all histone-mutated glioma subsets [10]. However, we did not perform a comprehensive study to identify the specific genetic alterations associated with the methylation status of histone H3 lysine residues. The present study is the first to show that the methylation status of H3K4me3 and H3K27me2/3 has a prognostic role in patients with PCNSL. However, further experiments should be performed to find out the specific genetic alteration which is derived by the hypomethylation of H3K4me3 and hypermethylation of H3K27me2/3.
The present study showed that EZH2, an H3K27 demethylase, plays a role in predicting the prognosis of patients with PCNSL as well as the methylation status of the histone H3 lysine. Several studies have reported that EZH2, as an epigenetic histone-modifying enzyme, should be a poor prognostic marker in lymphoid malignancies, including DLBCL, when they have gain-of-function somatic mutation [7,13,14]. EZH2 is the catalytic component of the polycomb repressive complex 2, which methylates histone H3 lysine 27, resulting in a mark that specifies a transcriptionally repressive chromatin environment. EZH2 aberrations have been observed in a wide range of oncogenic processes, including cancer cell proliferation, cell cycle regulations, disruption of immunologic defenses, chromosomal gain or loss, and the activation of apoptotic pathway [7,14,15]. EZH2 overexpression was first described in several non-hematologic malignancies, including prostate cancer, breast cancer, bladder cancer, gastric cancer, lung cancer, hepatocellular carcinoma, renal cell carcinoma, and melanoma [10]. Although high expression levels of EZH2 have been directly correlated with a more aggressive clinical course and increased rates of metastasis in prostate, renal cell, and breast cancers [16], there have been no comprehensive studies on PCNSL.
In terms of EZH2 role in the oncogenesis of lymphoma, Morin et al. [17] had similar findings as ours, and they suggested that deregulated histone modification due to EZH2 mutations is likely to result in hypermethylation of H3K27 and that it acts as a core driver event in the development of non-Hodgkin lymphoma with analysis of RNA sequencing data from 13 DLBCLs. Their results also suggested that epigenetic modification of histone H3K27 is of key importance, especially in GCB cells [17]. However, there was no significant difference in the frequency of hypermethylation of H3K27me2 (34.3% of GCB type vs. 40.0% of ABC type; p=0.448) and H3K27me3 (28.1% of GCB type vs. 32.7% of ABC type; p=0.615) in our study. This discrepancy might originate from the differences in sample size and method of data analysis.
Other studies have shown that EZH2 induces the dysregulation of signaling pathways in developing cancer by mediating c-Myc–miRNA–EZH2 oncogenic axis or loop; c-Myc upregulates EZH2 through repression of the EZH2-targeting certain miRNAs and that EZH2 could induce c-Myc expression in reverse via inhibition of c-Myc targeting specific miRNA [18]. Although c-Myc is a strong prognostic marker in our study, we did not find a relationship between c-Myc and EZH2 expression; among the 33 samples with overexpression of EZH2, 15 samples (45.5%) had positive immunoreactivity for c-Myc, and another 18 samples (54.5%) had negative immunoreactivity for c-Myc. This discrepancy might also originate from the differences in sample size and method of data analysis.
Many studies have reported the relationship between EBV infection and the development of lymphomas [19]. The life cycle of EBV is regulated by an epigenetic switch system that induces EBV virus expression on and off. EZH2 is known to be an epigenetic histone-modifying enzyme that maintains EBV latency and reactivates EBV action by regulating histone H3K27 methylation [20]. Although EBV infection was analyzed using the in situ hybridization technique in our study, there was no relationship between positive infection and clinical outcome. These results may originate from the fact that EBV viral gene products can indirectly affect EZH2 expression by modulating the EZH2 upstream gene NF-κB (nuclear factor κB) via multiple pathways [21].
The prognostic role of hypomethylated H3K4 was induced by overexpression of JARID1A as H3K4 demethylase in the present study. Although there have been no studies focused on the role of the methylation status of H3K4 in certain diseases, mutations in H3K4 demethylase are known to be related to a number of diseases. JARID1 family proteins often function as important transcriptional corepressors of development-related genes, such as the HOX gene in JARID1A [22]. In terms of tumorigenesis points, despite the initial isolation of JARID1A from retinoblastoma tumor suppressor protein decades ago [23], its mechanistic role in oncogenesis is still unknown. Recently, various studies have shown that JARID1 could repress differentiation, promote angiogenesis, drug resistance, and epithelial-mesenchymal transition, enhance adhesion, metastasis, invasiveness, proliferation, and cell motility in several cancer cells, and also worsen the outcomes of patients with drug resistance [24]. However, to date, there has been no meaningful study focused on the role of JARID1A in PCNSL.
Interestingly, the bimodal function of the JARID1 family in tumor progression and suppression has been considered in several cancers. In terms of oncogenic function, JARID1A is significantly amplified and overexpressed in breast cancer and neck squamous cell carcinoma, JARID1B is upregulated in prostate, hepatocellular carcinoma, and ovarian cancer, and upregulated JARID1C is associated with poor prognosis in breast and prostate cancers [25]. However, there are reports that JARID1B inhibits proliferation and reduces drug resistance in breast cancer [26]. The tumor suppressor function of JARID1C has been confirmed in clear cell renal cell carcinomas and human papilloma virus-related malignancies, and JARID1D was shown to be a tumor suppressor based on its downregulation, mutation, or loss in prostate cancer and clear cell renal cell carcinomas [25]. These diverse roles for JARID1 proteins, including JARID1A, in multiple cancer types underscore their high context dependence as potential cancer biomarkers and drug targets.
Although our study showed a meaningful epigenetic role for the methylation status of histone H3K4m3 and histone H3K27me2/3 in predicting the prognosis of patients with PCNSL, as well as the causal relationship between methylation status and specific histone-modifying enzymes, it had several limitations. First, our analyses in the present study were performed using immunohistochemical staining and western blotting at the protein level rather than higher genetic and molecular technology, such as RNA sequencing for searching specific target genes and chromatin immunoprecipitation sequencing to determine the step methylation of histone H3 lysine. Although the present study illustrated the association of methylation status of H3K4 and H3K27 and clinical outcome, it could not determine the specific genetic role in cancer biology rather than a certain causal relationship. Due to the heterogeneity of cancer biology in single cancers, more comprehensive research is essential. When the epigenome is disrupted, either independently of genetic mutations or as a result, tumor cells can start to evolve based on the selection of favorable epigenetic states. This can lead to the production of tumor subclones that are genetically identical; however, in reality, they express different combinations of genes and/or have altered the level at which certain genes are expressed. In addition to producing more aggressive characteristics, increased tumor heterogeneity decreases the likelihood that any one treatment will be able to kill every subclone, which can lead to chemoresistance and relapse [27]. As a result, JARID1A and EZH2 are part of a full mechanism in the epigenetic regulation of PCNSL tumorigenesis and progression. More comprehensive scientific evidence, supported by molecular genetic analysis using in vivo as well as in vitro studies, is mandatory to validate the present results. It is also important to identify the unique target mechanism of methylation of histone H3 lysine residues to determine their role in the cancer biology of PCNSL.
Second, the present study did not examine all histone H3 lysine residues or histone modification enzymes. Although histone H3K4, H3K9, H3K14, H3K27, and H3K36 were included in this analysis, H3K79 and H4K20 are also known to play a role in the cancer biology of certain diseases [28]. In addition, all histone modification enzymes of each histone H3 lysine residue were not included in our study. Proteins that could be purchased commercially were used in this analysis, and we did not prepare the materials. Although JARID1A and EZH2 play specific roles in PCNSL cells, there may be other specific enzymes that play an important role in the oncogenesis of PCNSL. Therefore, our results do not reflect all the possible mechanisms of epigenetic regulation of methylation status in PCNSL. It is necessary for the investigators to perform a sequencing analysis to determine the target genes in more samples and validate the results of in vivo and in vitro studies.
Third, although two different neuropathologists assessed the immunoreactivity in the samples, it is not certain whether our assessment of experiments in this study is correct because the interpretation of the results obtained by immunohistochemical staining may be rather subjective. The optimal assessment of immunohistochemical staining results can differ according to the concentration of the antigen used for staining because of the difficulty in establishing standard conditions. In addition, there is no standard rule for determining the cutoff value between positive and negative findings. Therefore, it is necessary to establish a reasonable cutoff value to repeat the experiments for validation and to cooperate and communicate details regarding the interpretation of the data among the investigators. To overcome the flaws in immunohistochemical staining, we used ROC curve analysis to establish the cutoff value in a principled manner. To determine the identity of immunoreactivity for histone H3 lysine residues and histone lysine modification enzymes at the cell level, an in vitro study will be helpful. Recently, a deep-learning–based method using artificial intelligence that can automatically localize and quantify the regions expressing biomarkers in any selected area on a whole slide image has been proposed [29].
Finally, another limitation of this study was the bias originating from the retrospective design of the study. If the number of patients is sufficiently large, this limitation can be overcome. However, our study involved a small number of subjects and may not meet the full assumptions of the statistical tests used. We did our best to reduce the bias by obtaining the clinical data from computerized data archives using a uniform system and including the candidate patients treated with the same protocol in a single center. Multiple researchers that were involved in this study did not have any clinical information or experimental results to help avoid any preconception. Pathological findings and radiological features were also independently reviewed, but there was no clear bias due to the retrospective nature of the analysis. Despite these efforts, however, the conclusions drawn from our study need further validation through prospective and randomized clinical trials in the future.
In the present study, we investigated the prognostic role of the methylation status of histone H3 lysine modification in patients with PCNSL via immunohistochemical analysis. We found that the hypomethylation of H3K4me3 and hypermethylation of H3K27me2/3 are associated with poor outcomes in patients with PCNSL. In addition, the methylation status of these residues was regulated by JARID1A (H3K4 demethylase) and EZH2 (H3K27 methyltransferase), respectively, among several other H3K4 demethylases and H3K27 methyltransferases. The application of the results of this study to future investigations and clinical trials can aid in the development of novel treatment strategies.
Electronic Supplementary Material

Supplementary materials are available at Cancer Research and Treatment website (https://www.e-crt.org).

Acknowledgments

We thank MinGyu Lee (Department of Molecular and Cellular Oncology, The University of Texas MD Anderson Cancer Center) for his comprehensive motivation for our original research, Young Min Kim and Mi-Ok Sunwoo (Department of Radiology, Samsung Changwon Hospital) for their review of the neuroradiological images, Tae Gyu Kim (Department of Radiation Oncology, Samsung Changwon Hospital) for administering the radiotherapy, and Young Wook Kim (Department of Biostatistics, Samsung Changwon Hospital) for assistance with the statistical analysis detailed in this work.
This research was supported by the National Research Foundation of Korea (NRF) grant funded by the Korean Government (The Ministry of Science and ICT) (Grant No. NRF 2019R 1F1A 1054681). This paper was also financially supported by Sungkyun Research Fund, Sungkyunkwan University (2016) and Samsung Changwon Hospital Research Fund (2020).

Notes

Ethical Statement

The Institutional Review Board (IRB) of our institute approved the study protocol (IRB number: SCMC 2021-07-007). This study was conducted in accordance with the guidelines of the Declaration of Helsinki for biomedical research. Written informed consent was waived off owing to the retrospective nature of the study.

Author Contributions

Conceived and designed the analysis: Kim HG, Kim YZ.

Collected the data: Kim HG, Kim MS, Lee YS, Lee EH, Kim DC, Lee SH.

Contributed data or analysis tools: Kim HG, Kim MS, Lee YS, Lee EH, Kim DC, Lee SH.

Performed the analysis: Kim HG, Kim YZ.

Wrote the paper: Kim HG, Kim YZ.

Conflicts of Interest

The author, S.H.L. is from Clinomics Inc. All the other authors declare no competing interests concerning the materials or methods used in this study or the findings specified in this paper. The funders had no role in the design of the study; in the collection, analyses, or interpretation of data; in the writing of the manuscript, or in the decision to publish the results.

References

1. Dho YS, Jung KW, Ha J, Seo Y, Park CK, Won YJ, et al. An updated nationwide epidemiology of primary brain tumors in Republic of Korea, 2013. Brain Tumor Res Treat. 2017; 5:16–23.
crossref
2. O’Neill BP, Decker PA, Tieu C, Cerhan JR. The changing incidence of primary central nervous system lymphoma is driven primarily by the changing incidence in young and middle-aged men and differs from time trends in systemic diffuse large B-cell non-Hodgkin’s lymphoma. Am J Hematol. 2013; 88:997–1000.
crossref
3. Mead GM, Bleehen NM, Gregor A, Bullimore J, Shirley D, Rampling RP, et al. A medical research council randomized trial in patients with primary cerebral non-Hodgkin lymphoma: cerebral radiotherapy with and without cyclophosphamide, doxorubicin, vincristine, and prednisone chemotherapy. Cancer. 2000; 89:1359–70.
crossref
4. Hoang-Xuan K, Bessell E, Bromberg J, Hottinger AF, Preusser M, Ruda R, et al. Diagnosis and treatment of primary CNS lymphoma in immunocompetent patients: guidelines from the European Association for Neuro-Oncology. Lancet Oncol. 2015; 16:e322–32.
crossref
5. Ferreri AJ, Blay JY, Reni M, Pasini F, Spina M, Ambrosetti A, et al. Prognostic scoring system for primary CNS lymphomas: the International Extranodal Lymphoma Study Group experience. J Clin Oncol. 2003; 21:266–72.
crossref
6. King RL, Goodlad JR, Calaminici M, Dotlic S, Montes-Moreno S, Oschlies I, et al. Lymphomas arising in immune-privileged sites: insights into biology, diagnosis, and pathogenesis. Virchows Arch. 2020; 476:647–65.
crossref
7. Bakhshi TJ, Georgel PT. Genetic and epigenetic determinants of diffuse large B-cell lymphoma. Blood Cancer J. 2020; 10:123.
crossref
8. Lue JK, Amengual JE. Emerging EZH2 inhibitors and their application in lymphoma. Curr Hematol Malig Rep. 2018; 13:369–82.
crossref
9. Arber DA, Orazi A, Hasserjian R, Thiele J, Borowitz MJ, Le Beau MM, et al. The 2016 revision to the World Health Organization classification of myeloid neoplasms and acute leukemia. Blood. 2016; 127:2391–405.
crossref
10. Graham MS, Mellinghoff IK. Histone-mutant glioma: molecular mechanisms, preclinical models, and implications for therapy. Int J Mol Sci. 2020; 21:7193.
crossref
11. Schwartzentruber J, Korshunov A, Liu XY, Jones DT, Pfaff E, Jacob K, et al. Driver mutations in histone H3.3 and chromatin remodelling genes in paediatric glioblastoma. Nature. 2012; 482:226–31.
12. Wu G, Broniscer A, McEachron TA, Lu C, Paugh BS, Becksfort J, et al. Somatic histone H3 alterations in pediatric diffuse intrinsic pontine gliomas and non-brainstem glioblastomas. Nat Genet. 2012; 44:251–3.
crossref
13. Li B, Chng WJ. EZH2 abnormalities in lymphoid malignancies: underlying mechanisms and therapeutic implications. J Hematol Oncol. 2019; 12:118.
crossref
14. Beguelin W, Rivas MA, Calvo Fernandez MT, Teater M, Purwada A, Redmond D, et al. EZH2 enables germinal centre formation through epigenetic silencing of CDKN1A and an Rb-E2F1 feedback loop. Nat Commun. 2017; 8:877.
crossref
15. Schmitz R, Wright GW, Huang DW, Johnson CA, Phelan JD, Wang JQ, et al. Genetics and pathogenesis of diffuse large B-cell lymphoma. N Engl J Med. 2018; 378:1396–407.
crossref
16. Wagener N, Macher-Goeppinger S, Pritsch M, Husing J, Hoppe-Seyler K, Schirmacher P, et al. Enhancer of zeste homolog 2 (EZH2) expression is an independent prognostic factor in renal cell carcinoma. BMC Cancer. 2010; 10:524.
crossref
17. Morin RD, Mendez-Lago M, Mungall AJ, Goya R, Mungall KL, Corbett RD, et al. Frequent mutation of histone-modifying genes in non-Hodgkin lymphoma. Nature. 2011; 476:298–303.
crossref
18. Zhao X, Lwin T, Zhang X, Huang A, Wang J, Marquez VE, et al. Disruption of the MYC-miRNA-EZH2 loop to suppress aggressive B-cell lymphoma survival and clonogenicity. Leukemia. 2013; 27:2341–50.
crossref
19. Tateishi K, Miyake Y, Nakamura T, Yamamoto T. Primary central nervous system lymphoma: clinicopathological and genomic insights for therapeutic development. Brain Tumor Pathol. 2021; 38:173–82.
crossref
20. Murata T, Kondo Y, Sugimoto A, Kawashima D, Saito S, Isomura H, et al. Epigenetic histone modification of Epstein-Barr virus BZLF1 promoter during latency and reactivation in Raji cells. J Virol. 2012; 86:4752–61.
crossref
21. de Oliveira DE, Ballon G, Cesarman E. NF-kappaB signaling modulation by EBV and KSHV. Trends Microbiol. 2010; 18:248–57.
22. Christensen J, Agger K, Cloos PA, Pasini D, Rose S, Sennels L, et al. RBP2 belongs to a family of demethylases, specific for tri-and dimethylated lysine 4 on histone 3. Cell. 2007; 128:1063–76.
crossref
23. Mao S, Neale GA, Goorha RM. T-cell oncogene rhombotin-2 interacts with retinoblastoma-binding protein 2. Oncogene. 1997; 14:1531–9.
crossref
24. Yang GJ, Zhu MH, Lu XJ, Liu YJ, Lu JF, Leung CH, et al. The emerging role of KDM5A in human cancer. J Hematol Oncol. 2021; 14:30.
crossref
25. Harmeyer KM, Facompre ND, Herlyn M, Basu D. JARID1 histone demethylases: emerging targets in cancer. Trends Cancer. 2017; 3:713–25.
crossref
26. Hou J, Wu J, Dombkowski A, Zhang K, Holowatyj A, Boerner JL, et al. Genomic amplification and a role in drug-resistance for the KDM5A histone demethylase in breast cancer. Am J Transl Res. 2012; 4:247–56.
27. Easwaran H, Tsai HC, Baylin SB. Cancer epigenetics: tumor heterogeneity, plasticity of stem-like states, and drug resistance. Mol Cell. 2014; 54:716–27.
crossref
28. Hyun K, Jeon J, Park K, Kim J. Writing, erasing and reading histone lysine methylations. Exp Mol Med. 2017; 49:e324.
crossref
29. Sheikhzadeh F, Ward RK, van Niekerk D, Guillaud M. Automatic labeling of molecular biomarkers of immunohistochemistry images using fully convolutional networks. PLoS One. 2018; 13:e0190783.
crossref

Fig. 1
Examples of immunohistochemical staining of H3K4me3 (A, D), H3K27me2 (B, E), and H3K27me3 (C, F). Upper lane (A–C) indicates the hypomethylated status and bottom lane (D–F) indicates the hypermethylated status.
crt-2021-1121f1.gif
Fig. 2
Kaplan-Meier survival curves for progression-free survival according to the methylation status of the histone H3 lysine residues: (A) H3K4me1, (B) H3K4me3, (C) H3K9me1, (D) H3K9me2, (E) H3K9me3, (F) H3K14. (G) H3K27me1, (H) H3K27me2, (I) H3K27me3, (J) H3K36me1, (K) H3K36me2, and (L) H3K36me3.
crt-2021-1121f2.gif
Fig. 3
Kaplan-Meier survival curves for overall survival according to the methylation status of the histone H3 lysine residues: (A) H3K4me1, (B) H3K4me3, (C) H3K9me1, (D) H3K9me2, (E) H3K9me3, (F) H3K14. (G) H3K27me1, (H) H3K27me2, (I) H3K27me3, (J) H3K36me1, (K) H3K36me2, and (L) H3K36me3.
crt-2021-1121f3.gif
Fig. 4
Illustration of the relationship between the methylation status of histone H3 lysine residue and the expression of histone modification enzyme in immunohistochemical staining. Diagram of hypomethylated H3K4me3 and increased expression of Jumonji AT-rich interactive domain 1A (JARID1A) (A), hypermethylated H3K27me2 and increased expression of enhancer of zeste homolog 2 (EZH2) (C), and hypermethylated H3K27me3 and increased expression of EZH2 (E). Linear correlation of H3K4me3 immunoreactivity and expression of JARID1A (B), H3K27me2 immunoreactivity and expression of EZH2 (D), and H3K27me3 immunoreactivity and expression of EZH2 (F).
crt-2021-1121f4.gif
Fig. 5
Western blotting analysis showed that the expression of H3K4me3 was significantly upregulated in the silenced Jumonji AT-rich interactive domain 1A (JARID1A) cells (A), while the expression levels of H3K27me2 (B) and H3K27me3 (C) were significantly downregulated in the silenced enhancer of zeste homolog 2 (EZH2) cells. GAPDH, glyceraldehyde 3-phosphate dehydrogenase.
crt-2021-1121f5.gif
Table 1
Clinical data of 87 patients with primary CNS lymphoma
No. (%)
Clinical feature
 Age (yr)
  ≥ 60 49 (56.3)
  < 60 38 (43.7)
 Sex
  Male 45 (51.7)
  Female 42 (48.3)
 Ocular involvement
  Yes 6 (6.9)
  No 81 (93.1)
 Elevated serum LDH
  Yes 32 (36.8)
  No 55 (63.2)
 Elevated protein in CSF
  Yes 54 (62.1)
  No 33 (37.9)
 ECOG performance score
  0–1 62 (71.3)
  2–3 25 (28.7)
 Adjuvant cytarabine treatment
  Yes 6 (6.9)
  No 81 (93.1)
 Risk of IELSG
  0–1 28 (32.2)
  2–3 34 (39.1)
  4–5 25 (28.7)
Radiological feature
 Patterns
  Unifocal 57 (65.5)
  Multifocal 30 (34.5)
 Deep location involvement
  Yes 38 (43.7)
  No 49 (56.3)
 CSF seeding
  Yes 5 (5.7)
  No 82 (94.3)
 Maximal size of tumor (cm)
  ≥ 3 40 (46.0)
  < 3 47 (54.0)
 Peritumoral edema (cm)
  ≥ 2 33 (37.9)
  < 2 54 (62.1)
 Enhancement patterns
  Homo 19 (21.8)
  Hetero 68 (78.2)
 Surgical extent
  GTR 31 (35.6)
  Bx 56 (64.4)
Pathological feature
 Pathological classification
  DLBCL 74 (85.1)
  Others 13 (14.9)
 Cell type
  GCB 32 (36.8)
  ABC 55 (63.2)
 BCL-2
  Positive 66 (75.9)
  Negative 21 (24.1)
 BCL-6
  Positive 69 (79.3)
  Negative 18 (20.7)
 p53
  Positive 38 (43.7)
  Negative 49 (56.3)
 MUM1
  Positive 50 (57.5)
  Negative 37 (42.5)
 C-myc
  Positive 41 (47.1)
  Negative 46 (52.9)
 EBV in situ hybridization
  Positive 19 (21.8)
  Negative 68 (78.2)
 Ki67 index (%)
  ≥ 50 56 (64.4)
  < 50 31 (35.6)

ABC, activated B-cell; BCL-2, B-cell lymphoma-2; BCL-6, B-cell lymphoma-6; Bx, biopsy; CSF, cerebrospinal fluid; DLBCL, diffuse large B-cell lymphoma; EBV, Epstein-Barr Virus; ECOG, Eastern Cooperative Oncology Group; GCB, germinal center B-cell; GTR, gross total resection; IELSG, International Extranodal Lymphoma Study Group; LDH, lactate dehydrogenase; MUM1, multiple myeloma-1.

Table 2
Methylation status of histone H3 lysine in 87 primary CNS lymphoma samples
Total (n=87) Recurrence (+) (n=28) Recurrence (−) (n=59) p-value
H3K4me1
 Hypermethylation 55 (63.2) 16 (29.1) 39 (70.9) 0.122
 Hypomethylation 32 (36.8) 12 (37.5) 20 (62.5)
H3K4me3
 Hypermethylation 47 (54.0) 6 (12.8) 41 (87.2) 0.004
 Hypomethylation 40 (46.0) 22 (55.0) 18 (45.0)
H3K9me1
 Hypomethylation 63 (72.4) 21 (33.3) 42 (66.7) 0.882
 Hypermethylation 24 (27.6) 7 (29.2) 17 (70.8)
H3K9me2
 Hypomethylation 39 (44.8) 12 (30.8) 27 (69.2) 0.475
 Hypermethylation 48 (55.2) 16 (33.3) 32 (66.7)
H3K9me3
 Hypomethylation 35 (40.2) 12 (34.3) 23 (65.7) 0.493
 Hypermethylation 52 (59.8) 16 (30.8) 36 (59.2)
H3K14
 Hypomethylation 48 (55.2) 15 (31.3) 33 (68.7) 0.855
 Hypermethylation 39 (44.8) 13 (33.3) 26 (66.7)
H3K27me1
 Hypermethylation 41 (47.1) 14 (34.1) 27 (65.9) 0.529
 Hypomethylation 46 (52.9) 14 (30.4) 32 (69.6)
H3K27me2
 Hypermethylation 33 (37.9) 20 (60.6) 13 (39.4) < 0.001
 Hypomethylation 54 (62.1) 8 (14.8) 46 (85.2)
H3K27me3
 Hypermethylation 27 (31.0) 16 (59.3) 11 (40.7) 0.002
 Hypomethylation 60 (69.0) 12 (20.0) 48 (80.0)
H3K36me1
 Hypomethylation 43 (49.4) 15 (34.9) 28 (65.1) 0.622
 Hypermethylation 44 (50.6) 13 (29.5) 31 (70.5)
H3K36me2
 Hypomethylation 39 (44.8) 11 (28.2) 28 (71.8) 0.475
 Hypermethylation 48 (55.2) 17 (35.4) 31 (65.6)
H3K36me3
 Hypomethylation 36 (41.4) 12 (33.3) 24 (66.7) 0.923
 Hypermethylation 51 (58.6) 16 (31.4) 35 (68.6)

Values are presented as number (%). CNS, central nervous system.

Table 3
Progression-free survival and overall survival according to methylation status of histone H3 lysine
Progression-free survival (mo) Overall survival (mo)


Mean±SE HR (95% CI) p-value Mean±SE HR (95% CI) p-value
H3K4me1

 Hypermethylation 112.4±7.4 2.03 (1.02–3.04) 0.052 142.7±4.1 2.14 (0.95–3.36) 0.065

 Hypomethylation 75.0±9.5 90.6±8.9

H3K4me3

 Hypermethylation 131.4±6.7 6.31 (3.75–8.87) 0.006 142.9±4.4 8.32 (4.55–12.09) 0.002

 Hypomethylation 69.3±9.3 14.4±1.9

H3K9me1

 Hypomethylation 105.0±12.4 1.14 (0.36–1.91) 0.828 134.5±5.5 1.71 (0.80–2.62) 0.429

 Hypermethylation 102.9±7.9 120.2±11.1

H3K9me2

 Hypomethylation 108.9±9.3 1.51 (0.75–2.27) 0.457 125.1±8.5 1.38 (0.37–2.39) 0.705

 Hypermethylation 92.9±8.1 124.5±5.0

H3K9me3

 Hypermethylation 107.4±8.3 1.46 (0.72–2.01) 0.512 128.6±6.9 1.33 (0.40–2.26) 0.692

 Hypomethylation 92.5±9.4 124.0±6.0

H3K14

 Hypomethylation 106.5±9.1 1.20 (0.59–1.81) 0.755 132.3±6.7 1.18 (0.32–2.04) 0.893

 Hypermethylation 96.3±8.7 123.3±6.9

H3K27me1

 Hypomethylation 108.3±8.6 1.61 (0.77–2.45) 0.302 141.2±4.9 1.57 (0.62–2.52) 0.380

 Hypermethylation 91.7±9.0 109.4±8.0

H3K27me2

 Hypomethylation 130.3±6.2 12.82 (6.35–19.29) < 0.001 147.5±2.4 4.05 (1.99–6.11) 0.019

 Hypermethylation 49.4±7.1 76.5±7.9

H3K27me3

 Hypomethylation 122.4±6.6 10.27 (6.08–14.46) 0.001 145.4±3.2 4.74 (2.65–6.83) 0.011

 Hypermethylation 48.5±7.1 67.5±7.7

H3K36me1 0.878

 Hypomethylation 106.3±8.3 1.19 (0.54–1.84) 132.6±5.9 1.69 (0.67–2.71) 0.591

 Hypermethylation 99.7±7.7 126.7±8.0

H3K36me2

 Hypermethylation 100.9±9.0 1.05 (0.31–1.79) 0.915 132.4±6.6 1.03 (0.18–1.89) 0.977

 Hypomethylation 99.7±8.4 118.8±6.7

H3K36me3

 Hypomethylation 104.6±10.2 1.02 (0.22–1.82) 0.992 129.2±5.9 1.48 (0.66–2.29) 0.587

 Hypermethylation 98.2±7.2 127.5±7.2

CI, confidence interval; HR, hazard ratio; SE, standard error.

Table 4
Progression-free survival and overall survival according to H3K4 methyltransferase and H3K27 demethylase
Progression-free survival (mo) Overall survival (mo)


Mean±SE HR (95% CI) p-value Mean±SE HR (95% CI) p-value
LSD1

 Underexpression 115.1±9.4 1.87 (0.88–2.86) 0.321 145.6±9.2 1.21 (0.48–1.94) 0.682

 Overexpression 95.1±8.5 120.6±8.9

LSD2

 Underexpression 122.4±8.4 2.11 (0.96–3.26) 0.156 149.9±14.4 1.30 (0.48–2.21) 0.621

 Overexpression 90.3±7.6 118.3±11.9

JARID1A

 Underexpression 121.7±11.1 3.78 (1.64–5.92) 0.018 150.9±15.2 3.05 (1.84–4.26) 0.032

 Overexpression 72.9±6.2 98.2±11.1

JARID1B

 Underexpression 119.8±9.0 2.24 (0.99–3.68) 0.052 150.9±10.3 1.76 (0.70–2.82) 0.412

 Overexpression 82.3±7.1 105.4±9.4

JARID1C

 Underexpression 113.9±9.1 1.52 (0.63–2.41) 0.294 141.2±8.9 1.56 (0.72–2.39) 0.395

 Overexpression 92.5±7.2 120.9±8.1

JARID1D

 Underexpression 110.7±8.7 1.35 (0.51–2.19) 0.675 140.9±8.5 1.41 (0.67–2.15) 0.523

 Overexpression 98.3±8.4 123.8±7.4

EZH1

 Underexpression 121.8±7.6 2.26 (0.98–3.54) 0.051 141.2±10.9 1.44 (0.54–2.34) 0.641

 Overexpression 81.7±7.0 120.4±8.8

EZH2

 Underexpression 126.4±11.2 5.11 (3.64–6.58) 0.002 167.4±12.9 6.72 (3.88–9.56) 0.006

 Overexpression 68.1±6.9 74.3±9.2

CI, confidence interval; EZH, enhancer of zeste homolog; HR, hazard ratio; JARID, Jumonji AT-rich interactive domain; LSD, lysine-specific demethylase; SE, standard error.

Table 5
Multivariate analysis for predicting factors of progression-free survival and overall survival
Progression-free survival Overall survival


HR (95% CI) p-value HR (95% CI) p-value
H3K4me1 (hypermethylation vs. hypomethylation) 2.38 (0.96–3.78) 0.065 2.78 (1.21–4.35) 0.043

H3K4me3 (hypermethylation vs. hypomethylation) 3.76 (1.86–5.65) 0.020 2.68 (1.28–4.08) 0.046

H3K27me2 (hypomethylation vs. hypermethylation) 5.14 (3.42–6.86) 0.007 4.60 (3.02–6.18) 0.007

H3K27me3 (hypomethylation vs. hypermethylation) 4.73 (2.97–6.49) 0.009 6.31 (3.94–8.68) 0.005

LSD2 (underexpression vs. overexpression) 1.82 (0.92–2.72) 0.217 NA

JARID1A (underexpression vs. overexpression) 2.92 (1.61–4.23) 0.035 3.32 (1.57–5.07) 0.023

JARID1B (underexpression vs. overexpression) 2.40 (0.93–3.87) 0.061 NA

EZH1 (underexpression vs. overexpression) 2.07 (0.88–3.26) 0.101 NA

EZH2 (underexpression vs. overexpression) 4.42 (2.15–6.69) 0.014 5.08 (2.81–7.35) 0.006

CI, confidence interval; EZH, enhancer of zeste homolog; HR, hazard ratio; JARID, Jumonji AT-rich interactive domain; LSD, lysine-specific demethylase; NA, not available.

TOOLS
Similar articles