Abstract
Background
Methods
Results
REFERENCES
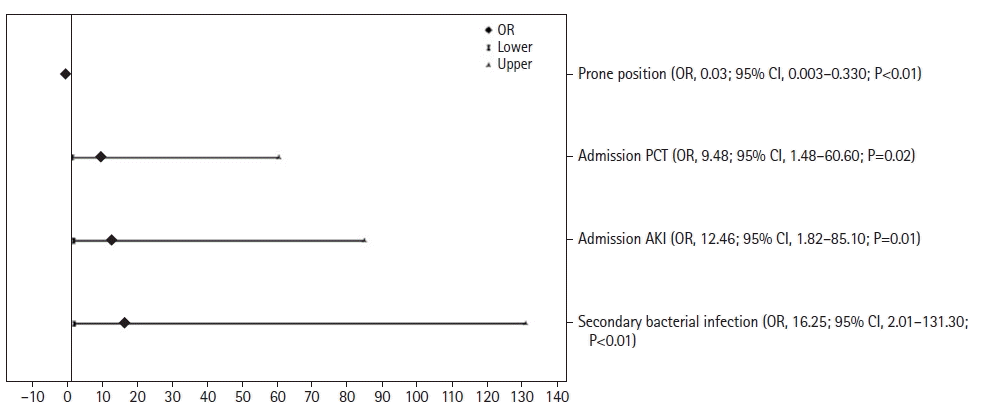
Figure 1.

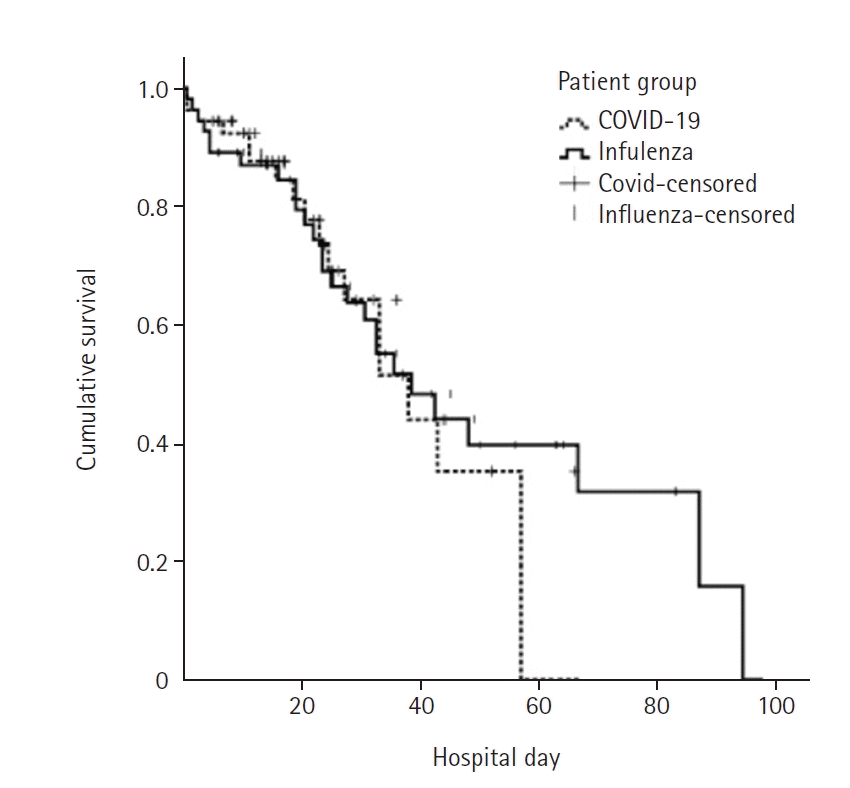
Figure 2.

Table 1.
| Variable | All (n=109) | COVID-19 (n=54) | Influenza (n=55) | P-value |
|---|---|---|---|---|
| Age (yr) | 64 (55–76) | 64 (58–76) | 62 (51–77) | 0.83 |
| Patients >65 yr | 50 (46) | 24 (44) | 26 (47) | 0.76 |
| Male sex | 63 (58) | 34 (63) | 29 (53) | 0.27 |
| Comorbidity | ||||
| Hypertension | 51 (47) | 25 (46) | 26 (47) | 0.91 |
| Diabetes mellitus | 32 (29) | 13 (24) | 19 (35) | 0.23 |
| Cardiac disease | 30 (28) | 9 (17) | 21 (38) | 0.01 |
| Malignancy | 24 (22) | 8 (15) | 16 (29) | 0.07 |
| Chronic lung disease | 21 (19) | 7 (13) | 14 (26) | 0.09 |
| Chronic kidney disease | 6 (6) | 0 | 6 (11) | 0.01 |
| Chronic liver disease | 5 (5) | 4 (7) | 1 (2) | 0.20 |
| Smoking | 37 (34) | 17 (32) | 20 (36) | 0.59 |
| ECOG status | 2 (1–3) | 1 (0–2) | 2 (1–3) | <0.01 |
| CFS | 4 (2–6) | 3 (1–5) | 5 (3–7) | <0.01b |
| APACHE II score | 16 (12–24) | 13 (10-18) | 19 (15–27) | <0.01 |
| SOFA score on admission | 4 (3–7) | 4 (3–6) | 6 (3–10) | 0.01 |
| Laboratory values on admission | ||||
| WBC (×103) | 8.1 (5.2–11) | 6.1 (4.1–9.3) | 9.9 (7.1–13.4) | <0.01 |
| Lymphocyte (×103) | 0.7 (0.5–1) | 0.8 (0.5–1.1) | 0.6 (0.4–0.9) | 0.19 |
| NLR | 9.6 (3.9–16.9) | 5.9 (2.6–12.5) | 13.4 (6–22.8) | <0.01 |
| Prothrombin time (INR) | 1.1 (1–1.2) | 1.1 (1–1.1) | 1.2 (1.1–1.4)a | <0.01 |
| Procalcitonin (ng/ml) | 0.2 (0.08–0.77) | 0.13 (0.07–0.2) | 1.9 (0.2–7.5) | <0.01 |
| pH (mm Hg) | 7.42 (7.36–7.46) | 7.44 (7.41–7.49) | 7.40 (7.33–7.44)c | <0.01 |
| PaCO2 (mm Hg) | 36 (31–46) | 33 (29–36) | 45 (35–57)c | <0.01 |
| PaO2/FiO2 on admission | 167 (124–234) | 160 (127–233) | 180 (102–250) | 0.24 |
| <100 | 20 (18) | 7 (13) | 13 (23) | 0.01 |
| 100–199 | 48 (44) | 25 (46) | 23 (42) | 0.92 |
| 200–300 | 32 (30) | 19 (35) | 13 (23) | 0.02 |
| >300 | 9 (8) | 3 (6) | 6 (11) | 0.06 |
| Thorax CT findings on admission | ||||
| Ground glass opacity | 71 (79) | 48 (92) | 23 (61) | <0.01 |
| Consolidation | 8 (9) | 2 (4) | 6 (16) | 0.06 |
| Infiltration | 2 (2) | 0 | 2 (5) | 0.17 |
| Septic shock on admission | 55 (51) | 20 (37) | 35 (64) | <0.01 |
| AKI on admission | 52 (48) | 16 (30) | 36 (66) | <0.01 |
| Mechanical Ventilation | ||||
| IMV | 59 (54) | 23 (43) | 36 (66) | 0.01 |
| NIMV | 66 (61) | 26 (48) | 40 (73) | 0.01 |
| Prone position | 31 (28) | 28 (52) | 3 (6) | <0.01 |
| RRT | 27 (25) | 7 (13) | 20 (36) | <0.01 |
| Primary viral infection | 78 (72) | 37 (69) | 41 (75) | 0.48 |
| Bacterial co-infection | 34 (31) | 13 (24) | 21 (38) | 0.11 |
| Secondary bacterial infection | 56 (51) | 22 (41) | 34 (62) | 0.02 |
| Opportunistic infection | 9 (8) | 5 (9) | 4 (7) | 0.50 |
| Outcomes | ||||
| Hospital mortality | 43 (39) | 17 (32) | 26 (47) | 0.09 |
| ICU LOS (day) | 12 (6–24) | 12 (5–18) | 12 (6–29) | 0.22 |
| Hospital LOS (day) | 20 (12–36) | 18 (11–29) | 24 (13–42) | 0.09 |
Values are presented as median (interquartile range) or number (%).
COVID-19: coronavirus disease 2019; ECOG: Eastern Cooperative Oncology Group; CFS: Clinical Frailty Scale; APACHE: Acute Physiology and Chronic Health Evaluation; SOFA: Sequential Organ Failure Assessment; WBC: white blood cell; NLR: neutrophil lymphocyte ratio; INR: international normalized ratio; PaO2/FiO2: the ratio of partial pressure arterial oxygen and fraction of inspired oxygen; CT: computerized tomography; AKI: acute kidney injury; IMV: invasive mechanical ventilation; NIMV: non-invasive mechanical ventilation; RRT: renal replacement therapy; ICU: intensive care unit; LOS: length of stay.
Table 2.
| Variable | Survivor (n=66) | Non-survivor (n=43) | P-value |
|---|---|---|---|
| Age (yr) | 60 (51–73) | 69 (60–79) | 0.01e |
| Patients >65 yr | 26 (39) | 24 (56) | 0.09 |
| Male sex | 34 (52) | 29 (67) | 0.10 |
| Comorbidity | |||
| Hypertension | 27 (41) | 24 (56) | 0.12 |
| Diabetes mellitus | 17 (29) | 15 (35) | 0.30 |
| Chronic lung disease | 15 (28) | 6 (14) | 0.25 |
| Cardiac disease | 13 (20) | 17 (40) | 0.02a |
| Malignancy | 9 (14) | 15 (35) | <0.01e |
| Chronic kidney disease | 2 (3) | 4 (9) | 0.21 |
| Chronic liver disease | 0 | 5 (12) | <0.01e |
| Smoking | 21 (32) | 16 (37) | 0.56 |
| ECOG status | 1 (0–2) | 2 (1–3) | 0.001e |
| CFS | 3 (2–6) | 5 (4–7) | <0.001e |
| APACHE II score | 14 (11–19) | 20 (15–31) | <0.001e |
| Admission SOFA score | 4 (2–5) | 7 (5–12) | <0.001e |
| Laboratory values on admission | |||
| WBC (×103) | 7.5 (5–10) | 10 (7–12) | 0.01e |
| Lymphocyte (×103) | 0.7 (0.5–1) | 0.6 (0.4–1) | 0.26 |
| NLR | 7.6 (3.7–13.5) | 13.5 (5–22.5) | 0.03 |
| Prothrombin time (INR) | 1.06 (1.05–1.16)a | 1.18 (1.13–1.59)c | <0.001e |
| Procalcitonin (ng/ml) | 0.14 (0.07–0.3)1b | 0.6 (0.1–4.7)d | <0.01e |
| pH (mm Hg) | 7.43 (7.39–7.47)a | 7.40 (7.29–7.45) | 0.01e |
| PaCO2 (mm Hg) | 36 (31–44)a | 35 (30–47) | 0.81 |
| PaO2/FiO2 on admission | 184 (132–257) | 154 (97–206) | 0.01e |
| Prone position | 20 (30) | 11 (26) | 0.60 |
| Septic shock on admission | 18 (27) | 37 (86) | <0.001e |
| AKI on admission | 19 (29) | 33 (77) | <0.001e |
| Mechanical Ventilation | |||
| IMV | 19 (29) | 40 (93) | <0.001e |
| NIMV | 39 (59) | 27 (63) | 0.70 |
| RRT | 6 (9) | 21 (49) | <0.001e |
| Primary viral infection | 50 (76) | 28 (65) | 0.23 |
| Bacterial co-infection | 18 (27) | 16 (37) | 0.27 |
| Secondary bacterial infection | 27 (41) | 29 (67) | <0.01e |
| Opportunistic infection | 3 (5) | 6 (14) | 0.08 |
| Patient group | 0.09 | ||
| COVID-19 | 37 (56) | 17 (40) | |
| Influenza | 29 (44) | 26 (60) | |
| Outcome | |||
| ICU LOS (day) | 11 (6–18) | 17 (5–32) | 0.23 |
| Hospital LOS (day) | 17 (11–34) | 24 (13–37) | 0.56 |
Values are presented as median (interquartile range) or number (%).
ECOG: Eastern Cooperative Oncology Group; CFS: Clinical Frailty Scale; APACHE: Acute Physiology and Chronic Health Evaluation; SOFA: Sequential Organ Failure Assessment; WBC: white blood cell; NLR: neutrophil lymphocyte ratio; INR: international normalized ratio; PaO2/FiO2: the ratio of partial pressure arterial oxygen and fraction of inspired oxygen; AKI: acute kidney injury; IMV: invasive mechanical ventilation; NIMV: non-invasive mechanical ventilation; RRT: renal replacement therapy; COVID-19: coronavirus disease 2019; ICU: intensive care unit; LOS: length of stay.
Table 3.
| Parameter | Odds ratio (95% CI) | P-value |
|---|---|---|
| IMV | 42.16 (9.45–187.97) | <0.001 |
| SOFA score on admission >4 | 5.92 (1.85–18.92) | 0.01 |
| Malignancy | 4.95 (1.13–21.60) | 0.03 |
| Age >65 yr | 3.31 (0.99–11.03) | 0.05 |
Adjusted for history of cardiac disease, Clinical Frailty Scale, Acute Physiology and Chronic Health Evaluation II score >16, presence of septic shock, secondary bacterial infection, neutrophil lymphocyte ratio ≥10 and patient group as coronavirus disease 2019 versus influenza.
Cl: confidence interval; IMV: invasive mechanical ventilation; SOFA: Sequential Organ Failure Assessment.


 PDF
PDF Citation
 Print
Print


 XML Download