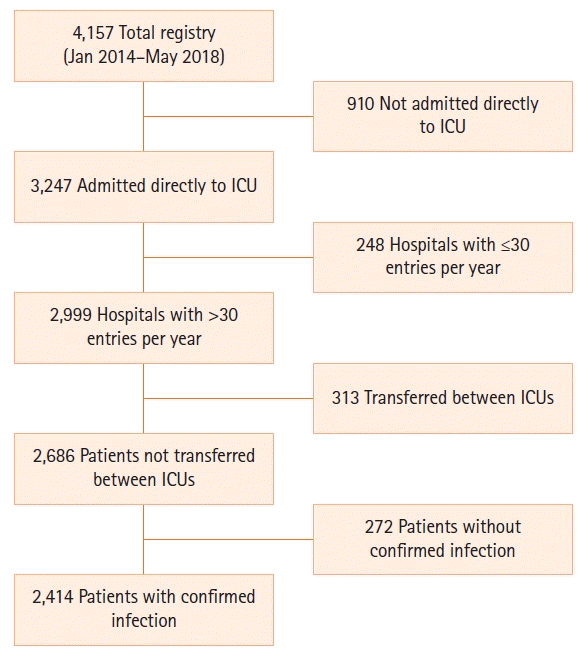
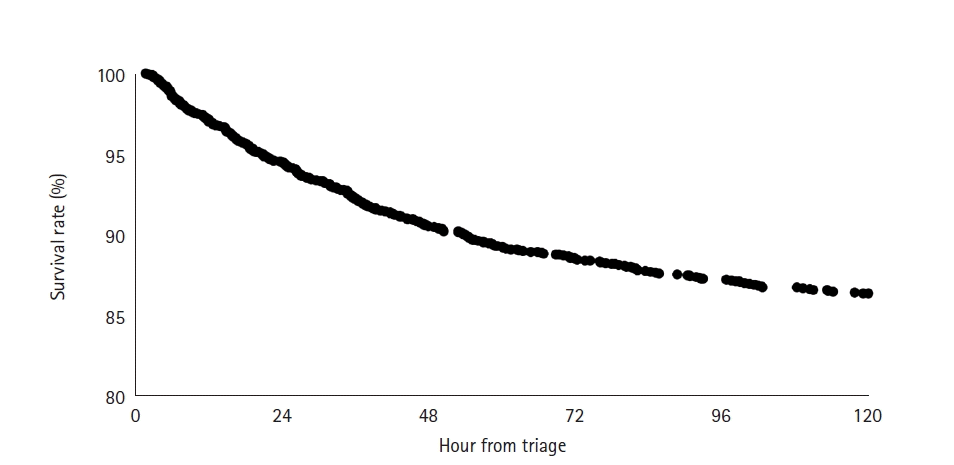
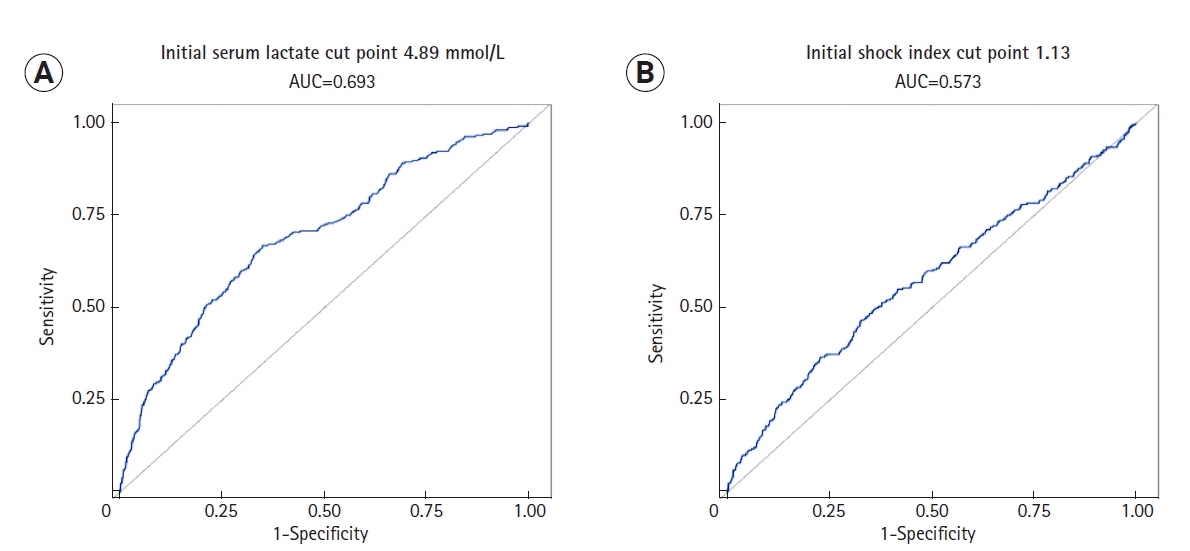
INTRODUCTION
MATERIALS AND METHODS
Variable Definitions
RESULTS
Table 1.
| Factor | Total (n=2,414) | Non–72-hr death (n=2,136) | 72-hr death (n=278) | P-value |
|---|---|---|---|---|
| Demographics | ||||
| Age (yr) | 66.1 (54.4–76.4) | 65.3 (53.6–75.4) | 71.4 (61.0–81.4) | <0.001a |
| BMI (kg/m2) | 26.5 (22.3–31.8) | 26.7 (22.5–32.0) | 25.1 (20.9–30.4) | <0.001a |
| Male | 1,241 (51.4) | 1,091 (51.1) | 150 (54.0) | 0.370b |
| Dementia | 481 (19.9) | 412 (19.3) | 69 (24.8) | 0.030b |
| Malignancy | 500 (20.7) | 413 (19.3) | 87 (31.3) | <0.001b |
| DNR status | 232 (9.6) | 193 (9.0) | 39 (14.0) | 0.008b |
| Race | 0.450b | |||
| American Indian or Alaska Native | 2 (0.1) | 1 (0.1) | 1 (0.4) | |
| Asian | 31 (1.3) | 28 (1.3) | 3 (1.1) | |
| Black or African American | 601 (24.9) | 535 (25.0) | 66 (23.7) | |
| White | 1,667 (69.1) | 1,470 (68.8) | 197 (70.9) | |
| Unknown | 113 (4.7) | 102 (4.8) | 11 (4.0) | |
| Ethnicity | 0.097b | |||
| Hispanic or Latino | 78 (3.2) | 73 (3.4) | 5 (1.8) | |
| Non-Hispanic or Latino | 2,262 (93.7) | 2,002 (93.7) | 260 (93.5) | |
| Unknown | 74 (3.1) | 61 (2.9) | 13 (4.7) | |
| Vital sign | ||||
| First SBP (mm Hg) | 104 (88–127) | 104 (89–128) | 98 (82–117) | <0.001a |
| Minimum SBP (mm Hg) | 71 (60–81) | 73 (62–82) | 54 (42–64) | <0.001a |
| Minimum SBP in the ED (mm Hg) | 81 (70–96) | 82 (71–97) | 74 (61–88) | <0.001a |
| First MAP (mm Hg) | 68 (58–85) | 69 (59–86) | 66 (54–79) | <0.001a |
| First heart rate | 107 (90–122) | 107 (90–121) | 109 (89–126) | 0.386a |
| First shock index | 1.0 (0.8–1.2) | 1.0 (0.8–1.2) | 1.1(0.9–1.4) | <0.001a |
| First oxygen saturation (%) | 96 (93–99) | 96 (93–99) | 96 (91–99) | 0.228a |
| Minimum oxygen saturation (%) | 85 (73–90) | 86 (76–90) | 72 (53–83) | <0.001a |
| Minimum oxygen saturation in the emergency department (%) | 93 (88–96) | 93 (89–96) | 90 (80–94) | <0.001a |
| First temperature (°C) | 37.0 (36.5–38.1) | 37.0 (36.6–38.2) | 36.6 (36.1–37.8) | <0.001a |
| Maximum temperature (°C) | 38.2 (37.4–39.2) | 38.3 (37.5–39.2) | 37.8 (36.9–39.0) | <0.001a |
| Maximum temperature in the ED (°C) | 37.4 (36.7–38.7) | 37.4 (36.7–38.7) | 37.1 (36.4–38.4) | <0.001a |
| Laboratory value | ||||
| Sodium (mEq/L) | 137 (133–140) | 137 (133–140) | 137 (133–141) | 0.453a |
| Glucose (mg/dl) | 132 (105–191) | 132 (105–190) | 131 (97–198) | 0.530a |
| Creatinine (mg/dl) | 1.5 (1.0–2.4) | 1.4 (1.0–2.3) | 2.0 (1.3–3.0) | <0.001a |
| Bilirubin (mg/dl) | 0.9 (0.6–1.5) | 0.9 (0.6–1.4) | 1.2 (0.7–2.2) | <0.001a |
| INR | 1.2 (1.1–1.6) | 1.2 (1.1–1.5) | 1.5 (1.2–2.1) | <0.001a |
| Albumin (g/dl) | 2.7 (2.2–3.2) | 2.8 (2.3–3.3) | 2.4 (1.9–2.9) | <0.001a |
| WBC count (x109/L) | 13.7 (9.0–19.9) | 13.7 (9.1–19.7) | 14.2 (8.2–21.9) | 0.682a |
| First lactate (mmol/L) | 4.3 (2.4–6.1) | 4.2 (2.3–5.7) | 6.1 (3.9–9.4) | <0.001a |
| Maximum lactate (mmol/L) | 4.6 (2.8–6.8) | 4.4 (2.6–6.2) | 7.9 (5.0–12.5) | <0.001a |
| Maximum lactate in the ED (mmol/L) | 4.5 (2.6–6.3) | 4.3 (2.4–5.9) | 6.4 (4.5–9.9) | <0.001a |
| Infection source | ||||
| Bacteremia | 3 (0.1) | 3 (0.1) | 0 | 0.990c |
| UTI | 673 (27.9) | 614 (28.7) | 59 (21.2) | 0.009b |
| Pneumonia | 716 (29.7) | 617 (28.9) | 99 (35.6) | 0.021b |
| Cellulitis | 178 (7.4) | 164 (7.7) | 14 (5.0) | 0.110b |
| Clostridium difficile colitis | 133 (5.5) | 124 (5.8) | 9 (3.2) | 0.078b |
| MRSA | 165 (6.8) | 140 (6.6) | 25 (9.0) | 0.130b |
| CRE | 82 (3.4) | 74 (3.5) | 8 (2.9) | 0.610b |
| Resuscitation variable | ||||
| Hour to receive antibiotics | 0.2 (0.0–0.5) | 0.2 (0.0–0.5) | 0.2 (0.0–0.6) | 0.001a |
| Volume in 3 hours (ml/kg) | 40.1 (29.7–56.0) | 40.0 (29.5–55.6) | 41.9 (31.2–58.4) | 0.109a |
| Fluid volume total in 3 hours (ml) | 3,021.5 (2,000.0–4,130.0) | 3,025.0 (2,000.5–4,150.0) | 3,000.0 (2,000.0–4100.0) | 0.606a |
| Volume in 6 hours (ml/kg) | 47.5 (33.4–68.0) | 47.2 (33.3–67.6) | 52.2 (36.0–72.2) | 0.040a |
| Fluid volume total in 6 hours (ml) | 3,650.0 (2,500.0–5,000.0) | 3,674.5 (2,500.0–5,000.0) | 3,590.5 (2,400.0–5,150.0) | 0.993a |
| Bundle compliance 3 hours | 1,482 (61.4) | 1,307 (61.2) | 175 (62.9) | 0.570b |
| Vasopressor use within 6 hours | 1,501 (62.2) | 1,274 (59.6) | 227 (81.7) | <0.001b |
| Intubation | 676 (28.0) | 521 (24.4) | 155 (55.8) | <0.001b |
| Need for renal replacement therapy | 140 (5.8) | 135 (6.3) | 5 (1.8) | 0.002b |
| Pulmonary edema within 72 hours | 73 (18.0) | 68 (19.0) | 5 (10.2) | 0.130b |
Values presented as number (%) or median (interquartile range) or number (%).
BMI: body mass index; SBP: systolic blood pressure; ED: emergency department; MAP: mean arterial pressure; DNR: do-not-resuscitate; INR: international normalized ratio; WBC: white blood cell; UTI: urinary tract infection ; MRSA: methicillin-resistant Staphylococcus aureus; CRE: carbapenem-resistant Enterobacteriaceae.


 PDF
PDF Citation
 Print
Print


 XML Download