Abstract
Background/Aims
Methods
Results
Conclusions
Notes
Funding
This work was supported by a development grant from the Department of Medicine at Emory University School of Medicine. This work was also supported by grant P30CA138292 from the Biostatistics and Bioinformatics Shared Resource of Winship Cancer Institute of Emory University and NIH/NCI. The content is solely the responsibility of the authors and does not necessarily represent the official views of the National Institutes of Health.
Acknowledgments
The authors wish to acknowledge Sarah Cristofaro and Dr. Ambreen Merchant for their invaluable assistance in study coordination.
Author Contributions
Conceptualization: AMG, ZC, SF, SK, NFS, BLR, QC, EFW; Data curation: TVPH, ZS; Formal analysis: TVPH, ZS, ZC, FFW; Supervision: FFW; Validation: TVPH, ZS, ZC, FFW; Visualization: TVPH, ZS; Writing-original draft: TVPH, ZS, AMG, FFW; Writing-review & editing: TVPH, ZS, ZC, VP, SC, SF, SK, NFS, BER, QC, FFW.
REFERENCES
Fig. 1.
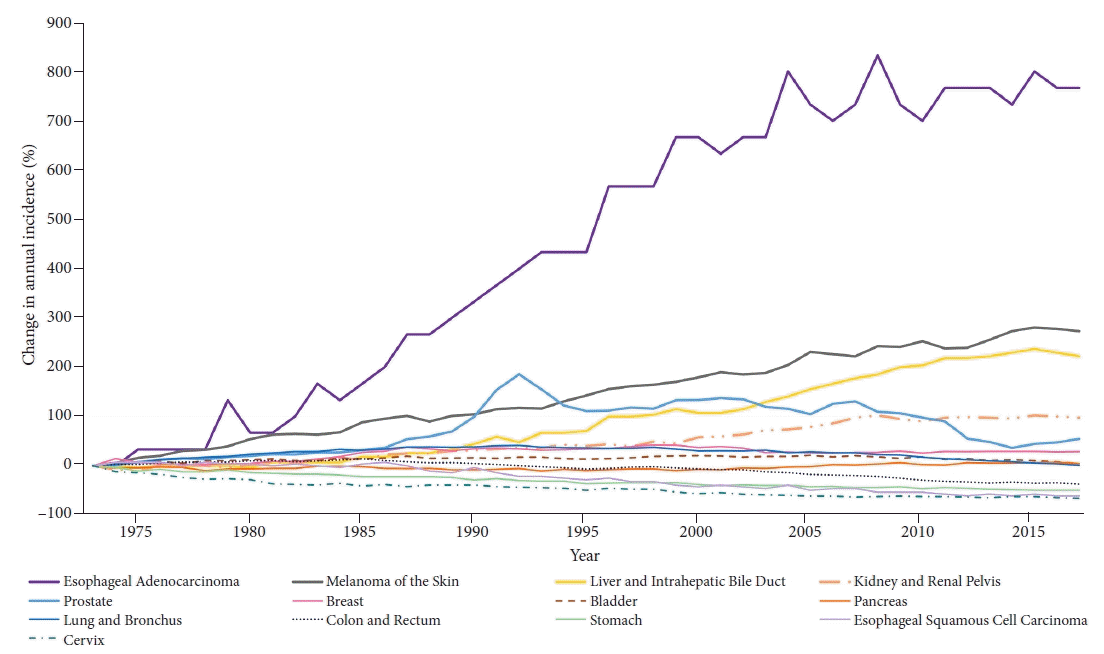
Fig. 2.
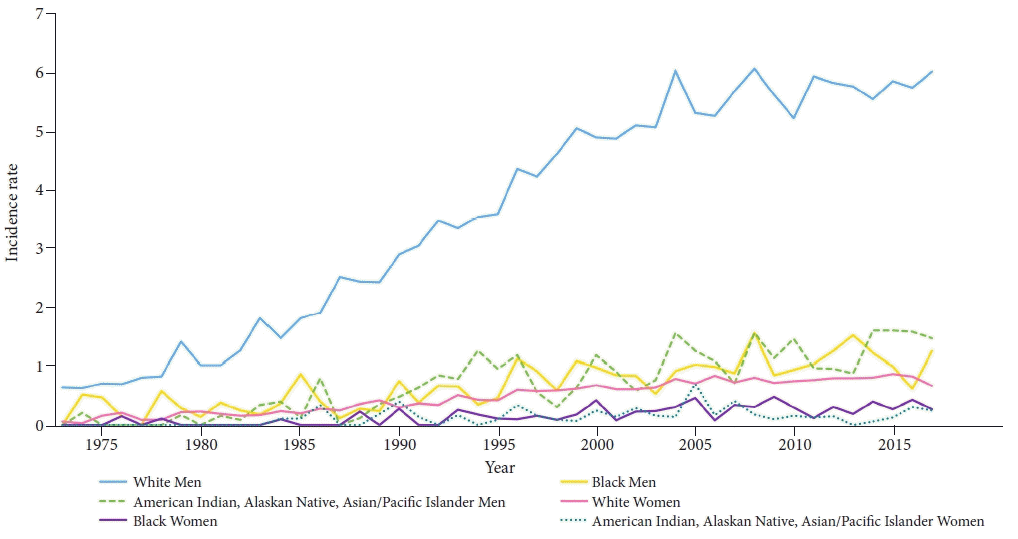
Fig. 3.
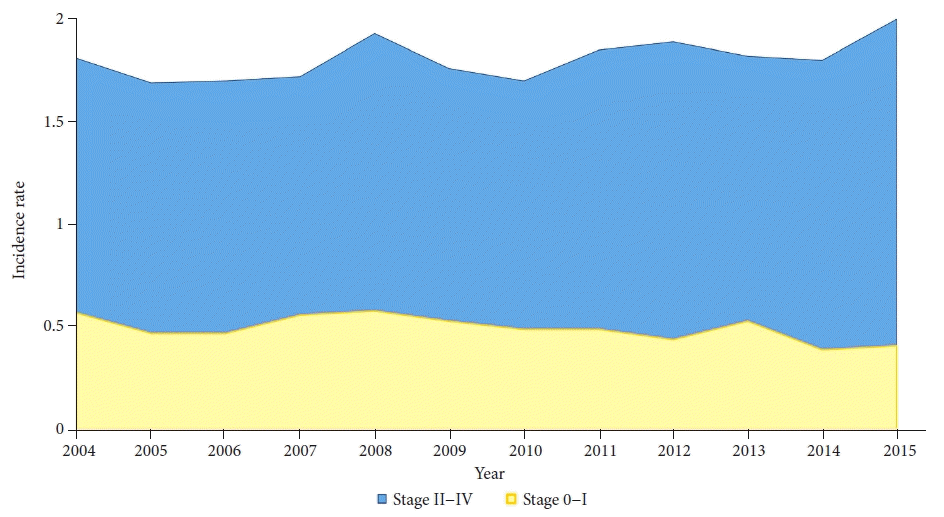
Fig. 4.
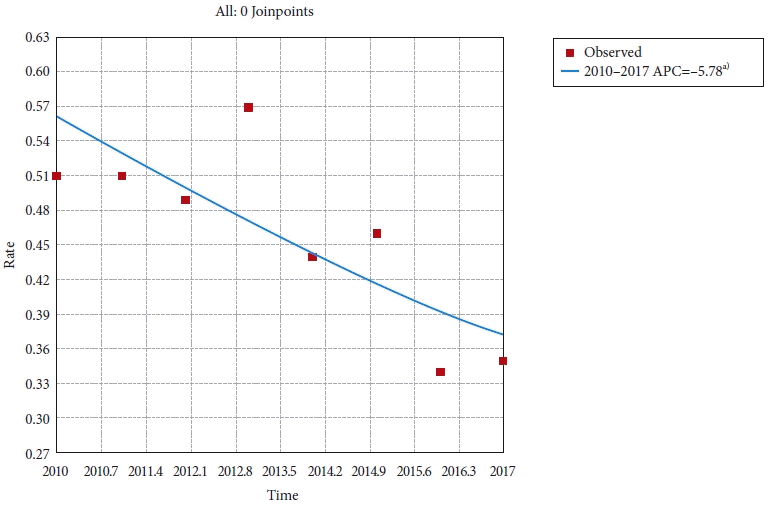
Fig. 5.
Table 1.
| Cancer location | AAPC (95% CI) |
Trend 1 |
Trend 2 |
Trend 3 |
Trend 4 |
Trend 5 |
Trend 6 |
||||||
|---|---|---|---|---|---|---|---|---|---|---|---|---|---|
| Year | APC (95% CI) | Year | APC (95% CI) | Year | APC (95% CI) | Year | APC (95% CI) | Year | APC (95% CI) | Year | APC (95% CI) | ||
| Esophagus (adenocarcinoma) | 5.11a) (4.66 to 5.56) | 1973–1992 | 9.16a) (8.47 to 9.84) | 1992–2004 | 4.15a) (3.05 to 5.25) | 2004–2017 | 0.32 (–0.33 to 0.97) | ||||||
| Melanoma of the skin | 3.07a) (2.75 to 3.39) | 1973–1981 | 6.03a) (4.40 to 7.70) | 1981–2005 | 2.90a) (2.69 to 3.10) | 2005–2017 | 1.49a) (1.12 to 1.86) | ||||||
| Liver & intrahepatic bile duct | 2.83a) (2.17 to 3.50) | 1973–1984 | 1.01 (–0.01 to 2.04) | 1984–1998 | 4.80a) (4.21 to 5.39) | 1998–2001 | 0.46 (–7.51 to 9.12) | 2001–2011 | 4.35a) (3.68 to 5.03) | 2011–2017 | 0.39 (–0.59 to 1.38) | ||
| Kidney & renal pelvis | 1.81a) (1.29 to 2.33) | 1973–1994 | 2.18a) (1.95 to 2.42) | 1994–1997 | –0.53 (–7.43 to 6.90) | 1997–2007 | 3.32a) (2.72 to 3.91) | 2007–2017 | 0.26 (–0.15 to 0.67) | ||||
| Prostate | 0.99 (–0.08 to 2.08) | 1973–1988 | 2.70a) (1.91 to 3.50) | 1988–1992 | 17.40a) (10.39 to 24.86) | 1992–1995 | –8.4 (–18.02 to 2.35) | 1995–2008 | 0.26 (–0.38 to 0.91) | 2008–2014 | –7.77a) (–10.01 to –5.48) | 2014–2017 | 3.63 (–2.00 to 9.59) |
| Breast | 0.43a) (0.03 to 0.83) | 1973–1980 | –0.53 (–1.59 to 0.54) | 1980–1987 | 3.96a) (2.77 to 5.17) | 1987–1994 | –0.31 (–1.31 to 0.71) | 1994–1999 | 1.57 (–0.19 to 3.36) | 1999–2004 | –2.40a) (–4.05 to –0.72) | 2004–2017 | 0.15 (–0.12 to 0.42) |
| Bladder | 0.07 (–0.08 to 0.22) | 1973–1981 | 1.16a) (0.48 to 1.85) | 1981–2007 | 0.23a) (0.14 to 0.33) | 2007–2017 | –1.20a)(–1.53 to –0.87) | ||||||
| Pancreas | 0.14 (–0.19 to 0.47) | 1973–1978 | –1.55a) (–2.92 to –0.16) | 1978–1984 | 1.17(–0.11 to 2.47) | 1984–1989 | –1.39 (–3.04 to 0.29) | 1989–2000 | –0.05 (0.45 to 0.35) | 2000–2008 | 1.56a) (0.95 to 2.18) | 2008–2017 | 0.24 (–0.13 to 0.61) |
| Lung & bronchus | 0 (–0.12 to 0.12) | 1973–1981 | 2.96a) (2.52 to 3.41) | 1981–1991 | 1.00a) (0.70 to 1.30) | 1991–2007 | –0.70a) (–0.82 to –0.57) | 2007–2017 | –2.19a) (–2.41 to –1.97) | ||||
| Colon & rectum | –1.08a) (–1.43 to –0.72) | 1973–1985 | 0.88a) (0.64 to 1.13) | 1985–1995 | –1.83a)(–2.16 to –1.51) | 1995–1998 | 1.48 (–2.04 to 5.13) | 1998–2008 | –2.30a) (–2.61 to –1.99) | 2008–2011 | –4.56a) (–7.98 to –1.01) | 2011–2017 | –1.12a) (–1.74 to –0.50) |
| Stomach | –1.52a) (–1.58 to –1.46) | 1973–2017 | –1.52a) (–1.58 to –1.46) | ||||||||||
| Esophagus (squamous cell carcinoma) | –2.13a) (–2.53 to –1.74) | 1973–1986 | –0.43 (–1.04 to 0.19) | 1986–2012 | –3.28a) (–3.52 to –3.05) | 2012–2017 | –0.51 (–3.53 to 2.60) | ||||||
| Cervix | –2.19a) (–2.54 to –1.83) | 1973–1982 | –4.75a) (–5.60 to –3.90) | 1982–1990 | –0.17 (–1.46 to 1.13) | 1990–2006 | –2.79a) (–3.20 to –2.38) | 2006–2017 | –0.62 (–1.32 to 0.09) | ||||


 PDF
PDF Citation
 Print
Print


 XML Download