Abstract
Background/Aims:
Methods:
Results:
Conclusions:
Notes
Funding
This study was supported by the National Research Foundation (NRF) of Korea, funded by the Ministry of Education (NRF2016R1D1A1B02008937).
Author Contributions
Conceptualization: Sun-Young Lee
Data curation: Young Jung Kim, SYL, Jeong Hwan Kim, In-Kyung Sung, and Hyung Seok Park
Formal analysis: YJK, SYL
Funding acquisition: SYL
Investigation: YJK, SYL, JHK, IKS, HSP
Methodology: TJK, SYL, JHK, IKS, HSP
Project administration: SYL
Resources: YJK, SYL, JHK, IKS, HSP
Software: SYL
Supervision: SYL
Validation: YJK, SYL, JHK, IKS, HSP
Visualization: YJK, SYL, JHK, IKH, HSP
Writing-original draft: YJK
Writing-review&editing: SYL
REFERENCES
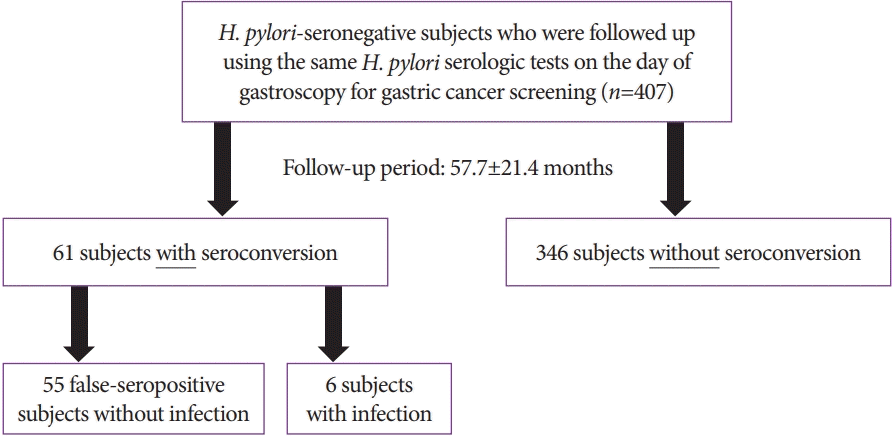
Fig. 1.

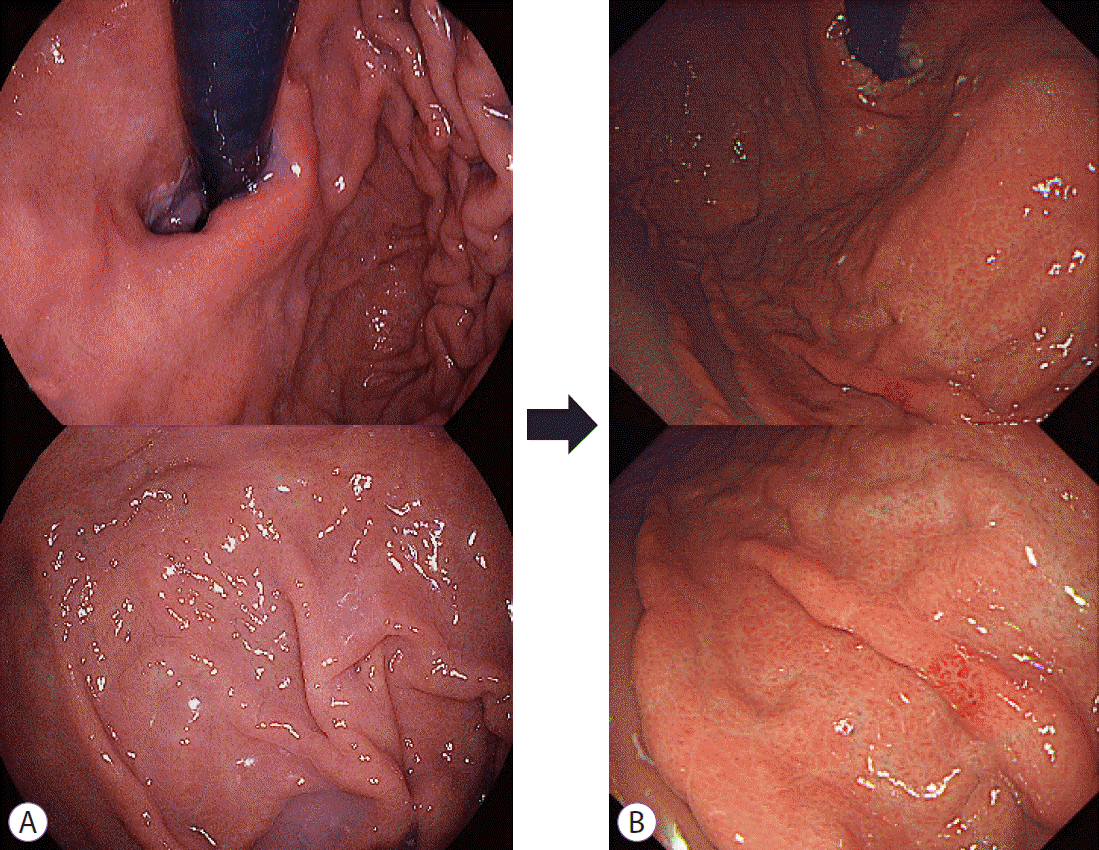
Fig. 2.

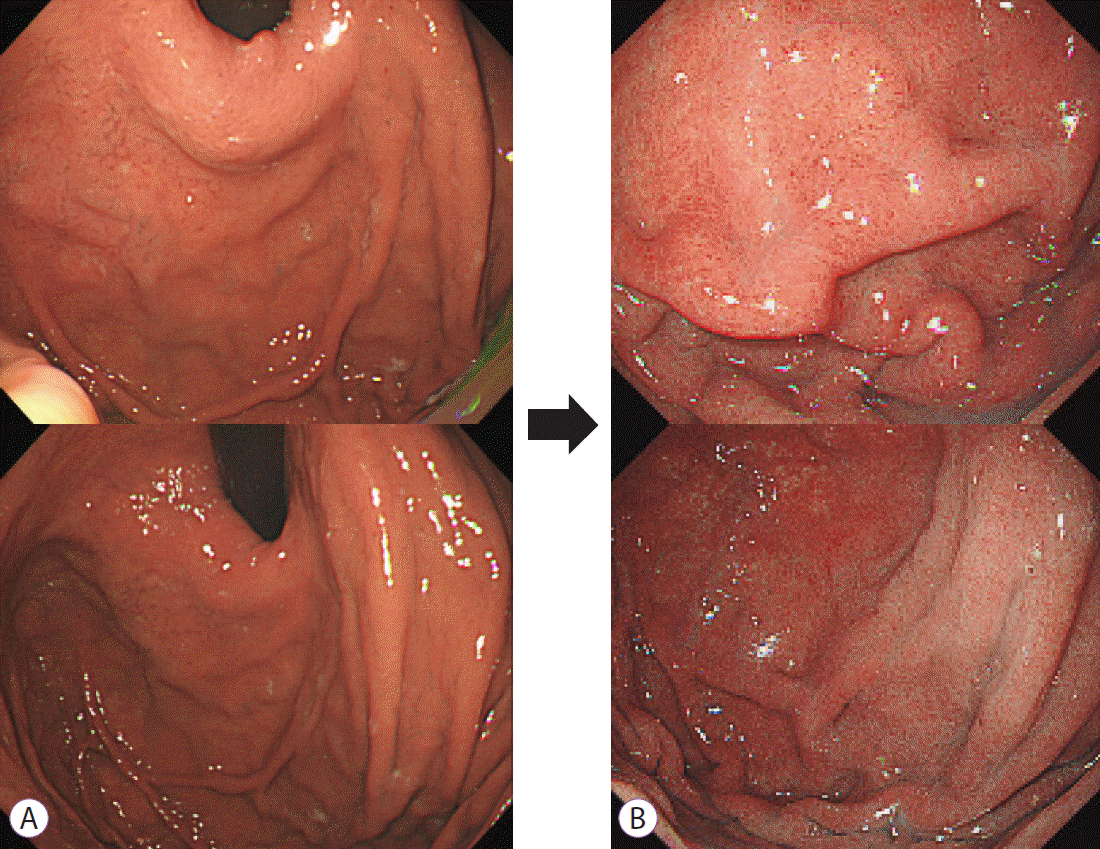
Fig. 3.

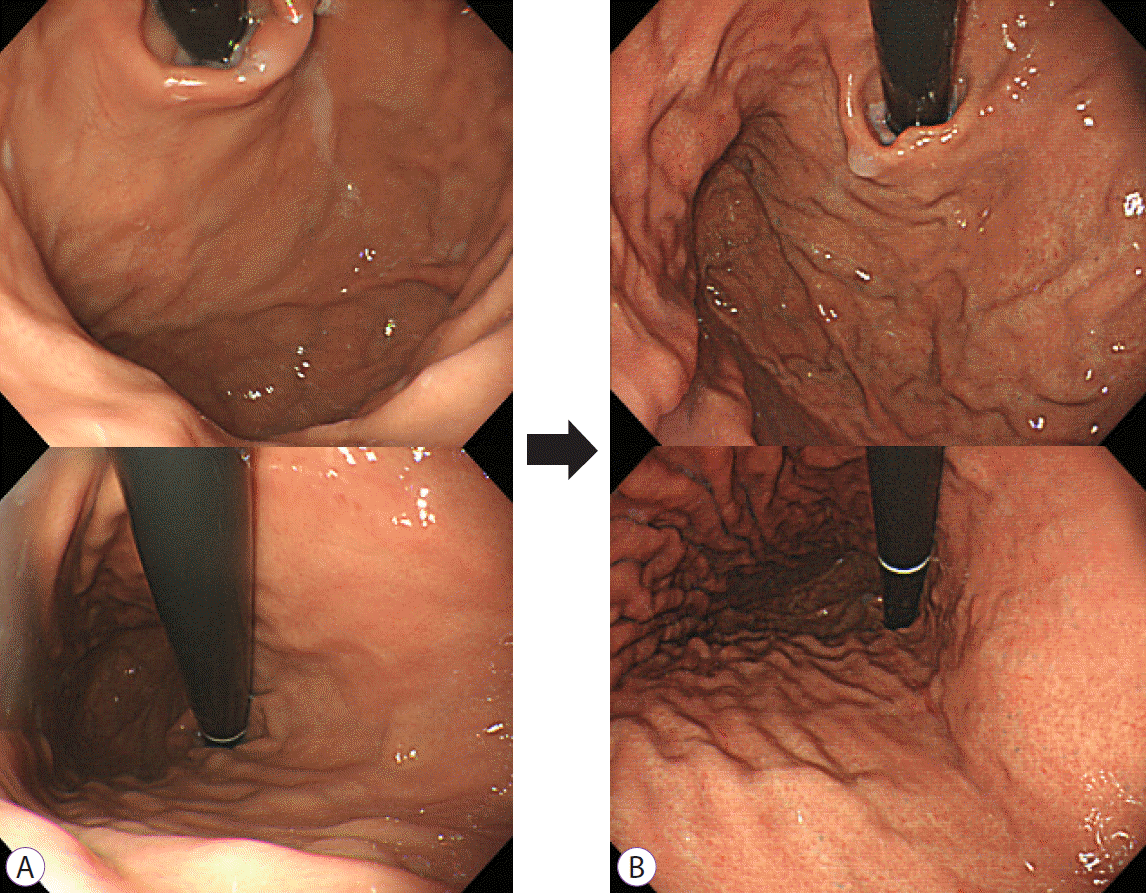
Fig. 4.

Table 1.
| Variables | All subjects (n=407) |
Follow-up serology test findings |
|||
|---|---|---|---|---|---|
| Without seroconversion (n=346) | With seroconversion (n=61) | p-value | |||
| Age (years) | 50.9±10.0 | 50.7±10.0 | 52.2±9.8 | 0.279 | |
| Sex (male) | 253 (62.1%) | 211 (61.0%) | 42 (68.9%) | 0.243 | |
| Body mass index (kg/m2) | 24.3±3.1 | 24.3±3.2 | 24.8±2.9 | 0.255 | |
| Past H. pylori infection | 155 (38.1%) | 127 (36.7%) | 28 (45.9%) | 0.173 | |
| H. pylori eradication history | 127 (31.2%) | 102 (29.5%) | 25 (41.0%) | 0.074 | |
| Unintended eradicationa | 28 (6.9%) | 25 (7.2%) | 3 (4.9%) | 0.783 | |
| Comorbidities | |||||
| Diabetes mellitus | 50 (12.3%) | 41 (11.8%) | 9 (14.8%) | 0.542 | |
| Hypertension | 113 (27.8%) | 93 (26.9%) | 20 (32.8%) | 0.342 | |
| Coronary heart disease | 25 (6.1%) | 18 (5.2%) | 7 (11.5%) | 0.078 | |
| Recent drug intake | |||||
| Nonsteroidal anti-inflammatory drug | 32 (7.9%) | 26 (7.5%) | 6 (9.8%) | 0.604 | |
| Antithrombotic agents including aspirin | 49 (12.0%) | 42 (12.1%) | 7 (11.5 %) | 0.883 | |
| Acid suppressants | 5 (1.2%) | 4 (1.2%) | 1 (1.6%) | 0.558 | |
| Initial test findings | |||||
| Serum anti-H. pylori IgG (AU/mL) | 5.9±1.4 | 5.7±1.3 | 6.7±1.6 | < 0.001 | |
| Serum pepsinogen I (ng/ml) | 52.6±21.7 | 51.8±20.1 | 56.9±28.8 | 0.092 | |
| Serum pepsinogen II (ng/ml) | 9.8±4.3 | 9.5±4.0 | 10.4±5.4 | 0.139 | |
| Serum pepsinogen I/II ratio | 5.6±1.4 | 5.6±1.4 | 5.7±1.5 | 0.934 | |
| Total follow-up period (months) | 57.7±21.4 | 55.8±20.4 | 68.6±23.8 | < 0.001 | |
| Follow-up test findings | |||||
| Serum anti-H. pylori IgG (AU/mL) | 6.1 (5 - 200) | 5.6 (5 - 11.9) | 22.7 (12.1 - 200) | < 0.001 | |
| Serum pepsinogen I (ng/ml) | 55.7±25.1 | 54.5±23.1 | 62.5±31.5 | 0.022 | |
| Serum pepsinogen II (ng/ml) | 8.4 (3 - 36.6) | 8.3 (3 - 36.6) | 9.6 (3.8 - 35.6) | 0.001 | |
| Serum pepsinogen I/II ratio | 6.3±2.0 | 6.4±2.1 | 6.0±1.7 | 0.197 | |
H. pylori, Helicobacter pylori; IgG, immunoglobulin G.
Continuous variables are presented as mean±standard deviation using the t-test, and categorical variables are presented as number of the subjects with proportion (%) using the Chi-square test. For continuous variables with asymmetrical distribution, data are presented as median with ranges using the Kruskal-wallis test. For categorical variables with asymmetrical distribution, Fisher’s exact test was used.
Table 2.
| Initial infection status | Sex / age | Comorbidity |
Serology (AU/mL) |
PG I (ng/ml) |
PG II (ng/ml) |
PG I/II ratio |
Kyoto classification score for gastritisa |
|||||
|---|---|---|---|---|---|---|---|---|---|---|---|---|
| Initial | F/U | Initial | F/U | Initial | F/U | Initial | F/U | Initial | F/U | |||
| H. pylori-naïve | M/55 | DM, HTN | 6.4 | 21.7 | 69.5 | 85.1 | 18.9 | 22.5 | 3.7 | 3.8 | 0 (A0 IM0 H0 N0 DR0) | 2 (A0 IM0 H0 N0 DR2) |
| Previous eradication history | M/54 | HTN | 9.4 | 161.5 | 46.4 | 97.2 | 10.3 | 29.8 | 4.5 | 3.3 | 3 (A1 IM2 H0 N0 DR0) | 5 (A1 IM2 H0 N0 DR2) |
| F/67 | HTN, osteoporosis | 6.5 | > 200 | 45.2 | 116.0 | 10.5 | 35.6 | 4.3 | 3.3 | 1 (A0 IM1 H0 N0 DR0) | 2 (A0 IM1 H0 N0 DR1) | |
| F/66 | DM, HTN, CVA | 9.3 | 19.2 | 39.2 | 42.7 | 8.1 | 7.6 | 4.9 | 5.6 | 2 (A1 IM1 H0 N0 DR0) | 3 (A1 IM1 H0 N0 DR1) | |
| M/49 | None | 5.8 | 107.2 | 33.7 | 66.1 | 6.3 | 27.8 | 5.3 | 2.4 | 1 (A0 IM1 H0 N0 DR0) | 4 (A2 IM1 H0 N0 DR1) | |
| Unintended eradicationb | M/53 | None | < 5 | 158.1 | 58.5 | 54.3 | 12.2 | 13.6 | 4.8 | 4.0 | 1 (A0 IM1 H0 N0 DR0) | 2 (A0 IM1 H0 N0 DR1) |
CVA, cerebrovascular disease; DM, diabetes mellitus; F, female; F/U, follow-up; H. pylori, Helicobacter pylori; HTN, hypertension; M, male; PG, pepsinogen.
a Chronic atrophic gastritis was scored as A0 (none or closed-type 1), A1 (closed-type 2 or 3), and A2 (open-type). Metaplastic gastritis was scored as IM0 (none), IM1 (limited), and IM2 (extensive). Hypertrophic rugae were scored as H0 (absent) and H1 (present). Nodular gastritis was scored as N0 (absent) and N1 (present). Diffuse redness was scored as DR0 (none), DR1 (mild), and DR2 (severe).
Table 3.
| Findings |
False-seropositive subjects without infection (n=55) |
Seropositive subjects with H. pylori infection (n=6) |
p-valueb | ||||
|---|---|---|---|---|---|---|---|
| Initial | Follow-up | p-valuea | Initial | Follow-up | p-valuea | ||
| Serum anti-H. pylori IgG (AU/mL) | 6.4 (5–9.9) | 22.0 (12.1–59.3) | < 0.001 | 6.5 (5–9.4) | 132.7 (19.2–200) | 0.021 | < 0.001 |
| Serum pepsinogen I (ng/ml) | 57.8±30.0 | 60.9±31.9 | 0.383 | 48.8±13.1 | 76.9±27.6 | 0.062 | 0.547 |
| Serum pepsinogen II (ng/ml) | 10.3±5.5 | 10.4±5.3 | 0.991 | 11.1±4.4 | 22.8±10.5 | 0.054 | < 0.001 |
| Serum pepsinogen I/II ratio | 5.8±1.5 | 6.2±1.6 | 0.076 | 4.6±0.6 | 3.7±1.1 | 0.153 | 0.002 |
| Total Kyoto classification score | 0.13 (0–2) | 0.30 (0–2) | 0.006 | 1.25 (0–3) | 2.75 (2–5) | 0.004 | < 0.001 |
| Chronic atrophic gastritis score | 0.04 (0–2) | 0.04 (0–2) | NA | 0.33 (0–1) | 0.60 (0–2) | 0.363 | 0.001 |
| Metaplastic gastritis score | 0.11 (0–2) | 0.27 (0–2) | 0.006 | 1.00 (0–2) | 1.00 (0–2) | NA | 0.017 |
| Diffuse redness score | 0 | 0 | NA | 0 | 1.33 (1–2) | 0.001 | < 0.001 |
| Interval till seropositivity (months) | - | 36.8±16.1 | - | - | 47.8±17.9 | - | 0.302 |
H. pylori, Helicobacter pylori; IgG, immunoglobulin G; NA, not available due to the absence of changes between the initial and follow-up test findings.
Continuous variables are presented as mean±standard deviation using the t-test, and those with asymmetrical distribution are presented as median with ranges using the Kruskal-wallis test.


 PDF
PDF Citation
 Print
Print


 XML Download