

 PDF
PDF Citation
 Print
Print


Introduction
Salivary gland cancers (SGCs) are rare carcinomas that occur in approximately 3 cases per 100000 people a year and account for less than 3% of all head and neck cancers. It is a highly heterogeneous disease involving about 22 different histologic types of carcinomas. Approximately 70% of SGCs occur in the parotid gland, but they also may occur in other major and minor salivary glands, and the clinical course and prognosis of the disease may vary depending on primary subsites or histologic grade [1]. Histologic grade, advanced T classification, lymph nodes (LNs) metastasis, lymphovascular invasion (LVI), perineural invasion (PNI), and etc. have been known to be prognostic factors of SGCs [2-4]. However, current TNM stating system only reflects the extent of primary tumor (T), nodal factors (N), and distant metastasis (M) and does not reflect any other significant factors. Due to its simplicity of current TNM staging system, some SGCs patients showed unmatched treatment outcomes to their staging. As an inaccurate staging may pose patients at risk of insufficient treatment or overtreatment, a robust and accurate prediction model should be established.
The log-rank test and the Cox proportional hazard (CPH) model are used to analyze survival data of cancer patients to analyze prognostic factors that have a significant effect on survival. However, since these models assume a linear combination between variables, it is not fit enough to analyze the survival data of cancer patients and has the disadvantage of being difficult to apply especially when multiple variables are correlated with each other. Also, survival data of cancer patients are not binary structure but have the characteristics of censored data and ‘time to event.’ When analyzing the high dimensional data of cancer patients, we should consider these unique characteristics. The state-of-art machine learning technique which is more suitable to non-linear model of variables can overcome limitations of traditional statistical methods mentioned above and it has exhibited superior performance to the existing model in a previous study mainly conducted on oral cancer patients [5,6]. To our knowledge, no studies related to machine learning or deep learning model have been conducted to predict the survival of SGCs patients. In this study, we have analyzed the survival data of SGCs patients and tried to construct machine learning and deep learning models for predicting SGCs patient’s survival.
Subjects and Methods
Study participants
From January 2006 to December 2018, data of patients diagnosed with SGCs and treated at Severance Hospital were retrospectively analyzed. The inclusion criteria are as follows: 1) primary malignant tumor in major or minor salivary gland and 2) diagnosed with and underwent surgery for SGCs with sufficient clinical and pathological information was available through medical records. Exclusion criteria are as follows: 1) distant metastasis at time of diagnosis, 2) surgery or radiotherapy previously performed in the head and neck area, and 3) loss during follow-up after surgery was excluded from the study. Finally, a total of 460 patients was included in the study consisting of 240 males and 220 females. The ages ranged from 14 to 99 years with a mean of 53.7 years. Tumor stage was classified based on the 8th American Joint Committee on Cancer (AJCC) staging system. This study was approved by the Institutional Review Board (IRB) of Yonsei University (3-2020-0504). Need for individual informed consent was waived as this study had a retrospective design.
Machine learning model
Of the data set, 80% were classified as training data and used for learning, while the remaining 20% were used as test data to validate the performance of machine learning model. Survival data of cancer patients cannot be predicted by binary classification and ‘time to event’ and censored data should be considered for predicting survival. Several metrics such as accuracy, precision, recall, and area under receiver operating curve (AUC) which are commonly used to estimate the performance of binary classification are not suitable in cancer survival analysis. Therefore, Harrell’s c-index was used to analyze the performance of a survival prediction model for SGC patients [7]. The Harrell’s c-index is the most widely used index to evaluate the predictive accuracy of survival time considering death in a survival analysis model. It is a representative method for evaluating the performance of the survival prediction model and Harrell’s c-index uses a statistical method that indicates whether the predicted death time of a patient through the model is sequentially matched with the real death time of the actual patients. When the c-index value is 0.5, it corresponds to the average value of the random model and c-index value of 1 refers to a perfect match of death time ranking. C-index value over 0.8 usually indicates the strong predictive model [7,8].
We choose the following three representative models for predicting patient’s survival. The Random Survival Forest, CPH, and deep learning-based survival model (DeepSurv) were used to construct machine learning survival prediction model for SGCs patients [8-10]. The linear model CPH, the nonlinear model RFS, and the deep learning model Deepsurv were used to predict the survival of SGC patients, and to determine which model can show the best performance in predicting the survival of these patients. As Random Survival Forest uses all variables for constructing a model and assesses nonlinear effects of them, it can reduce variance and bias. To construct the Random Survival Forest models, the 0.14.0 version of scikit survival was used. The DeepSurv model devised by Katzman, et al. [8] is an open-source python module and updates weights through a feed forward network and back propagation process through a multi-layer neural network structure and presents a negative log partial likelihood. CPH model was constructed by using R program with moonBook package.
Statistical analysis
Patient demographic information, tumor location and stage, pathologic findings, recurrence, date of recurrence, recurrence site, death, date of death, and cause of death were collected and analyzed. Chi-square or Fisher’s exact test was used to evaluate differences in categorical variables between the two independent groups. An independent two-sample t-test was used to assess differences in continuous variables between the two independent groups. The Kaplan-Meier curve was used to analyze patient survival, and outcomes were assessed using a log-rank test. A p-value <0.05 was considered to indicate statistical significance. Statistical analyses were performed using R version 4.03.
Results
Clinical information of patients
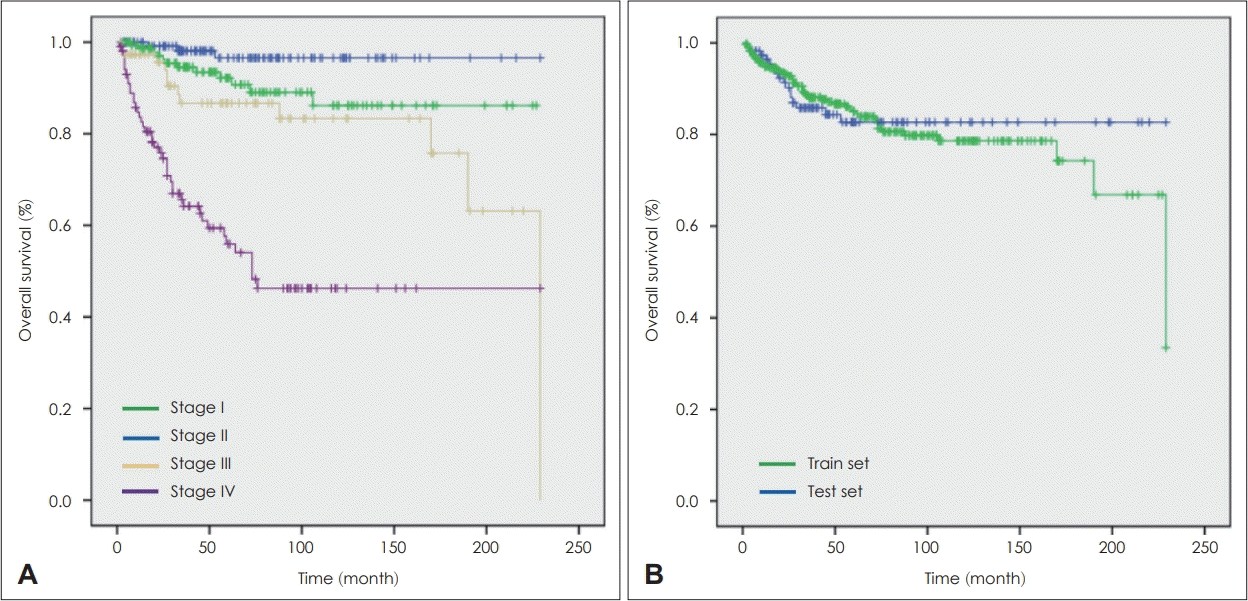
A total of 460 patients was included in this study, and all patients underwent surgery as an initial treatment. After surgical treatment, 184 patients (40%) received postoperative radiotherapy, and 70 patients (15.2%) underwent concurrent chemoradiation. The primary site of cancer was the parotid gland in 388 patients (84.3%), submandibular gland in 46 patients (10.0%), sublingual gland in 20 patients (4.3%), and minor salivary gland in 6 patients (1.3%). There were 34 cases (7.4%) with facial nerve (FN) palsy before surgery. On pathologic examination of surgical specimens, 146 patients (31.7%) showed positive surgical margins, and 314 patients (68.3%) showed negative margins. LVI findings were observed in 74 patients (16.1%), PNI findings in 117 patients (25.4%), and extranodal extension (ENE) findings in 70 patients (15.2%). In pT classification, T1 was 145 (31.5%), T2 was 195 (42.4%), T3 was 70 (15.2%), and T4 was 50 (10.9%). In pN classification, N0 was 354 (77.0%), N1 was 28 (6.1%), N2 was 72 (15.7%), and N3 was 6 (1.3%). On the TNM staging system, stage I was 129 (28.0%), stage II was 153 (33.3%), stage III was 75 (16.3%), and stage IV was 103 (22.4%). On survival analysis using Kaplan-Meier curve, significant differences were observed between stage IV and other stages, but there was no significant difference between stages II and III (Fig. 1A). Other information of all patients is summarized in Table 1. In addition, baseline differences between the training and test data sets were analyzed and summarized in Table 1, and the overall survival difference between the two groups was analyzed through Kaplan-Meier survival analysis with the log-rank test (Fig. 1B). There were no significant differences between training and test data set.
Clinical prognostic factors
The clinical prognostic factors used were: patient’s age, sex, primary site, FN palsy, adjuvant treatment, margin status, LVI, PNI, ENE, pT, pN, number of metastatic LNs, lymph node ratio (LNR), histology subtype. In the case of a linear model, multicollinearity may be a problem, so the GridSearchCV method was used to select the type of variable to be used in the CPH model. For nonlinear models, RFS and Deepsurv models, all variables were used to build the model without special variable selection because multicollinearity was not an issue.
CPH model
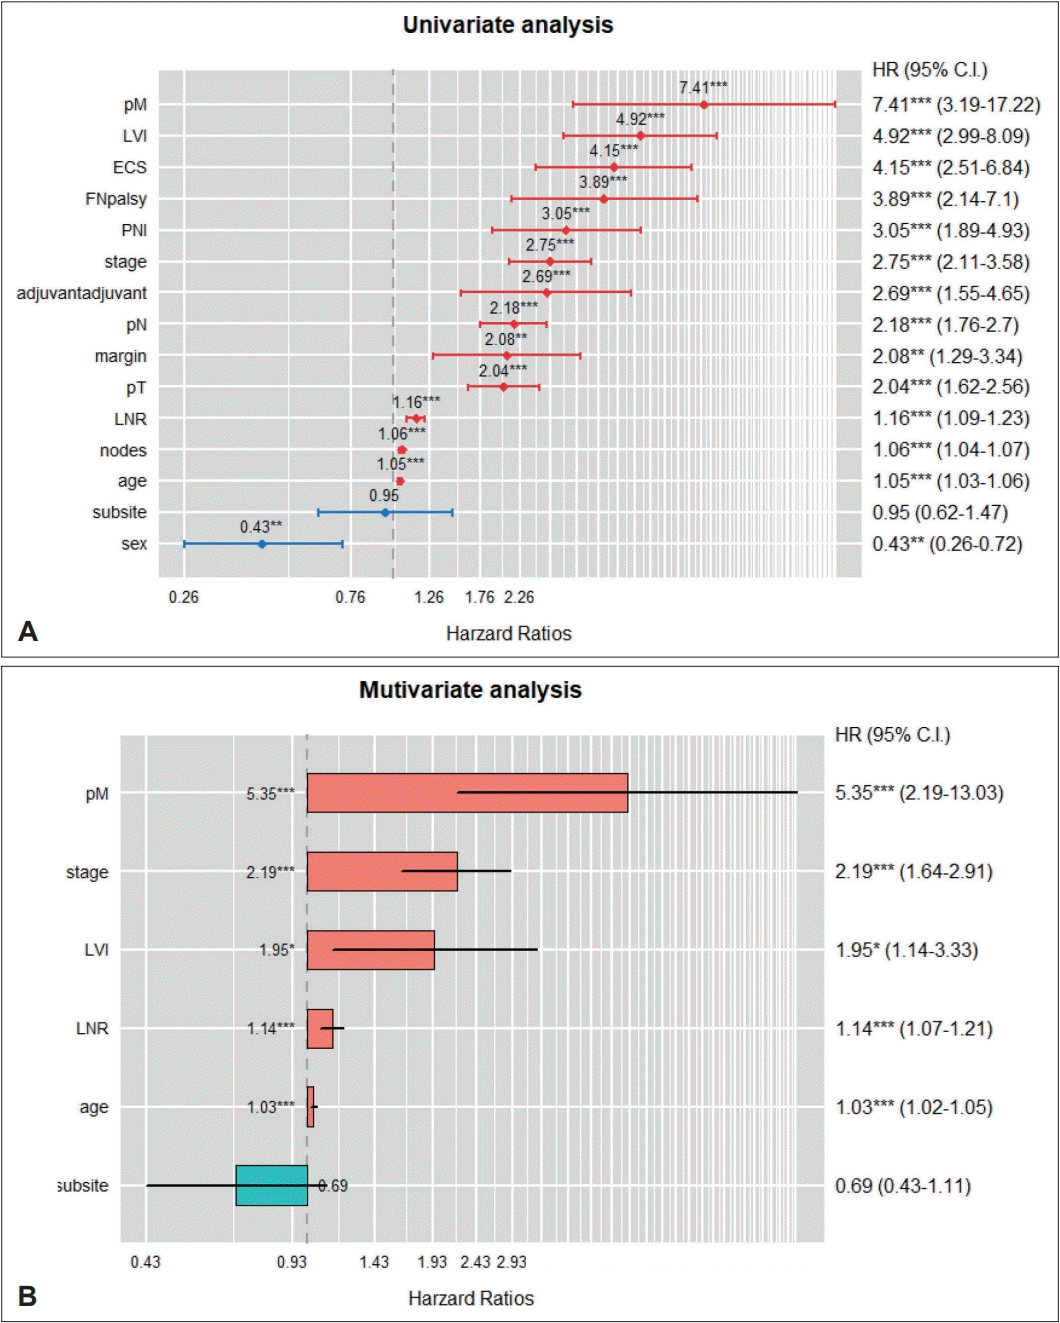
CPH model has been constructed using R program with moonBook package. Firstly, univariate analysis was performed to evaluate prognostic factors for survival in SGCs patients. pM, LVI, ENE, FN palsy, PNI, stage, adjuvant therapy, pN, surgical margin, pT, LNR, number of metastatic LNs, age, subsite, and sex showed significant correlations with SGCs patient’s survival. On multivariate analysis, pM, stage, LVI, LNR, and age exhibited significant correlation with patient’s survival (Fig. 2). In the CPH model, when the model was built using all the parameters mentioned above, the c-index value was 0.85 for the training set and 0.81 for the test set. After tuning parameter values through the GridSearchCV function, optimal performance was achieved when 8 parameters including age, LVI, PNI, ENE, pT, pN, stage, and number of metastatic LNs were input into the model. When the CPH model was built based on these 8 parameters, the c-index value was 0.85 for the training set and 0.80 for the test set.
Random Forest Survival model
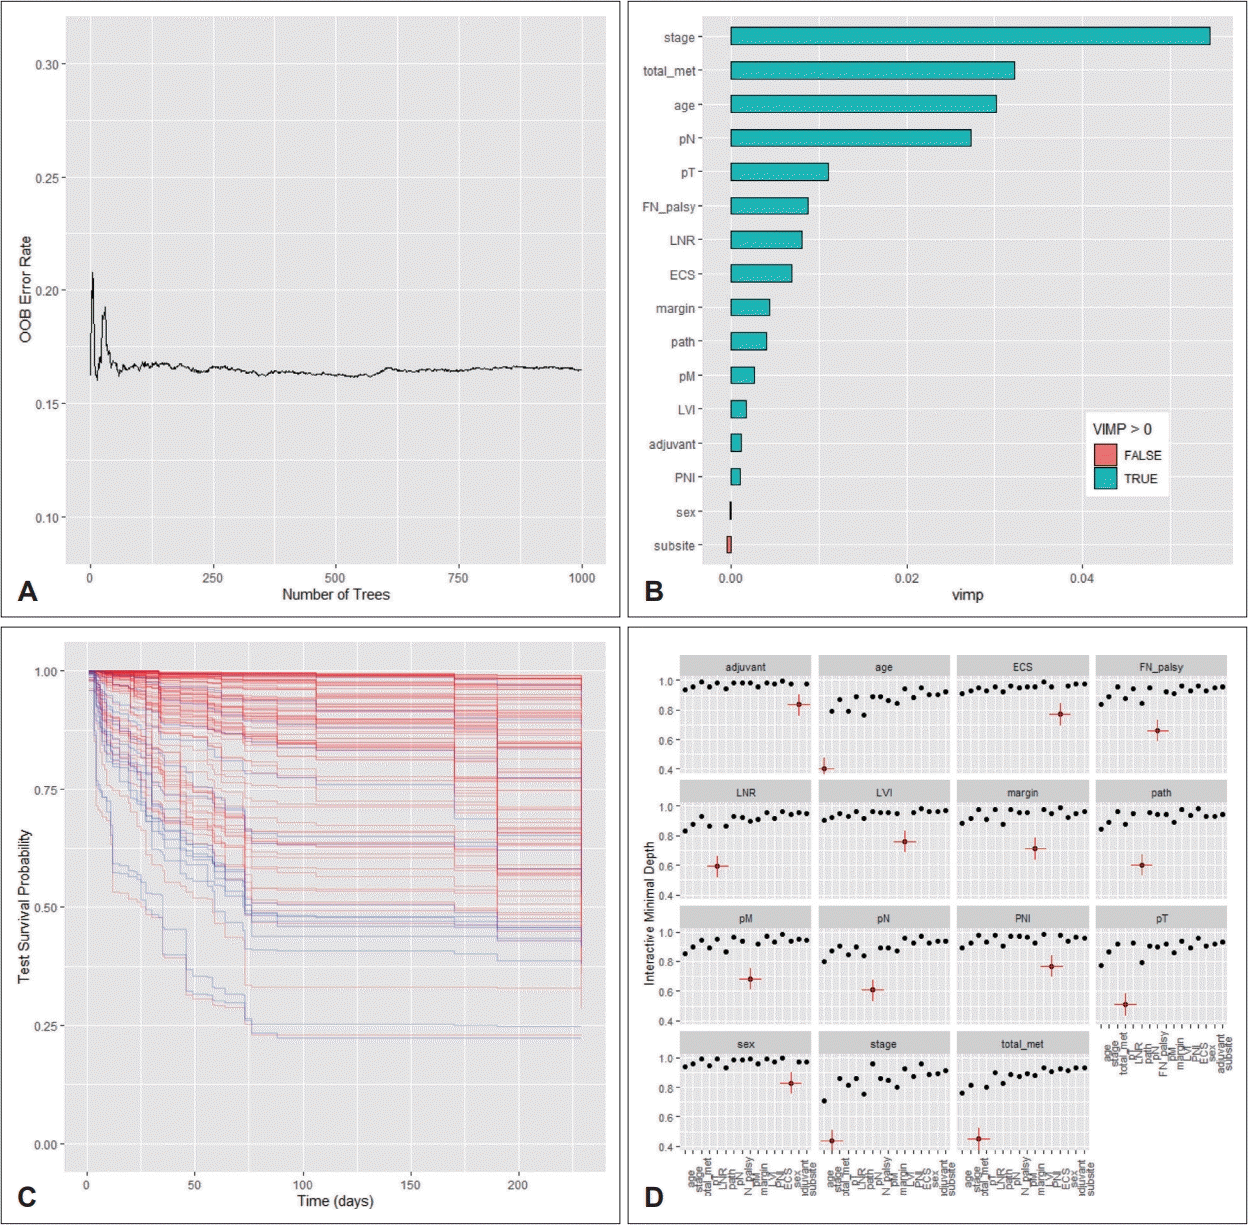
In the Random Survival Forest model, the c-index value for the training set was 0.86, and that for the test set was 0.82. Prediction error is calculated using OOB data (Fig. 3). The variable importance (VIMP) was obtained by measuring decrease in prediction accuracy when randomizing a particular variable. Variable with higher VIMP tends to contribute more to predictive accuracy. Feature importance of variables was shown in the order of stage, number of metastatic LNs, age, pN, pT, FN palsy, LNR, ENE, and surgical margin. Stage and age exhibited high importance in both the Random Survival Forest and CPH models. Interaction between variables is measured based on minimal depth. Stage and the number of metastatic LNs showed lowest minimal depth and are expected to be associated with other variables.
Deep learning-based model
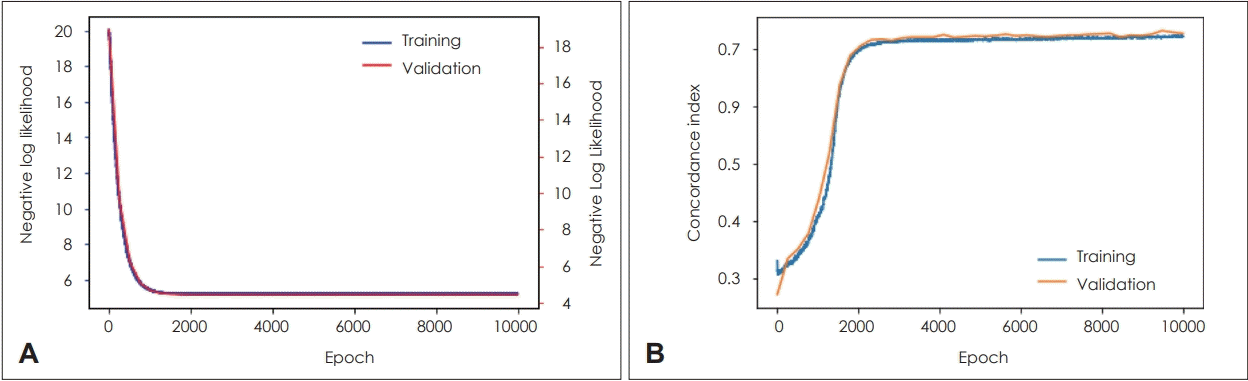
In the DeepSurv model, the c-index value was 0.72 for the training set and was 0.72 for the test set. The learning process of the DeepSurv model is visualized in Fig. 4 and overfitting was not observed in the DeepSurv model. Among the three models mentioned above, Random Survival Forest exhibited the highest performance in predicting survival of SGC patients.
Discussion
Due to the histological diversity and rarity of SGCs, there have been no high-quality randomized clinical trials establishing optimal treatment guidelines and analyzing prognostic factors. In previous study, pT, pN, sex, PNI, and histology were reported as risk factors for prognosis and distant metastasis in SGCs [11]. Another retrospective study reported that tumor site and presence of FN palsy were important prognostic factors [12]. In this study, we confirmed that T subsites and LVI findings were important prognostic factors related to disease recurrence, and pM, stage, LVI, LNR, age were important prognostic factors related to death on multivariate analysis. As mentioned above, the results of prognostic factors for SGCs differ from each other according to researchers. Therefore, further research is needed to determine why the prognostic factors of SGC patients differ according to researchers. However, those heterogenous prognostic factors should be considered for constructing survival prediction model of SGCs patients.
Currently, the TNM staging system is the most widely used tool for predicting the prognosis of solid cancer. The system classifies patient stage based on anatomical extent of the tumor but ignores other important factors such as patient age, pain, and histological grade [13]. In addition, since the TNM staging system does not reflect the biologic behavior of the tumor, some SGCs patients showed unexpected treatment outcomes not fit for their tumor staging. Therefore, some researchers have tried to make prognostic nomograms that reflect anatomical, biologic, and biochemical prognostic factors for predicting SGCs patient’s survival. A representative prognostic nomogram system for predicting recurrence after treatment of SGCs was proposed by three independent institutions. The nomogram system proposed by Memorial Sloan Kettering Cancer Center to predict the possibility of 5-year recurrence of SGCs showed a c-index of 0.84 in the validation group [14]. Mannelli, et al. [15] developed a prognostic nomogram to predict the possibility of 5-year recurrence after treatment of SGCs. The c-index value was 0.82, but no external validation was performed. Although these prognostic nomograms reflect various prognostic-related factors and show higher performance for predicting patient’s prognosis compared to previous TNM stage, further research should be performed to validate its clinical usefulness for predicting treatment outcomes of SGCs patients [16].
Traditional hazard-based models used to analyze prognostic factors in cancer patients can assume linear proportional hazards conditions and analyze the impact of variables influencing the survival curve. However, when there is multicollinearity between variables, the impact of the variable on the result can be diluted. On the other hand, machine learning algorithms are suitable for constructing nonlinear interaction models and are less affected by multicollinearity between variables. Therefore, it is possible to have all variables as inputs while decreasing bias and variance. Also, it can be used to present optimal treatment modalities that can benefit patients most or to predict the outcome of treatment. Among the machine learning models used in our study, Random Survival Forest exhibited the highest performance in predicting survival of SGC patients. The CPH model demonstrated the second highest performance, and the deep learning-based model showed the lowest performance. To confirm that the machine learning models did not overfit the training set, the performance of the corresponding model was measured and compared using the test set. No model overfitted the training set in our study.
In recent years, research on radiomics based on the analysis of imaging tests such as CT, MRI, PET has been actively conducted. This allows analysis of tumor aggressiveness or behavior based on imaging features extracted from imaging studies and can predict recurrence of disease and survival [17-19]. Also, the next generation sequencing technique has been used widely to find genetic information such as mutation and gene expression profile in the field of cancer genomics. If imaging features and genetic information related to prognosis of SGCs can be incorporated into our machine models, a more robust and accurate prediction model will be expected to be constructed. Then, patients can be classified by risk stratification using a robust prediction model, a precision medicine can be proposed. In other words, individualized therapy such as intensified therapy for high-risk patients and deintensified therapy for low-risk patients can be performed.
Considering the nature of machine learning models, it is a well-known fact that the performance of the model could be improved if high-quality, large-scale data are available. In general, if about 10000 patients are secured, sufficient performance can be expected in building a machine learning model in general. Also, considering the difference of prognosis according to the histological grade of SGC is significant, it is ideal to establish an independent model according to the lowgrade or high-grade tissue type. However, due to the rarity of SGC, there are practical problems to collect a sufficient number of patients through a single-institutional study. This limitation needs to be solved through collaborative research not only from multi-institutions but also from several countries. Before that, for large-scale research to be conducted, this kind of background clinical study and a report on the clinical applicability of a machine learning model must be accumulated.
To overcome those limitations, we will secure a sufficient number of patients through a multicenter clinical study planned in the future. Through additional multi-center clinical research, we will conduct external validation of the established model, and furthermore we will implement more robust predictive model construction and performance verification.
In conclusion, a survival prediction model using machine learning techniques showed exert acceptable performance in predicting survival of SGC patients. Although large-scale clinical and multicenter studies should be conducted to establish more powerful predictive model, we expect that individualized treatment will be possible according to risk stratification using a machine learning model.
 XML Download