Journal List > Anesth Pain Med > v.17(2) > 1516078254

Jee, Lee, Kim, Kim, and Woo: Association between anesthetic method and postpartum hemorrhage in Korea based on National Health Insurance Service data

Abstract

Background

Postpartum hemorrhage (PPH) is a major cause of maternal mortality and the risk factors for PPH differ among studies. In this large-scale study, we investigated whether the anesthetic method used was associated with PPH after cesarean section.

Methods

We extracted data on cesarean sections performed between January 2008 and June 2013 from the National Health Insurance Service database. The anesthetic methods were categorized into general, spinal and epidural anesthesia. To compare the likelihood of PPH among deliveries using different anesthetic methods, crude and adjusted odds ratios (ORs) and 95% confidence intervals were calculated using logistic regression analysis.

Results

Data from 330,324 cesarean sections were analyzed, and 21,636 cases of PPH were identified. Univariate analysis showed that general and epidural anesthesia increased the risk of PPH compared to spinal anesthesia. The OR for PPH was highest for morbidly adherent placenta, followed by placenta previa, placental abruption, and hypertension. When other clinical covariates were controlled for, general and epidural anesthesia still remained significant risk factors for PPH compared to spinal anesthesia.

Conclusions

This study showed that general and epidural anesthesia elevated the risk of PPH compared to spinal anesthesia during cesarean section. Since we could not consider the potential bias of group differences in indications, more in-depth clinical trials are needed to validate our findings. Obstetric factors such as placental abnormalities had high odds ratios and thus are more important than the choice of anesthetic method, which should be based on the patient’s clinical condition and institutional resources.

INTRODUCTION

Postpartum hemorrhage (PPH) is a major cause of maternal mortality. An increasing incidence of PPH has been reported in many countries, possibly related to older maternal age, obesity, multiple pregnancies, previous cesarean deliveries, labor induction and augmentation, and better detection methods [1,2]. However, the causes are still not fully understood. General anesthesia is a risk factor for PPH after cesarean delivery, since volatile anesthetic agents inhibit spontaneous contractility of uterine muscle in a dose-dependent manner [1,35].
Neuraxial anesthesia is generally preferred over general anesthesia for cesarean section [6,7]. The main reason is the difficult airway management associated with general anesthesia, but other factors also influence the decision, including intraoperative awareness, postoperative bleeding, neonatal safety, postoperative pain management, and maternal bonding with the newborn following delivery [7]. According to previous reports, general anesthesia is used in about 6% of planned cesarean deliveries in the United States [8]. A study of the anesthetic methods used for cesarean delivery in Korea between 2013 and 2018 reported that general and regional anesthesia were used in 27.4% and 72.6% of cesarean deliveries, respectively [6]. While the use of general anesthesia has declined significantly, it is still used much more frequently in Korea compared to other countries [9]. In this large-scale study using National Health Insurance Service (NHIS) data, we investigated whether the anesthetic method was associated with PPH after cesarean section. 

MATERIALS AND METHODS

Data source and subjects

This study was approved by the Institutional Review Board. We analyzed data from an NHIS database (no. NHIS-2020-1-274). Cesarean sections have been under the diagnosis-related group (DRG) payment system since July 2013 in Korea, so for almost all cases after that date we could not identify the mode of anesthesia from the NHIS database. Therefore, data on cesarean sections performed between January 2008 and June 2013 were extracted. Clinical characteristics and comorbidities were identified using the Korean Classification of Diseases (KCD), which is based on the International Classification of Diseases, 10th edition. Cesarean section was defined by codes O82 and O842. The exclusion criteria were malignancies (C00-97), diseases of the blood and blood-forming organs, immune-system disorders (D50-89), obstetric trauma causing rupture of the uterus (O71), and antepartum hemorrhage (O46). The anesthetic methods were categorized into general anesthesia (L1211, L1221), spinal anesthesia (L1213, L1223), and epidural anesthesia (L1214, L1224), based on a previous study reporting trends in anesthetic methods in Korea [6]. Cases in which the anesthetic method could not be verified were excluded from the analysis.

Outcomes and statistical analysis

SAS software (version 9.4, SAS Inc., USA) was used for the statistical analysis. The main outcome measure was the occurrence of PPH after cesarean section, corresponding to codes O721 (hemorrhage following delivery of placenta and atonic PPH) and O622 (uterine inertia), within 1 month of cesarean delivery. To compare patient characteristics among groups, continuous variables were assessed by analysis of variance and are presented as the mean ± SD. Categorical variables were analyzed using the chi-square test. To assess risk factors for PPH, and its likelihood of occurrence according to different anesthetic methods, crude and adjusted odds ratios (ORs), and 95% confidence intervals (CIs), were estimated using logistic regression analysis with forward selection. Initially, 19 variables were identified as possible covariates based on a literature review. Variables with high rates of missing data and a high Pearson correlation coefficient (> 0.8) were excluded. Finally, covariates adjusted for in the multivariate logistic regression models included maternal age, emergency operation (O821), previous PPH (O721, O622 during a previous delivery), multiple pregnancy (O30), placenta previa (O44), placental abruption (O45), morbidly adherent placenta (O432), preeclampsia (O11, O14), eclampsia (O15), hypertension (O10: preexisting gestational hypertension, O13: gestational hypertension, or O16: unspecified maternal hypertension), diabetes mellitus (O24), and the level of care. The diagnostic codes did not change during the study period. The hospitals where the cesarean sections were performed were classified according to the Korean Medical Care Act (tertiary, general, hospital, or clinic). Our logistic regression model was assessed using the Hosmer–Lemeshow goodness-of-fit test, which was not significant. P values < 0.05 were considered statistically significant.

RESULTS

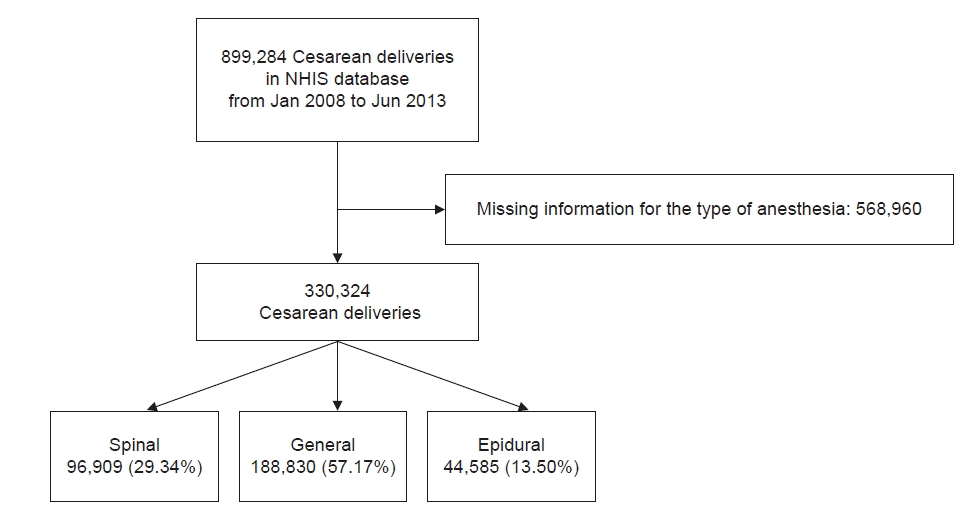
A total of 899,284 cesarean sections performed between January 2008 and June 2013 were identified in the NHIS database after applying the exclusion criteria. The method of anesthesia could not be confirmed in 568,960 cases. Finally, the data from 330,324 cesarean sections were analyzed, revealing the use of general anesthesia in 57.17%, spinal anesthesia in 29.34%, and epidural anesthesia in 13.50% (Fig. 1). The patient characteristics are shown in Table 1. In emergency cases, the proportion of epidural anesthesia was higher than that of spinal and general anesthesia. The data also revealed that 42.56% of cesarean sections were conducted in clinics, 25.83% in hospitals, 17.38% in tertiary care hospitals and 14.24% in general hospitals.
Table 2 summarizes the characteristics of women according to the occurrence of PPH. In total, 21,636 cases of PPH (6.55%) were identified from among the 330,324 cesarean sections. Univariate analysis showed that general anesthesia and epidural anesthesia increased the risk of PPH 1.10-fold (95% CI 1.06–1.13) and 1.41-fold (95% CI 1.36‒1.46), respectively, compared to spinal anesthesia. The highest OR for PPH was observed for morbidly adherent placenta (OR 3.84, 95% CI 3.09‒4.77), followed by placenta previa (OR 1.45, 95% CI 1.35‒1.55), placental abruption (OR 1.36, 95% CI 1.20‒1.55), and hypertension (OR 1.24, 95% CI 1.14‒1.35). Table 3 shows the associations between anesthesia types and PPH, while controlling for clinical covariates. When placental abruption, placenta previa, morbidly adherent placenta, hypertension, preeclampsia, eclampsia, and diabetes mellitus were controlled for, general (OR 1.06, 95% CI 1.03‒1.10) and epidural anesthesia (OR 1.47, 95% CI 1.41‒1.53) remained significant risk factors for PPH compared to spinal anesthesia.

DISCUSSION

This study showed that compared to spinal anesthesia, general and epidural anesthesia increased the risk of PPH in women undergoing cesarean section. However, we could not consider all of the important clinical factors that might have influenced the results. The obstetric factors still had higher odds ratios, implying that obstetric factors such as placental abnormalities were more important than the choice of anesthetic method.
Animal and experimental studies have demonstrated that volatile anesthetics can cause significant uterine relaxation [3,10]. In a rat model, Dogru et al. [10] showed that desflurane at a minimum alveolar concentration (MAC) of 0.5 did not affect the duration or amplitude of spontaneous uterine contractions, but decreased their frequency. At 1 and 2 MAC, desflurane significantly decreased the duration, amplitude and frequency of uterine contractions. Similarly, sevoflurane at 2 MAC significantly decreased the duration, amplitude and frequency of uterine contractions, whereas it did not at 0.5 MAC. In oxytocin-stimulated human myometrial fibers, exposure to 0.5, 1, and 2 MAC of desflurane and sevoflurane reduced the frequency and amplitude of contractions in a dose-dependent manner. The authors suggested that 0.5 MAC of both agents, and 1 MAC of desflurane, might be safe in the presence of oxytocin during cesarean section [3]. Given the evidence above, questions arise as to whether regional versus general anesthesia really affects the risk of PPH and whether regional anesthesia should be preferred in PPH cases [11]. Studies have reported that general anesthesia is a risk factor for PPH, with ORs ranging from 1.87 to 22.25 depending on the study design, population and definition of PPH [1,5,12]. It has also been reported that various surgeries, including cesarean deliveries, performed under general anesthesia resulted in greater blood loss compared to neuraxial anesthesia [13,14]. A retrospective study comparing general and spinal anesthesia for cesarean section in Korea reported lower blood loss in a spinal anesthesia group (819.9 ± 81.9 ml) than in a general anesthesia group (856.7 ± 117.9 ml). The difference, however, was not considered clinically significant [15]. Generally, obstetric anesthesiologists use low concentrations of volatile anesthetics during cesarean section to minimize their negative effects on uterine muscle contraction [16]. Given that our results imply an OR of 1.06 for general anesthesia, concerns about postoperative bleeding do not seem to be a major factor when considering the method of anesthesia for cesarean section. Instead, the choice of anesthetic method should be made on the basis of clinical conditions and institutional resources [17]. Beilin [11] reported that general anesthesia is preferable if massive hemorrhage is likely, because the patients may become hypovolemic and airway edema may result from large-volume fluid resuscitation.
Interestingly, we also found that epidural anesthesia carried a significantly greater risk of PPH than spinal anesthesia. A previous case-control study exploring risk factors for PPH showed that the risk was greater for epidural and combined spinal and epidural (CSE) anesthesia compared to spinal anesthesia alone. The adjusted OR of CSE during cesarean section without labor was 3.13 (95% CI 1.71–5.71), while the unadjusted OR of CSE and epidural anesthesia during intrapartum cesarean delivery was 2.59 (95% CI 1.45–4.62) and 1.65 (95% CI 1.11–2.44), respectively [5]. However, there were group differences in indications according to the anesthetic method. In another study, patient-controlled epidural analgesia suppressed uterine and abdominal muscle electromyographic activity during the second stage of labor [18]. Other studies of cesarean section have reported significant hypotension, deeper surgical anesthesia, better postoperative pain control, and decreased use of additional analgesics with spinal compared to epidural anesthesia [19,20]. Since uterine blood flow is not autoregulated, uteroplacental perfusion is directly dependent on maternal perfusion pressure. However, these explanations are not sufficient to answer why epidural anesthesia may be a higher risk factor for PPH compared to spinal anesthesia. Confounders might have influenced our results; for example, epidural anesthesia is preferred in emergency situations if the patient already has a functioning epidural catheter in place for controlling labor pain. The frequency of emergency cases in our data was higher in the epidural group than in the other groups; 67.32% of spinal anesthesia cases were elective and 39.98% of epidural anesthesia cases were considered emergency. Cesarean section after labor onset can increase the risk of PPH. Desensitization due to large doses of oxytocin for labor induction, uterine muscle fatigue, and intrapartum factors such as chorioamnionitis may explain the higher risk of PPH after labor induction. [5,2124]. In the current study, we did not have information about the dosage or timing of uterotonic use for labor induction, and whether the patients underwent cesarean section after labor was not known, which might have influenced our results.
The obstetric risk factors for PPH identified in this analysis are well-recognized and consistent with previous studies [23,25]. Multiple gestations are associated with impaired uterine contractility. Magnesium sulfate, used in patients with preeclampsia and eclampsia, can compromise uterine contractility and often causes platelet dysfunction [22]. Risk factors reported in the literature are mostly related to uterine activity. However, in a study investigating uterine contractile waves during the 2 hours after placental delivery, no correlation was found between uterine activity and blood loss, indicating that other factors are involved in hemostasis, such as coagulation factors [26]. A large US study using nationwide data showed that more than 60% of patients who hemorrhaged from atony and required transfusion did not have any identifiable antepartum risk factors [22]. Although recognition of PPH risk factors is crucial, measures to deal with unexpected PPH are also needed because uterine atony is difficult to predict before delivery in the absence of well-recognized causes.
The study period began in January 2008 so that any changes in the diagnostic codes could be tracked based on the fifth revision of the KCD. Due to difficulty in identifying the anesthetic method used for cases under the DRG payment system, data were extracted up to July 2013. Caution should be taken when interpreting our results because we could not include all cesarean sections performed during the study period. First of all, data of patients who had malignancies, diseases of the blood or blood-forming organs, and obstetric trauma were excluded. Moreover, the DRG payment system was applied in some centers on a trial basis during this study period, and we could not identify the anesthetic method in such cases. As a result, our data included only about 40% of all cesarean sections performed during the study period and the results may not reflect the actual population. As such, we were concerned about the possibility of selection bias. Literature data on the relative proportions of anesthetic methods used for cesarean deliveries are available only from 2013 to 2018 [6]. Analysis thereof showed that the rate of spinal anesthesia increased from 40.0% in 2013 to 53.7% in 2018, while the opposite trend was observed in general anesthesia, which decreased from 37.1% in 2013 to 22.2% in 2018. Considering this trend, general anesthesia might have been performed more frequently in the period between 2008 and 2013, in line with our results. Nonetheless, the rates of use of each anesthetic method and incidence of PPH in this study might not reflect the actual rates for the general population.
Our study was subject to the inherent limitations of a retrospective analysis. We could not consider several clinically relevant variables, such as body mass index, types and concentrations of volatile anesthetics used, uterotonic use, spontaneous labor and labor augmentation before cesarean delivery, parity, fetal birth weight, postpartum blood loss volume, volume of transfused blood and hemoglobin level, which might influence our results. Misclassification of cases may also have occurred due to coding errors.
In conclusion, analyzing a nationwide dataset, general and epidural anesthesia during cesarean section increased the risk of PPH compared to spinal anesthesia. As we could not consider the potential influence of confounders, future studies analyzing more detailed clinical datasets are needed to validate these findings. Obstetric risk factors such as placental abnormalities had high odds ratios; as such, they are more important than the choice of anesthetic method, which should be based on the patient’s clinical condition and institutional resources.

Notes

FUNDING

This research was supported by Research Grant 2019 funded by the Korean Society of Obstetric Anesthesiologists.

CONFLICTS OF INTEREST

No potential conflict of interest relevant to this article was reported.

DATA AVAILABILITY STATEMENT

All data generated or analyzed during this study are included in this published article.

AUTHOR CONTRIBUTIONS

Conceptualization: Jae Hee Woo. Data curation: Yongho Jee. Formal analysis: Yongho Jee. Funding acquisition: Jae Hee Woo. Methodology: Jae Hee Woo. Writing - original draft: Hyun Jung Lee, Jae Hee Woo. Writing - review & editing: Jae Hee Woo. Investigation: Jae Hee Woo. Software: Yongho Jee. Supervision: Youn Jin Kim, Dong Yeon Kim, Jae Hee Woo.

REFERENCES

1. van Stralen G, von Schmidt Auf Altenstadt JF, Bloemenkamp KW, van Roosmalen J, Hukkelhoven CW. Increasing incidence of postpartum hemorrhage: the Dutch piece of the puzzle. Acta Obstet Gynecol Scand. 2016; 95:1104–10.
crossref
2. Reale SC, Easter SR, Xu X, Bateman BT, Farber MK. Trends in postpartum hemorrhage in the United States from 2010 to 2014. Anesth Analg. 2020; 130:e119–22.
crossref
3. Yildiz K, Dogru K, Dalgic H, Serin IS, Sezer Z, Madenoglu H, et al. Inhibitory effects of desflurane and sevoflurane on oxytocin-induced contractions of isolated pregnant human myometrium. Acta Anaesthesiol Scand. 2005; 49:1355–9.
crossref
4. Kawakita T, Mokhtari N, Huang JC, Landy HJ. Evaluation of risk-assessment tools for severe postpartum hemorrhage in women undergoing cesarean delivery. Obstet Gynecol. 2019; 134:1308–16.
crossref
5. Butwick AJ, Ramachandran B, Hegde P, Riley ET, El-Sayed YY, Nelson LM. Risk factors for severe postpartum hemorrhage after cesarean delivery: case-control studies. Anesth Analg. 2017; 125:523–32.
6. Park JI, Park SH, Kang MS, Kang GW, Kim ST. Evaluation of changes in anesthetic methods for cesarean delivery: an analysis for 5 years using the big data of the Korean Health Insurance Review and Assessment Service. Anesth Pain Med (Seoul). 2020; 15:305–13.
crossref
7. Wong CA. General anesthesia is unacceptable for elective cesarean section. Int J Obstet Anesth. 2010; 19:209–12.
crossref
8. Juang J, Gabriel RA, Dutton RP, Palanisamy A, Urman RD. Choice of anesthesia for cesarean delivery: an analysis of the national anesthesia clinical outcomes registry. Anesth Analg. 2017; 124:1914–7.
9. Butwick AJ, Palanisamy A. Mode of anaesthesia for caesarean delivery and maternal morbidity: can we overcome confounding by indication? Br J Anaesth. 2018; 120:621–3.
crossref
10. Dogru K, Dalgic H, Yildiz K, Sezer Z, Madenoglu H. The direct depressant effects of desflurane and sevoflurane on spontaneous contractions of isolated gravid rat myometrium. Int J Obstet Anesth. 2003; 12:74–8.
crossref
11. Beilin Y. Maternal hemorrhage-regional versus general anesthesia: does it really matter? Anesth Analg. 2018; 127:805–7.
12. Rouse DJ, MacPherson C, Landon M, Varner MW, Leveno KJ, Moawad AH, et al. National Institute of Child Health and Human Development Maternal-Fetal Medicine Units Network. Blood transfusion and cesarean delivery. Obstet Gynecol. 2006; 108:891–7.
13. Guay J. The effect of neuraxial blocks on surgical blood loss and blood transfusion requirements: a meta-analysis. J Clin Anesth. 2006; 18:124–8.
crossref
14. Afolabi BB, Lesi FE. Regional versus general anaesthesia for caesarean section. Cochrane Database Syst Rev. 2012; 10:CD004350.
crossref
15. Sung TY, Jee YS, You HJ, Cho CK. Comparison of the effect of general and spinal anesthesia for elective cesarean section on maternal and fetal outcomes: a retrospective cohort study. Anesth Pain Med (Seoul). 2021; 16:49–55.
crossref
16. Elena R, Pamela F, Mrinalini B. Effects of anesthesia on uterine activity, progress in labor and outcomes. Shnider and Levinson's: anesthesia for obstetrics. 5th ed. In : Suresh MS, Segal S, Preston RL, Fernando R, LaToya Mason C, editors. Philadelphia (PA): Lippincott Williams & Wilkins;2013. p. 156.
17. Hawkins JL. Excess in moderation: general anesthesia for cesarean delivery. Anesth Analg. 2015; 120:1175–7.
18. Qian X, Li P, Shi SQ, Garfield RE, Liu H. Uterine and abdominal muscle electromyographic activities in control and PCEA-treated nulliparous women during the second stage of labor. Reprod Sci. 2017; 24:1214–20.
crossref
19. Ng K, Parsons J, Cyna AM, Middleton P. Spinal versus epidural anaesthesia for caesarean section. Cochrane Database Syst Rev. 2004; 2:CD003765.
crossref
20. Schewe JC, Komusin A, Zinserling J, Nadstawek J, Hoeft A, Hering R. Effects of spinal anaesthesia versus epidural anaesthesia for caesarean section on postoperative analgesic consumption and postoperative pain. Eur J Anaesthesiol. 2009; 26:52–9.
crossref
21. Zhang J, Troendle J, Reddy UM, Laughon SK, Branch DW, Burkman R, et al. Consortium on Safe Labor. Contemporary cesarean delivery practice in the United States. Am J Obstet Gynecol. 2010; 203:326.e1–10.
22. Bateman BT, Berman MF, Riley LE, Leffert LR. The epidemiology of postpartum hemorrhage in a large, nationwide sample of deliveries. Anesth Analg. 2010; 110:1368–73.
crossref
23. Nyfløt LT, Sandven I, Stray-Pedersen B, Pettersen S, Al-Zirqi I, Rosenberg M, et al. Risk factors for severe postpartum hemorrhage: a case-control study. BMC Pregnancy Childbirth. 2017; 17:17.
crossref
24. Belghiti J, Kayem G, Dupont C, Rudigoz RC, Bouvier-Colle MH, Deneux-Tharaux C. Oxytocin during labour and risk of severe postpartum haemorrhage: a population-based, cohort-nested case-control study. BMJ Open. 2011; 1:e000514.
crossref
25. Mhyre JM, Shilkrut A, Kuklina EV, Callaghan WM, Creanga AA, Kaminsky S, et al. Massive blood transfusion during hospitalization for delivery in New York State, 1998-2007. Obstet Gynecol. 2013; 122:1288–94.
crossref
26. Masuzawa Y, Yaeko K. Uterine activity during the two hours after placental delivery among low-risk pregnancies: an observational study. J Matern Fetal Neonatal Med. 2017; 30:2446–51.
crossref

Fig. 1.
Flow diagram of participants who underwent cesarean section. NHIS: the National Health Insurance Service.
apm-21068f1.tif
Table 1.
Characteristics of Women according to Anesthetic Methods Used for Cesarean Delivery
Variable Spinal (n = 96,909) General (n = 188,830) Epidural (n = 44,585)
Age (yr) 32.31 ± 4.10 31.95 ± 4.30 31.84 ± 4.02
Emergency No 65,245 (67.33) 120,381 (63.75) 27,139 (60.87)
Yes 31,664 (32.67) 68,449 (36.25) 17,446 (39.13)
Previous PPH No 86,356 (89.11) 168,314 (89.14) 39,711 (89.07)
Yes 10,553 (10.89) 20,516 (10.86) 4,874 (13.68)
Multiple pregnancy No 93,145 (96.12) 183,437 (97.14) 43,754 (98.14)
Yes 3,764 (3.88) 5,393 (2.86) 831 (1.86)
Placental abruption No 96,215 (99.28) 186,611 (98.82) 44,386 (99.55)
Yes 694 (0.72) 2,219 (1.18) 199 (0.45)
Placenta previa No 94,788 (97.81) 181,558 (96.15) 44,070 (98.84)
Yes 2,121 (2.19) 7,272 (3.85) 515 (1.16)
MAP No 96,756 (99.84) 188,517 (99.83) 44,553 (99.93)
Yes 153 (0.16) 313 (0.17) 32 (0.07)
Hypertension No 94,693 (97.71) 184,821 (97.88) 43,750 (98.13)
Yes 2,216 (2.29) 4,009 (2.12) 835 (1.87)
Diabetes No 93,022 (95.99) 182,230 (96.5) 43,331 (97.19)
Yes 3,887 (4.01) 6,600 (3.5) 1,254 (2.81)
Preeclampsia/eclampsia No 93,851 (96.84) 183,299 (97.07) 43,529 (97.63)
Yes 3,058 (3.16) 5,531 (2.93) 1,056 (2.37)
Level of care Tertiary 20,370 (21.02) 32,951 (17.45) 4,080 (9.15)
General 14,730 (15.20) 27,399 (14.51) 4,895 (10.98)
Hospital 23,384 (24.13) 46,150 (24.44) 15,783 (35.40)
Clinic 38,424 (39.65) 82,330 (43.60) 19,828 (44.47)

Values are presented as mean ± SD or number (%). PPH: postpartum hemorrhage, MAP: morbidly adherent placenta.

Table 2.
Characteristics of Women according to Severe Postpartum Hemorrhage after Cesarean Delivery
Variable No PPH (n = 308,688) PPH (n = 21,636) Unadjusted odds ratio (95% CI)
Age (yr) 32.06 ± 4.21 31.98 ± 4.19 1.00 (1.00–1.00)
Anesthetic method Spinal 91,191 (94.10) 5,718 (5.9) 1.00
General 176,713 (93.58) 12,117 (6.42) 1.10 (1.06–1.13)*
Epidural 40,769 (91.44) 3,801 (8.56) 1.41 (1.36–1.46)*
Emergency No 199,101 (93.99) 12,720 (6.01) 1.00
Yes 106,833 (92.46) 8,718 (7.54) 1.28 (1.24–1.31)*
Previous PPH No 272,775 (93.29) 18,980 (6.71) 1.00
Yes 33,159 (93.10) 2,458 (6.90) 1.07 (1.02–1.11)*
Multiple pregnancy No 296,686 (93.47) 20,731 (6.53) 1.00
Yes 9,248 (92.9) 707 (7.1) 1.09 (1.01–1.18)*
Placental abruption No 305,845 (93.47) 21,360 (6.53) 1.00
Yes 2,842 (91.32) 270 (8.68) 1.36 (1.20–1.55)*
Placenta previa No 299,685 (93.53) 20,731 (6.47) 1.00
Yes 9,007 (90.91) 901 (9.09) 1.45 (1.35–1.55)*
MAP No 308,288 (93.47) 21,531 (6.53) 1.00
Yes 393 (78.86) 105 (21.14) 3.84 (3.09–4.77)*
Preeclampsia/eclampsia No 296,995 (93.46) 20,783 (6.54) 1.00
Yes 8,944 (93.22) 650 (6.78) 1.04 (0.96–1.13)
Hypertension No 302,187 (93.48) 21,070 (6.52) 1.00
Yes 6,498 (92.04) 562 (7.96) 1.24 (1.14–1.35)*
Diabetes No 299,784 (93.49) 20,876 (6.51) 1.00
Yes 8,904 (92.32) 741 (7.68) 1.20 (1.12–1.28)*

Values are presented as mean ± SD or number (%). CI: confidence interval, PPH: postpartum hemorrhage, MAP: morbidly adherent placenta.

* P < 0.05.

Table 3.
Multivariate Logistic Model of Postpartum Hemorrhage
Variable Adjusted odds ratio (95% CI)
Model 1 Model 2 Model 3
Anesthetic method Spinal 1.00 1.00 1.00
General 1.08 (1.05–1.11)* 1.07 (1.04–1.11)* 1.06 (1.03–1.10)*
Epidural 1.48 (1.42–1.54)* 1.49 (1.43–1.56)* 1.47 (1.41–1.53)*
Age 1.00 (1.00–1.00) 1.00 (1.00–1.00) 1.00 (1.00–1.00)
Multiple pregnancy No 1.00 1.00
Yes 1.13 (1.04–1.22)* 1.15 (1.06–1.24)*
Previous PPH No 1.00 1.00
Yes 1.07 (1.02–1.12)* 1.07 (1.02–1.11)*
Placental abruption No 1.00 1.00
Yes 1.35 (1.19–1.53)* 1.22 (1.08–1.39)*
Placenta previa No 1.00 1.00
Yes 1.44 (1.35–1.55)* 1.45 (1.35–1.56)*
MAP No 1.00 1.00
Yes 3.46 (2.78–4.31)* 3.44 (2.76–4.28)*
Emergency No 1.00
Yes 1.27 (1.23–1.30)*
Preeclampsia/eclampsia No 1.00
Yes 0.96 (0.89–1.05)
Hypertension No 1.00
Yes 1.22 (1.12–1.33)*
Diabetes No 1.00
Yes 1.22 (1.13–1.31)*

CI: confidence interval, PPH: postpartum hemorrhage, MAP: morbidly adherent placenta.

* P < 0.05.

TOOLS
Similar articles