Journal List > Anesth Pain Med > v.17(2) > 1516078251

Kim, Lee, Sang, and Hwang: Intraoperative lactic acid concentration during liver transplantation and cutoff values to predict early mortality: a retrospective analysis of 3,338 cases

Abstract

Background

We aimed to explore the distribution of intraoperative lactic acid (LA) level during liver transplantation (LT) and determine the optimal cutoff values to predict post-LT 30-day and 90-day mortality.

Methods

Intraoperative LA data from 3,338 patients were collected between 2008 to 2019 and all-cause mortalities within 30 and 90 days were retrospectively reviewed. Of the three LA levels measured during preanhepatic, anhepatic, and neohepatic phase of LT, the peak LA level was selected to explore the distribution and predict early post-LT mortality. To determine the best cutoff values of LA, we used a classification and regression tree algorithm and maximally selected rank statistics with the smallest P value.

Results

The median intraoperative LA level was 4.4 mmol/L (range: 0.5–34.7, interquartile range: 3.0–6.2 mmol/L). Of the 3,338 patients, 1,884 (56.4%) had LA levels > 4.0 mmol/L and 188 (5.6%) had LA levels > 10 mmol/L. Patients with LA levels > 16.7 mmol/L and 13.5–16.7 mmol/L showed significantly higher 30-day mortality rates of 58.3% and 21.2%, respectively. For the prediction of the 90-day mortality, 8.4 mmol/L of intraoperative LA was the best cutoff value.

Conclusions

Approximately 6% of the LT recipients showed intraoperative hyperlactatemia of > 10 mmol/L during LT, and those with LA > 8.4 mmol/L were associated with significantly higher early post-LT mortality.

INTRODUCTION

The liver plays a key role in lactate metabolism. Hyperlactatemia is generally considered as an increase in lactate production due to anaerobic metabolism in a state of reduced organ perfusion. However, measured lactic acid (LA) concentrations are the sum of metabolic and catabolic process, therefore hyperlactatemia may be due to an increase in production or a reduction in clearance in liver disease [1,2].
Additionally, the liver can be transformed into a lactate-producing organ in cases of hypoxia, sepsis, or liver surgery [14]. Therefore, given the enhanced lactate production, reduction in clearance, and lactate-producing liver itself after reperfusion of the allograft, extremely high intraoperative LA levels are expected in patients undergoing liver transplantation (LT). However, compared to those of critically ill patients, characteristics of intraoperative LA concentrations during LT have been poorly studied in a large cohort of LTs. In addition, although there are studies that found that lactate clearance shortly after reperfusion of an allograft is associated with short-term prognosis [57], research on cutoff levels of intraoperative LA to predict early mortality remains poorly investigated [8,9].
To better understand the changes in LA concentration during LT, we thoroughly explored both preoperative and intraoperative LA and, furthermore, determined optimal cutoff values of intraoperative LA to predict post-LT 30-day and 90-day mortality.

MATERIALS AND METHODS

Study population

The Institutional Review Board approved the study design and a waiver of informed consent for participants (no. 2021-0664). Data from the institution’s LT Registry, which prospectively registered patients who underwent LT, was extracted via the software, a fully computerized and automatic data extraction program. From January 2008 to December 2019, there were 4,604 potentially eligible LT recipients. Among them, 3,338 patients with measured intraoperative LA levels were chosen. We included the majority of heterogenous LT recipients because we aimed to characterize intraoperative LA and determine optimal cutoff values of hyperlactatemia to predict early post-LT mortality.

Data collection

Patient demographics, medical history, Model for End-stage Liver Disease score (MELDs), and preoperative laboratory variables were obtained automatically using the hospital software. All-cause mortality data were obtained from patients’ electronic medical records and the updated record of the institution’s LT Registry, which regularly follows all the registerd LT recipients.

Measurement of intraoperative LA during LT

Intraoperative LA levels were measured three times during the preanhepatic, anhepatic, and neohepatic periods as per the institution’s routine intraoperative protocol. Of these, the peak level of intraoperative LA was used to analyze its distribution and predict early post-LT mortality. Preoperative LA concentration was also measured before LT as a routine work-up.

Study end-point

Primary and secondary end-points were 30-day and 90-day mortality, respectively.

Statistical analysis

Data are expressed as the mean ± standard deviation or median (1st quartile, 3rd quartile) for continuous variables, and numbers and percentages for categorical variables. Analyses between groups were performed using the Student’s t-test, the Mann–Whiney U test, analysis of variance, or the Kruskal–Wallis test for continuous variables and the χ2 test or Fisher’s exact test for categorical variables, as appropriate. The Kolmogorov–Smirnov test was used to test the normality assumption. To determine the best cutoff values of LA, we used a classification and regression tree (CART) algorithm of recursive partitioning and maximally selected rank statistics with the smallest P value (‘caret’ and ‘maxstat’ R package). Briefly, in maximally selected rank statistics. The prognostic cutoff point was determined by evaluating every possible cutoff point classifying all patients into two groups according to their level and selecting the most discriminant threshold for death, corresponding to the minimum P value according to the log-rank test [1012]. The Kaplan–Meier (KM) survival curve was used to depict the risk of 30-day and 90-day mortality.

RESULTS

The mean age of the 3,338 LT recipients included was 53.3 ± 9.0 years. Of the patients, 2,443 (73.2%) were men. The mean MELDs was 18.2 ± 10.9 (Table 1). The primary causes of liver disease were virus-related liver cirrhosis (63.1%) and alcoholic liver disease (20.3%), followed by others (18%).

Distribution of preoperative and intraoperative LA

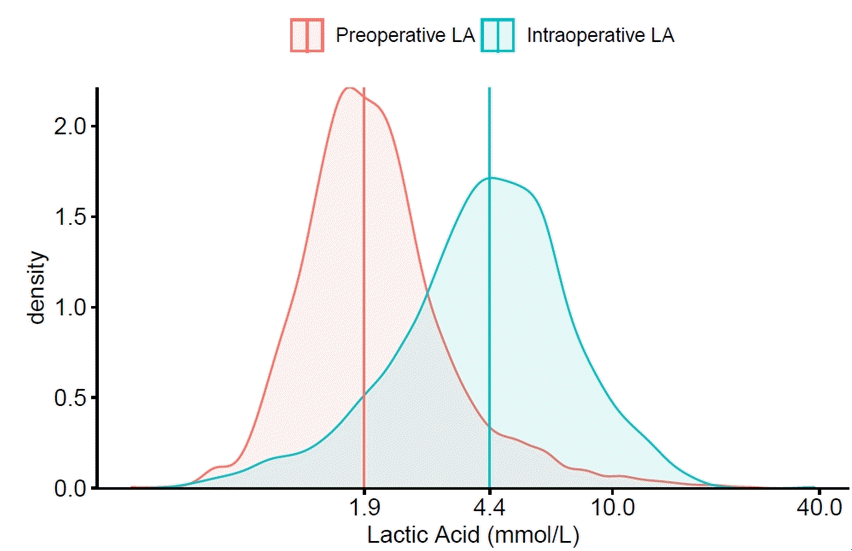
The preoperative median LA level was 1.9 mmol/L (range: 0.4–24.6, interquartile range [IQR]: 1.5–2.6 mmol/L, n = 1,741), but it was markedly increased intraoperatively to a median LA level of 4.4 mmol/L (range: 0.5–34.7, IQR: 3.0–6.2 mmol/L, n = 3,338) (Fig. 1).
A total of 1,884 (56.4%) patients had intraoperative LA levels > 4.0 mmol/L, and while 188 (5.6%) had intraoperative LA levels > 10 mmol/L.

Distribution of intraoperative LA according to MELDs

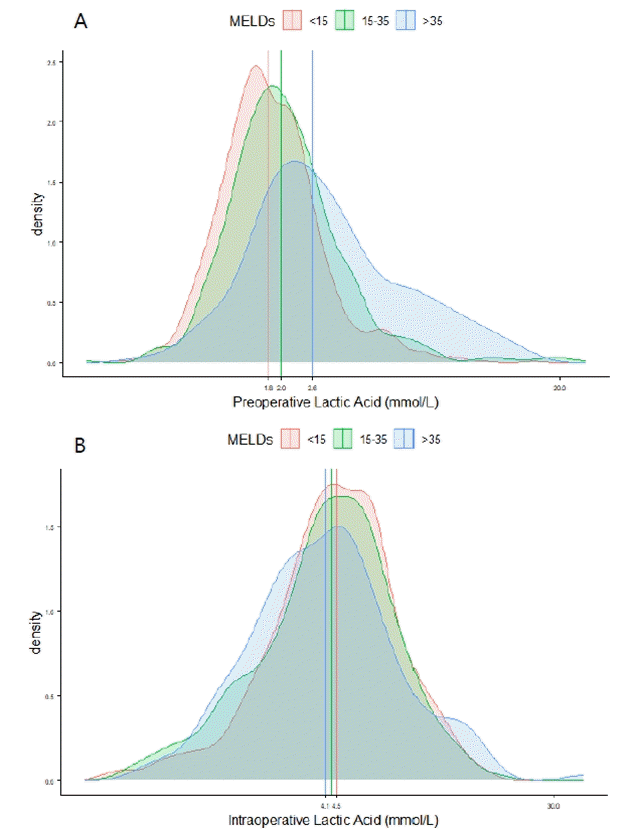
When the patients were grouped according to MELDs of < 15 (n = 1,807, 54.1%), 15–35 (n = 1,169, 35%), and > 35 (n = 362, n = 10.8%), preoperative LA levels increased and separated clearly along with the increase of MELDs (1.8, IQR: 1.4–2.3 vs. 2.0, IQR: 1.5–2.6 vs. 2.6, IQR: 1.9–4.2 mmol/L, respectively; P < 0.001), whereas, despite the marked increase of intraoperative LA levels, the separation of LA levels were modest and somewhat inversed (4.5, IQR: 3.2–6.3 vs. 4.3, IQR: 2.9–6.2 vs. 4.1, IQR: 2.7–6.0, respectively; P = 0.002) compared to preoperative LA (Fig. 2).

Prognostic cutoff values of intraoperative LA

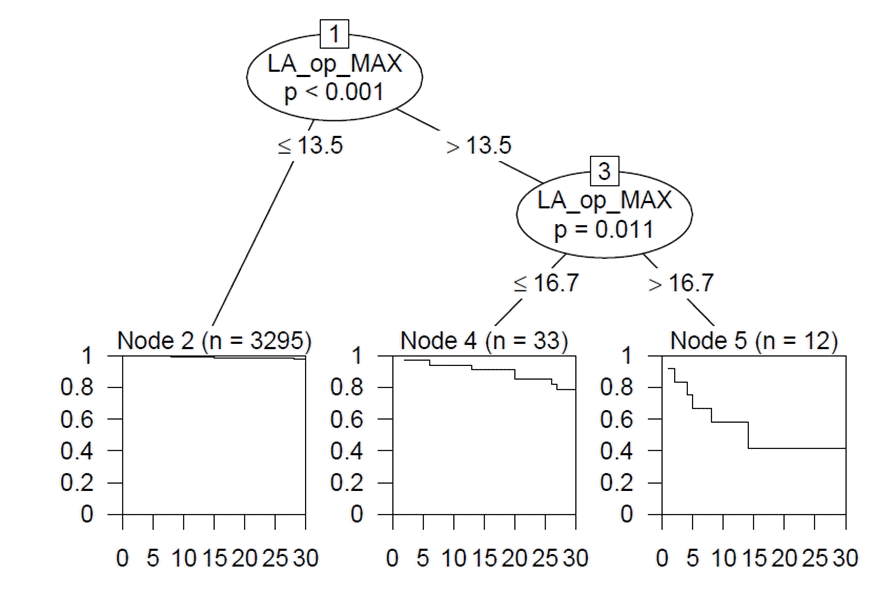
To predict 30-day all-cause mortality, tree-structured survival analysis using CART of a recursive partitioning algorithm demonstrated that intraoperative LA cutoffs of 13.5% and 16.7% were found to be optimal. In addition, maximally selected log-rank statistics of the “maxstat” R package revealed that LA cutoffs of 8.4% were the best cutoff for predicting for 90-day all-cause mortality (Fig. 3).

Application of thresholds of LA to predict early mortality

The 30-day and 90-day mortality rates were 2.5% (n = 83) and 4.7% (n = 157), respectively.
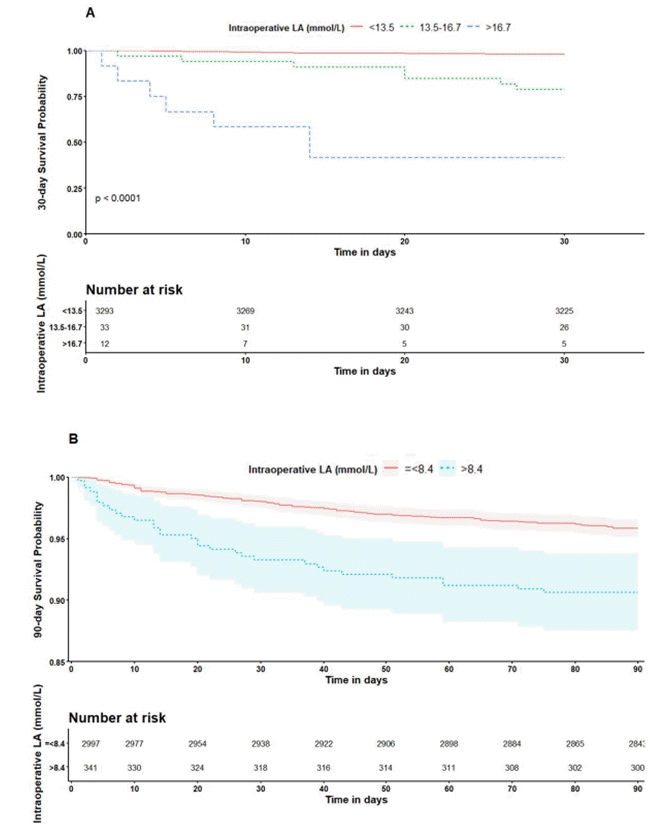
When the patients were grouped according to the best cutoff values of 8.4 mmol/L, those with LA > 8.4 mmol/L yielded a 30-day mortality rate of 6.7% and a 90-day mortality rate of 9.4% (P < 0.001) (Fig. 4). In particular, derived LA cutoffs of 16.7% and 13.5% by CART to predict 30-day mortality showed a wide separation of the KM curve. Patients with LA levels > 16.7 mmol/L and 13.5–16.7 had significantly higher 30-day mortality rates of 58.3% and 21.2%, respectively, compared to those with LA < 13.5 mmol/L, who had a 2.1% 30-day mortality rate (log-rank P < 0.001) (Fig. 4).

DISCUSSION

It has long been known that LA levels might reflect critically ill hepatic patients and are independently associated with the short-term mortality affiliated with end-stage liver disease (ESLD) [6,13,14].
In fact, the LA levels and its clearance are known predictors of the outcome of critically ill patients in the intensive care unit [15]. There has been widespread research, especially in septic patients, that evaluate the use of LA as a potential resuscitation marker or prognosticator. Therefore, the Surviving Sepsis Campaign Bundle suggested that if the initial LA is > 2 mmol/L, it should be remeasured within 2−4 h. Moreover, if the LA is > 4 mmol/L in those with sepsis, the initiation of rapid administration of > 30 ml/kg crystalloid is strongly recommended in sepsis [16].
However, lactate metabolism in cirrhosis differs substantially from that in patients without hepatic impairment. In the current study, we found that approximately 50% patients are associated with preoperative LA > 2 mmol/L, confirming that the LA level in patients with ESLD is quite different from those without ESLD. Therefore, management guidelines proposed “repeated measurement of blood lactate levels, even though the interpretation may be complicated by impaired clearance in cirrhosis” [17].
Furthermore, we found that 1,884 (56.4%) patients showed intraoperative LA > 4.0 mmol/L, and 188 (5.6%) exceeded intraoperative LA of 10 mmol/L. These rates are surprisingly high, given that LA levels > 10 mmol/L are associated with high mortality rates of 80% or more in critically ill patients [15,18]. In the current study on intraoperative LA exploration, patients with LA > 16.7 mmol/L and 13.5–16.7 mmol/L demonstrated significantly higher 30-day mortality rates of 58.3% and 21.2%, respectively.
LT is often an extremely difficult event for ESLD patients because LT recipients frequently suffer from severe hypotension, acute blood loss with extreme anemia, massive transfusion, inferior vena cava clamping, prolonged refractory hypotension with high-dose vasopressors, perturbed hemodynamics shortly after graft reperfusion, and/or pr-existing multiple organ failures, such as circulatory, respiratory, and kidney failures [12,19]. Additionally since initial grafts can poorly handle lactate load and may serve as a lactate-producing organ, intraoperative LA concentration is not only extremely high compared with preoperative LA, but also remains high regardless of increasing MELDs during LT surgery. It is thought that high intraoperative LA levels regardless of MELDs are likely to be due to the initial poor graft function and lactate-producing liver itself.
On the other hand, given that acidosis and hyperlactatemia can occur independently, hyperlactatemia might only be moderately predictive for acidosis. Both acidosis and lactate independently predicted mortality in critically ill patients suffering from sepsis [20]. Additionally, it has been reported that lactate clearance calculated at 6 h after reperfusion of an allograft was associated with the development of early allograft dysfunction and in‐hospital and 6 m mortalities after deceased donor liver transplantation [5]. In the current study, we did not evaluate the combining acidosis and hyperlactatemia and lactate clearance; therefore, further study including both of the aforementioned in a model will yield higher predictiveness of the short-term outcome in patients undergoing LT.
This study has several limitations. The enrolled patients are from the observational cohort study in a single center and retrospective observational design. Therefore, further prospective randomized control studies are warranted to validate our results. Additionally, higher LA resulted in higher mortality rates, but did not completely exclude factors other than LA. Therefore, future study is needed to consider non-LA factors in patients with LT.
In conclusion, in this large cohort LT study determining cutoff levels of intraoperative LA, patients with LA > 13.5 mmol/L showed significantly higher 30-day mortality rates, and > 8.4 mmol/L was the optimal cutoff value for the 90-day mortality. Therefore, identifying intraoperative cutoffs of LA and correction of hyperlactatemia may play a potential role in lowering early mortality rates after LT.

Notes

FUNDING

This research was supported by a grant of the Korea Health Technology R&D Project through the Korea Health Industry Development Institute (KHIDI), funded by the Ministry of Health & Welfare, Republic of Korea (grant number : HI18C2383).

CONFLICTS OF INTEREST

No potential conflict of interest relevant to this article was reported.

DATA AVAILABILITY STATEMENT

The datasets generated during and/or analyzed during the current study are available from the corresponding author on reasonable reques.

AUTHOR CONTRIBUTIONS

Conceptualization: Gyu-Sam Hwang. Data curation: Kyoung-Sun Kim. Formal analysis: Sang-Ho Lee. Methodology: Sang-Ho Lee, Bo-Hyun Sang. Writing - original draft: Kyoung-Sun Kim. Writing - review & editing: Gyu-Sam Hwang. Investigation: Sang-Ho Lee, Bo-Hyun Sang. Supervision: Bo-Hyun Sang, Gyu-Sam Hwang.

REFERENCES

1. Kraut JA, Madias NE. Lactic acidosis. N Engl J Med. 2014; 371:2309–19.
crossref
2. Jeppesen JB, Mortensen C, Bendtsen F, Møller S. Lactate metabolism in chronic liver disease. Scand J Clin Lab Invest. 2013; 73:293–9.
crossref
3. Drolz A, Horvatits T, Roedl K, Rutter K, Brunner R, Zauner C, et al. Acid-base status and its clinical implications in critically ill patients with cirrhosis, acute-on-chronic liver failure and without liver disease. Ann Intensive Care. 2018; 8:48.
crossref
4. Cardoso FS, Abraldes JG, Sy E, Ronco JJ, Bagulho L, Mcphail MJ, et al. Lactate and number of organ failures predict intensive care unit mortality in patients with acute-on-chronic liver failure. Liver Int. 2019; 39:1271–80.
crossref
5. Kim DG, Lee JY, Jung YB, Song SH, Lee JG, Han DH, et al. Clinical significance of lactate clearance for the development of early allograft dysfunction and short-term prognosis in deceased donor liver transplantation. Clin Transplant. 2017; 31:e13136.
crossref
6. Drolz A, Horvatits T, Rutter K, Landahl F, Roedl K, Meersseman P, et al. Lactate improves prediction of short-term mortality in critically ill patients with cirrhosis: a multinational study. Hepatology. 2019; 69:258–69.
crossref
7. Wu JF, Wu RY, Chen J, Ou-Yang B, Chen MY, Guan XD. Early lactate clearance as a reliable predictor of initial poor graft function after orthotopic liver transplantation. Hepatobiliary Pancreat Dis Int. 2011; 10:587–92.
crossref
8. Orii R, Sugawara Y, Hayashida M, Yamada Y, Kubota K, Takayama T, et al. Peri-operative blood lactate levels in recipients of living-related liver transplantation. Transplantation. 2000; 69:2124–7.
crossref
9. Nishimura A, Hakamada K, Narumi S, Totsuka E, Toyoki Y, Ishizawa Y, et al. Intraoperative blood lactate level as an early predictor of initial graft function in human living donor liver transplantation. Transplant Proc. 2004; 36:2246–8.
crossref
10. Laska E, Meisner M, Wanderling J. A maximally selected test of symmetry about zero. Stat Med. 2012; 31:3178–91.
crossref
11. Kwon HM, Moon YJ, Jung KW, Park YS, Kim KS, Jun IG, et al. Appraisal of cardiac ejection fraction with liver disease severity: implication in post-liver transplantation mortality. Hepatology. 2020; 71:1364–80.
crossref
12. Kwon HM, Moon YJ, Kim KS, Shin WJ, Huh IY, Jun IG, et al. Prognostic value of B-type natriuretic peptide in liver transplant patients: implication in posttransplant mortality. Hepatology. 2021; 74:336–50.
crossref
13. Sarin SK, Choudhury A, Sharma MK, Maiwall R, Al Mahtab M, Rahman S, et al. APASL ACLF Research Consortium (AARC) for APASL ACLF working Party. Acute-on-chronic liver failure: consensus recommendations of the Asian Pacific association for the study of the liver (APASL): an update. Hepatol Int. 2019; 13:353–90.
14. Gao F, Huang XL, Cai MX, Lin MT, Wang BF, Wu W, et al. Prognostic value of serum lactate kinetics in critically ill patients with cirrhosis and acute-on-chronic liver failure: a multicenter study. Aging (Albany NY). 2019; 11:4446–62.
crossref
15. Haas SA, Lange T, Saugel B, Petzoldt M, Fuhrmann V, Metschke M, et al. Severe hyperlactatemia, lactate clearance and mortality in unselected critically ill patients. Intensive Care Med. 2016; 42:202–10.
crossref
16. Levy MM, Evans LE, Rhodes A. The surviving sepsis campaign bundle: 2018 update. Intensive Care Med. 2018; 44:925–8.
crossref
17. Nadim MK, Durand F, Kellum JA, Levitsky J, O'Leary JG, Karvellas CJ, et al. Management of the critically ill patient with cirrhosis: a multidisciplinary perspective. J Hepatol. 2016; 64:717–35.
crossref
18. Nichol AD, Egi M, Pettila V, Bellomo R, French C, Hart G, et al. Relative hyperlactatemia and hospital mortality in critically ill patients: a retrospective multi-centre study. Crit Care. 2010; 14:R25.
crossref
19. Kwon HM, Hwang GS. Cardiovascular dysfunction and liver transplantation. Korean J Anesthesiol. 2018; 71:85–91.
crossref
20. Wernly B, Heramvand N, Masyuk M, Rezar R, Bruno RR, Kelm M, et al. Acidosis predicts mortality independently from hyperlactatemia in patients with sepsis. Eur J Intern Med. 2020; 76:76–81.
crossref

Fig. 1.
Distribution of preoperative and intraoperative lactic acid. Vertical line indicate median lactic acid level. LA: lactic acid.
apm-21056f1.tif
Fig. 2.
Distribution of (A) preoperative and (B) intraoperative lactic acid levels according to liver disease severity. Vertical lines indicate median lactic acid. MELDs: model for end-liver disease score.
apm-21056f2.tif
Fig. 3.
Decision tree diagram for 30-day mortality, showing intraoperative lactic acid cutoffs of 13.5 mmol/L and 16.7 mmol/L as optimal cutoffs in predicting 30-day all-cause mortality. LA: lactic acid, LA_op_MAX: lactic acid_intraoperative_maximal value.
apm-21056f3.tif
Fig. 4.
Kaplan–Meier survival plot shows 30-day mortality according to intraoperative lactic acid > 16.7 mmol/L, 13.5–16.7 mmol/L and < 13.5 mmol/L (A) 90-day mortality according to intraoperative lactic acid > 8.4 mmol/L and 8.4 ≤ mmol/L (B). LA: lactic acid.
apm-21056f4.tif
Table 1.
Patients’ Demographics according to the Intraoperative Lactic Acid Levels
Variable LA ≤ 8.4 mmol/L (n = 2,997) LA > 8.4 mmol/L (n = 341) Total (n = 3,338) P value
Demographic data
 Age (yr) 53.2 ± 9.1 54.0 ± 8.8 53.3 ± 9.0 0.123
 Sex, male 2,171 (72.4) 272 (79.8) 2,443 (73.2) 0.005
 Body mass index (kg/m2) 24.2 ± 3.7 24.8 ± 3.7 24.3 ± 3.7 0.003
 Diabetes 731 (24.4) 69 (20.2) 800 (24.0) 0.102
 Hypertension 559 (18.7) 60 (17.6) 619 (18.5) 0.688
 MELD score 18.1 ± 10.8 18.9 ± 12.0 18.2 ± 10.9 0.262
  MELDs 0.138
  MELD < 15 1,619 (54.0) 188 (55.1) 1,807 (54.1)
  MELD 15–35 1,062 (35.4) 107 (31.4) 1,169 (35.0)
  MELD > 35 316 (10.5) 46 (13.5) 362 (10.8)
Causes for liver disease
 Viral 1,874 (62.5) 231 (67.7) 2,105 (63.1) 0.067
 Alcoholic 620 (20.7) 56 (16.4) 676 (20.3) 0.074
 Biliary 99 (3.3) 4 (1.2) 103 (3.1) 0.047
 Others 543 (18.1) 57 (16.7) 600 (18.0) 0.572
 Malignancy 1,363 (45.5) 185 (54.3) 1,548 (46.4) 0.003
Comorbidities
 Fulminant hepatic failure 136 (4.5) 25 (7.3) 161 (4.8) 0.032
 Intractable ascites 951 (31.7) 96 (28.2) 1,047 (31.4) 0.198
 Hepatic encephalopathy 473 (15.8) 64 (18.8) 537 (16.1) 0.179
 Pleural effusion 401 (13.4) 41 (12.0) 442 (13.2) 0.538
 Spontaneous bacterial peritonitis 123 (4.1) 15 (4.4) 138 (4.1) 0.908
Laboratory variables
 Intraoperative 4.1 (2.9, 5.6) 10.4 (9.2, 12.2) 4.4 (3.0, 6.2) < 0.001
 Lactic acid (mmol/L)
 Hemoglobin (g/dl) 10.4 (8.9, 12.2) 10.7(9.0, 12.7) 10.4 (8.9, 12.3) 0.052
 Leukocytes (×103/µl) 3.6 (2.5, 5.3) 3.5 (2.5, 5.6) 3.6 (2.5, 5.3) 0.739
 Platelet count (×103/µl) 61 (42, 94) 60 (41, 91) 61 (42, 94) 0.786
 Total bilirubin (mg/dl) 2.1 (1.0, 9.6) 2.0 (1.8, 4.8) 2.1 (1.0, 9.8) 0.844
 Albumin (g/dl) 3.1 (2.7, 3.5) 3.1 (2.7, 3.6) 3.1 (2.7, 3.5) 0.158
 Prothrombin time (INR) 1.4 (1.2, 1.8) 1.4 (1.2, 1.9) 1.4 (1.2, 1.9) 0.507
 Creatinine (mg/dl) 0.80 (0.7, 1.0) 0.84 (0.7, 1.1) 0.80 (0.7, 1.1) 0.012
Preoperative therapy
 Vasopressor support 145(4.8) 36 (10.6) 181 (5.4) < 0.001
 Mechanical ventilation 245 (8.2) 54 (15.8) 299 (9.0) < 0.001
 Renal replacement therapy 297 (9.9) 52 (15.2) 349 (10.5) 0.003
Operative variables
 Deceased-donor 475 (15.8) 51 (15.0) 526 (15.8) 0.726
 Operation time (min) 740.8 ± 142.4 754.4 ± 140.6 742.2 ± 142.3 0.096
 Total ischemic time (min) 147.5 ± 71.7 130.5 ± 53.4 140.8 ± 65.6 < 0.001
 Transfusion
  pRBC (unit) 11.3 ± 14.1 13.1 ± 16.4 11.5 ± 14.3 0.052
  FFP (unit) 11.7 ± 14.0 12.7 ± 14.9 11.8 ± 14.1 0.193

Values are expressed as mean ± SD, number (%), or median (1Q, 3Q). LA: lactic acid, MELD score: Model for End-stage Liver Disease score, pRBC: packed red blood cells, FFP: fresh frozen plasma, INR: international normalized ratio.

TOOLS
Similar articles