Introduction
Methods
Patient selection and grouping
Endovascular treatment
Evaluation of clinical and angiographic outcomes
Statistical analysis
Results
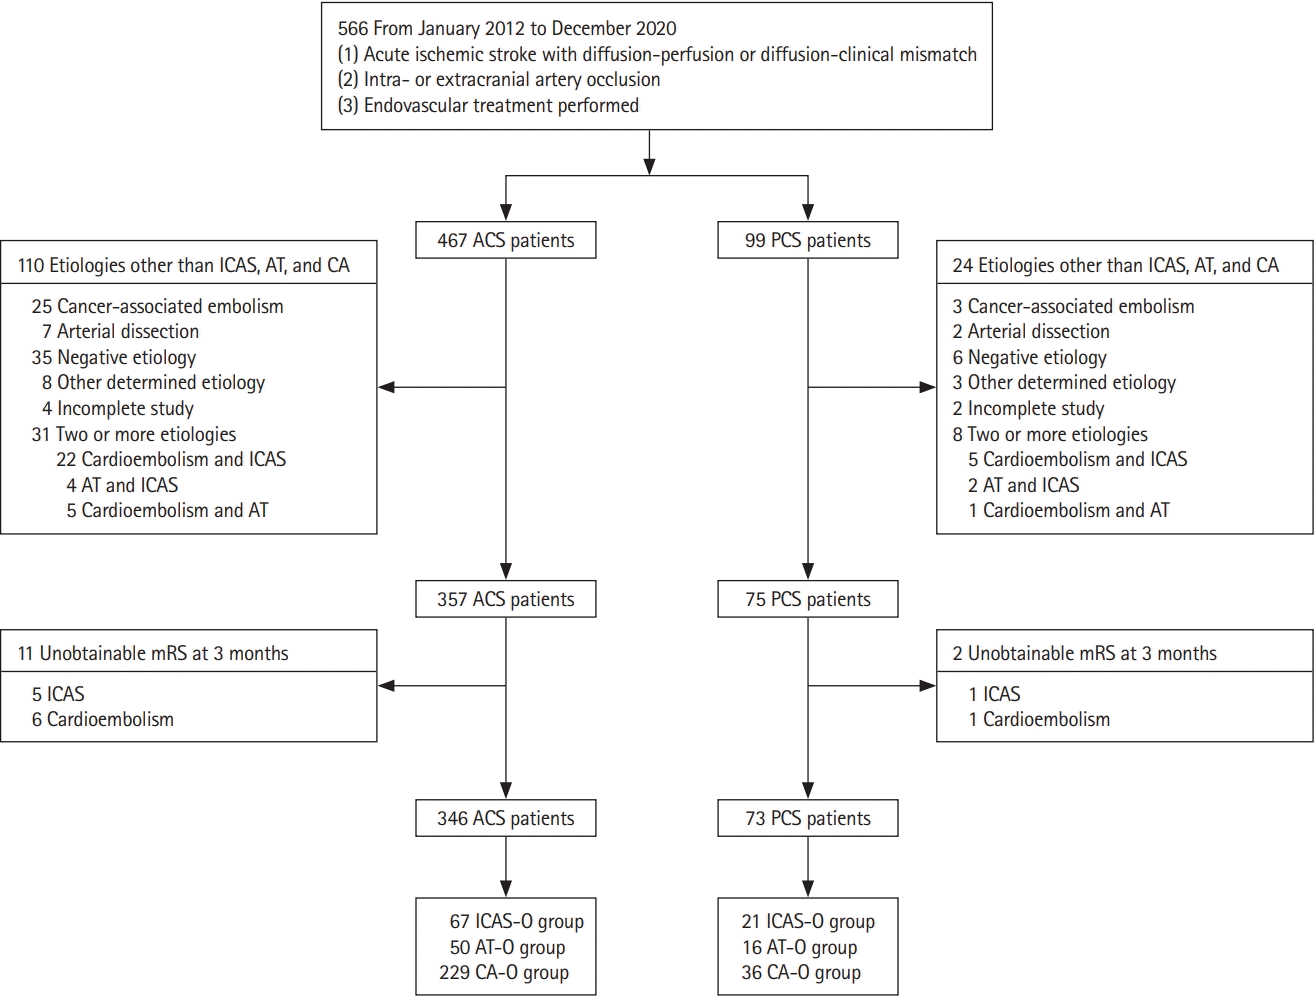
Baseline characteristics and clinical outcomes of the ACS and PCS patients
Figure 1.

Table 1.
| Characteristic | ACS (n=346) | PCS (n=73) | P |
|---|---|---|---|
| Age (yr) | 71.0 (63.8–78.0) | 67.0 (57.0–74.0) | 0.01 |
| Female sex | 136 (39.3) | 25 (34.2) | 0.42 |
| Initial NIHSS | 12.0 (8.0–16.0) | 12.0 (8.0–20.0) | 0.72 |
| Hypertension | 220 (63.6) | 49 (67.1) | 0.57 |
| Diabetes | 94 (27.2) | 18 (24.7) | 0.66 |
| Hyperlipidemia | 78 (22.5) | 24 (32.9) | 0.06 |
| Current smoker | 71 (20.5) | 18 (24.7) | 0.43 |
| Previous stroke | 71 (20.5) | 20 (27.4) | 0.20 |
| Atrial fibrillation | 195 (56.4) | 29 (39.7) | 0.01 |
| Clear onset | 184 (53.2) | 39 (53.4) | 0.97 |
| Intravenous tPA | 97 (28.0) | 19 (26.0) | 0.73 |
| Stroke etiology | 0.03 | ||
| ICAS-O | 67 (19.4) | 21 (28.8) | |
| AT-O | 50 (14.5) | 16 (21.9) | |
| CA-O | 229 (66.2) | 36 (49.3) | |
| Time variables (min) | |||
| Onset-to-door | 188.5 (50.0–501.3) | 265.0 (83.0–621.0) | 0.06 |
| Door-to-groin puncture | 144.0 (113.0–209.5) | 178.0 (133.5–281.5) | <0.01 |
| Puncture-to-recanalization | 58.0 (38.0–82.3) | 55.0 (29.0–77.0) | 0.13* |
| Onset-to-recanalization | 421.0 (263.8–825.8) | 628.0 (356.0–998.0) | 0.01† |
| Modalities of EVT | |||
| Suction thrombectomy | 180 (52.0) | 33 (45.2) | 0.30 |
| Angioplasty | 91 (26.3) | 30 (41.1) | 0.01 |
| Stent retriever | 234 (67.6) | 37 (50.7) | 0.01 |
| Stent insertion | 73 (21.1) | 26 (35.6) | 0.01‡ |
| Instant re-thrombosis | 13 (3.8) | 4 (5.5) | 0.50 |
| Tirofiban use | 13 (3.8) | 3 (4.1) | 0.75 |
| mTICI | 0.49 | ||
| mTICI 0–1 | 19 (5.5) | 1 (1.4) | |
| mTICI 2a | 14 (4.0) | 2 (2.7) | |
| mTICI 2b | 138 (39.9) | 29 (39.7) | |
| mTICI 3 | 175 (50.6) | 41 (56.2) | |
| Successful recanalization (mTICI 2b–3) | 313 (90.5) | 70 (95.9) | 0.13 |
| Recanalization in follow-up images | 296/321 (91.9) | 59/66 (89.4) | 0.50§ |
| Symptomatic ICH | 24/321 (7.5) | 1/66 (1.5) | 0.10 |
| ICH at follow-up imaging | 135/321 (42.1) | 20/66 (30.3) | 0.08 |
| Type of ICH | 0.03 | ||
| Hemorrhagic infarction 1 | 52 (38.5) | 13 (65.0) | |
| Hemorrhagic infarction 2 | 46 (34.1) | 3 (15.0) | |
| Parenchymal hemorrhage 1 | 21 (15.6) | 0 (0) | |
| Parenchymal hemorrhage 2 | 16 (11.9) | 4 (20.0) | |
| mRS 0–2 at 3 months | 148 (42.8) | 26 (35.6) | 0.26 |
| Mortality at 3 months | 23 (6.6) | 11 (15.1) | 0.02 |
Values are presented as median (interquartile range) or number (%).
ACS, anterior circulation stroke; PCS, posterior circulation stroke; NIHSS, National Institutes of Health Stroke Scale; tPA, tissue plasminogen activator; ICAS-O, intracranial arterial steno-occlusion; AT-O, artery-to-artery embolic occlusion; CA-O, cardioembolic occlusion; EVT, endovascular treatment; mTICI, modified thrombolysis in cerebral infarction; ICH, intracerebral hemorrhage; mRS, modified Rankin Scale.
*, † Puncture-to-recanalization time and onset-to-recanalization time were calculated in patients for whom successful recanalization was achieved;
Baseline characteristics of ACS and PCS patients according to etiology
Table 2.
| Characteristic |
ICAS-O (n=88) |
AT-O (n=66) |
CA-O (n=265) |
|||||||
|---|---|---|---|---|---|---|---|---|---|---|
| ACS (n=67) | PCS (n=21) | P | ACS (n=50) | PCS (n=16) | P | ACS (n=229) | PCS (n=36) | P | ||
| Age (yr) | 65.5 (61.0–74.0) | 68.0 (56.0–73.5) | 0.86 | 68.5 (63.3–73.0) | 62.5 (57.0–71.0) | 0.20 | 74.0 (65.0–79.0) | 69.0 (60.5–77.8) | 0.06 | |
| Female sex | 13 (19.4) | 3 (14.3) | 0.75 | 6 (12.0) | 2 (12.5) | >0.99 | 117 (51.1) | 20 (55.6) | 0.62 | |
| Initial NIHSS | 9.0 (6.0–13.0) | 10.0 (9.0–17.0) | 0.06 | 10.0 (8.0–12.3) | 10.5 (5.5–20.5) | 0.70 | 14.0 (10.0–17.0) | 13.0 (7.0–22.0) | 0.94 | |
| Hypertension | 47 (70.1) | 18 (85.7) | 0.16 | 27 (54.0) | 10 (62.5) | 0.55 | 146 (63.8) | 21 (58.3) | 0.53 | |
| Diabetes | 20 (29.9) | 4 (19.0) | 0.33 | 15 (30.0) | 8 (50.0) | 0.14 | 59 (25.8) | 6 (16.7) | 0.24 | |
| Hyperlipidemia | 16 (23.9) | 9 (42.9) | 0.10 | 11 (22.0) | 6 (37.5) | 0.32 | 51 (22.3) | 9 (25.0) | 0.72 | |
| Current smoker | 26 (38.8) | 7 (33.3) | 0.65 | 24 (48.0) | 6 (37.5) | 0.46 | 21 (9.2) | 5 (13.9) | 0.38 | |
| Previous stroke | 13 (19.4) | 5 (23.8) | 0.76 | 9 (18.0) | 8 (50.0) | 0.02 | 49 (21.4) | 7 (19.4) | 0.79 | |
| Atrial fibrillation | 0 (0) | 0 (0) | NA | 0 (0) | 0 (0) | NA | 195 (85.2) | 29 (80.6) | 0.48 | |
| Clear onset | 32 (47.8) | 14 (66.7) | 0.13 | 28 (56.0) | 9 (56.3) | >0.99 | 124 (54.1) | 16 (44.4) | 0.28 | |
| Intravenous tPA | 12 (17.9) | 6 (28.6) | 0.35 | 13 (26.0) | 3 (18.8) | 0.74 | 72 (31.4) | 10 (27.8) | 0.66 | |
| Time variables (min) | ||||||||||
| Onset-to-door | 505.0 (155.0–1,177.0) | 328.0 (190.0–573.0) | 0.23 | 274.0 (132.5–752.3) | 407.0 (156.5–861.8) | 0.45 | 120.0 (36.5–354.0) | 207.0 (40.0–510.0) | 0.14 | |
| Door-to-groin puncture | 212.0 (149.0–596.0) | 172.0 (129.0–238.0) | 0.09 | 156.5 (123.5–313.8) | 174.0 (135.0–376.3) | 0.43 | 132.0 (110.0–178.0) | 179.0 (133.5–276.3) | <0.01 | |
| Puncture-to-recanalization | 73.0 (57.0–94.0) | 72.0 (52.0–93.5) | 0.75* | 61.5 (45.5–96.0) | 62.0 (49.0–82.5) | 0.80* | 51.0 (36.0–70.5) | 36.5 (23.3–61.5) | <0.01* | |
| Onset-to-recanalization | 950.0 (528.0–1,960.0) | 659.0 (427.5–930.5) | 0.07† | 559.5 (320.5–1,351.5) | 973.0 (481.0–2,679.0) | 0.11† | 346.0 (237.5–571.0) | 511.5 (234.8–958.8) | 0.06† | |
| Modalities of EVT | ||||||||||
| Suction thrombectomy | 18 (26.9) | 3 (14.3) | 0.38 | 27 (54.0) | 6 (37.5) | 0.25 | 135 (59.0) | 24 (66.7) | 0.38 | |
| Angioplasty | 43 (64.2) | 17 (81.0) | 0.15 | 38 (76.0) | 12 (75.0) | >0.99 | 10 (4.4) | 1 (2.8) | >0.99 | |
| Stent retriever | 35 (52.2) | 8 (38.1) | 0.26 | 32 (64.0) | 11 (68.8) | 0.73 | 167 (72.9) | 18 (50.0) | 0.01 | |
| Stent insertion | 32 (47.8) | 13 (61.9) | 0.32‡ | 29 (58.0) | 11 (68.8) | 0.44‡ | 12 (5.2) | 2 (5.6) | >0.99‡ | |
| Instant re-thrombosis | 7 (10.4) | 4 (19.0) | 0.29 | 5 (10.0) | 0 (0.0) | 0.33 | 1 (0.4) | 0 (0) | >0.99 | |
| Tirofiban use | 7 (10.4) | 3 (14.3) | 0.70 | 4 (8.0) | 0 (0.0) | 0.57 | 2 (0.9) | 0 (0) | >0.99 | |
| mTICI | 0.27 | 0.18 | 0.38 | |||||||
| mTICI 0–1 | 1 (1.5) | 0 (0) | 2 (4.0) | 1 (6.3) | 16 (7.0) | 0 (0) | ||||
| mTICI 2a | 4 (6.0) | 0 (0) | 0 (0) | 1 (6.3) | 10 (4.4) | 1 (2.8) | ||||
| mTICI 2b | 15 (22.4) | 9 (42.9) | 26 (52.0) | 5 (31.3) | 97 (42.4) | 15 (41.7) | ||||
| mTICI 3 | 47 (70.1) | 12 (57.1) | 22 (44.0) | 9 (56.3) | 106 (46.3) | 20 (55.6) | ||||
| Successful recanalization (mTICI ≥2b–3) | 62 (92.5) | 21 (100.0) | 0.33 | 48 (96.0) | 14 (87.5) | 0.25 | 203 (88.6) | 35 (97.2) | 0.14 | |
| Recanalization in follow-up imaging | 55/62 (87.3) | 16/20 (80.0) | 0.45§ | 43/46 (93.5) | 11/14 (78.6) | 0.13§ | 198/213 (93.0) | 32/32 (100.0) | 0.23§ | |
| Symptomatic ICH | 2/62 (3.2) | 0/20 (0.0) | >0.99 | 2/46 (4.3) | 0/14 (0.0) | >0.99 | 20/213 (9.4) | 1/32 (3.1) | 0.33 | |
| ICH at follow-up imaging | 14/62 (22.6) | 3/20 (15.0) | 0.55 | 18/46 (39.1) | 4/14 (28.6) | 0.47 | 103/213 (48.4) | 13/32 (40.6) | 0.99 | |
| Types of ICH | 0.48 | 0.69 | 0.10 | |||||||
| HI-1 | 6 (42.9) | 3 (100.0) | 7 (38.9) | 3 (75.0) | 39 (37.9) | 7 (53.8) | ||||
| HI-2 | 5 (35.7) | 0 (0) | 7 (38.9) | 1 (25.0) | 34 (33.0) | 2 (15.4) | ||||
| PH-1 | 2 (14.3) | 0 (0) | 3 (16.7) | 0 (0) | 16 (15.5) | 0 (0) | ||||
| PH-2 | 1 (7.1) | 0 (0) | 1 (5.6) | 0 (0) | 14 (13.6) | 4 (30.8) | ||||
| mRS 0–2 at 3 months | 35 (52.2) | 7 (33.3) | 0.13 | 24 (48.0) | 7 (43.8) | 0.77 | 89 (38.9) | 12 (33.3) | 0.53 | |
| Mortality at 3 months | 2 (3.0) | 3 (14.3) | 0.09 | 3 (6.0) | 1 (6.3) | >0.99 | 18 (7.9) | 7 (19.4) | 0.06 | |
Values are presented as median (interquartile range) or number (%).
ICAS-O, intracranial arterial steno-occlusion; AT-O, artery-to-artery embolic occlusion; CA-O, cardioembolic occlusion; NIHSS, National Institutes of Health Stroke Scale; ACS, anterior circulation stroke; PCS, posterior circulation stroke; NA, not applicable; tPA, tissue plasminogen activator; EVT, endovascular treatment; mTICI, modified thrombolysis in cerebral infarction; ICH, intracerebral hemorrhage; HI, hemorrhagic infarction; PH, parenchymal hemorrhage; mRS, modified Rankin Scale.
*, † Puncture-to-recanalization time and onset-to-recanalization time were calculated in patients for whom successful recanalization was achieved;
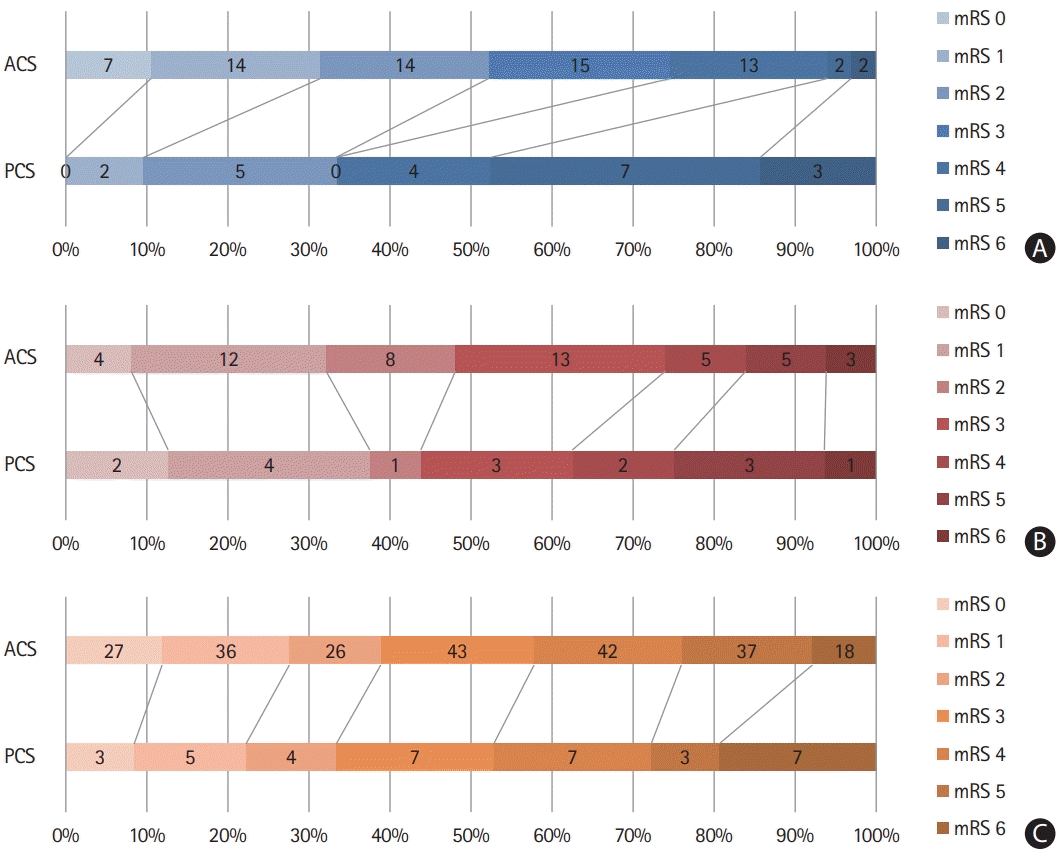
Procedural and clinical outcomes of ACS and PCS patients according to etiology
Figure 2.

Baseline characteristics, and procedural and clinical outcomes of ACS patients according to etiology
Baseline characteristics, and procedural and clinical outcomes of PCS patients according to etiology
Factors related to favorable clinical outcomes
Table 3.
mRS, modified Rankin Scale; CI, confidence interval; ACS, anterior circulation stroke; NIHSS, National Institutes of Health Stroke Scale; ICA, internal carotid artery; mTICI, modified thrombolysis in cerebral infarction; ICH, intracerebral hemorrhage; CA-O, cardioembolic occlusion; AT-O, artery-to-artery embolic occlusion; ICAS-O, intracranial arterial steno-occlusion; PCS, posterior circulation stroke; NA, not applicable.


 PDF
PDF Citation
 Print
Print


 XML Download