Journal List > J Stroke > v.24(2) > 1516078200

This article has been corrected. See "Global Impact of the COVID-19 Pandemic on Cerebral Venous Thrombosis and Mortality" in Volume 26 on page 129.
Nguyen, Qureshi, Klein, Yamagami, Abdalkader, Mikulik, Sathya, Mansour, Czlonkowska, Lo, Field, Charidimou, Banerjee, Yaghi, Siegler, Sedova, Kwan, de Sousa, Demeestere, Inoa, Omran, Zhang, Michel, Strambo, Marto, Nogueira, and SVIN COVID-19 Global COVID Stroke Registry: Global Impact of the COVID-19 Pandemic on Cerebral Venous Thrombosis and Mortality

Abstract

Background and Purpose

Recent studies suggested an increased incidence of cerebral venous thrombosis (CVT) during the coronavirus disease 2019 (COVID-19) pandemic. We evaluated the volume of CVT hospitalization and in-hospital mortality during the 1st year of the COVID-19 pandemic compared to the preceding year.

Methods

We conducted a cross-sectional retrospective study of 171 stroke centers from 49 countries. We recorded COVID-19 admission volumes, CVT hospitalization, and CVT in-hospital mortality from January 1, 2019, to May 31, 2021. CVT diagnoses were identified by International Classification of Disease-10 (ICD-10) codes or stroke databases. We additionally sought to compare the same metrics in the first 5 months of 2021 compared to the corresponding months in 2019 and 2020 (ClinicalTrials.gov Identifier: NCT04934020).

Results

There were 2,313 CVT admissions across the 1-year pre-pandemic (2019) and pandemic year (2020); no differences in CVT volume or CVT mortality were observed. During the first 5 months of 2021, there was an increase in CVT volumes compared to 2019 (27.5%; 95% confidence interval [CI], 24.2 to 32.0; P<0.0001) and 2020 (41.4%; 95% CI, 37.0 to 46.0; P<0.0001). A COVID-19 diagnosis was present in 7.6% (132/1,738) of CVT hospitalizations. CVT was present in 0.04% (103/292,080) of COVID-19 hospitalizations. During the first pandemic year, CVT mortality was higher in patients who were COVID positive compared to COVID negative patients (8/53 [15.0%] vs. 41/910 [4.5%], P=0.004). There was an increase in CVT mortality during the first 5 months of pandemic years 2020 and 2021 compared to the first 5 months of the pre-pandemic year 2019 (2019 vs. 2020: 2.26% vs. 4.74%, P=0.05; 2019 vs. 2021: 2.26% vs. 4.99%, P=0.03). In the first 5 months of 2021, there were 26 cases of vaccine-induced immune thrombotic thrombocytopenia (VITT), resulting in six deaths.

Conclusions

During the 1st year of the COVID-19 pandemic, CVT hospitalization volume and CVT in-hospital mortality did not change compared to the prior year. COVID-19 diagnosis was associated with higher CVT in-hospital mortality. During the first 5 months of 2021, there was an increase in CVT hospitalization volume and increase in CVT-related mortality, partially attributable to VITT.

Introduction

Since the first case in December 2019, coronavirus disease 2019 (COVID-19) has been responsible for more than 340 million infections and over 5.5 million deaths [1]. Though most of the morbidity and mortality associated with COVID-19 is related to pulmonary complications, the disease has had wide-ranging systemic effects, including a range of neurological manifestations [2,3] and disruption of coagulation homeostasis [4-7]. This disruption in normal coagulation may trigger abnormal clotting events such as venous thromboembolism and stroke [8-10].
Cerebral venous thrombosis (CVT) is a rare cause of stroke caused by the formation of clots in the brain’s venous system. The incidence of CVT has been reported to increase over the last decade, either from changing risk factors or improved detection [11-13]. Compared to other forms of stroke, the incidence of CVT is more common in younger patients and women. CVT generally has a favorable prognosis with a good 90-day neurological outcome seen in greater than 80% of patients [14-16].
Several regional and multicenter reports described an increase in the incidence of CVT and severity of CVT during the COVID-19 pandemic [6,17]. In February of 2021, reports emerged of CVT following COVID-19 vaccination with adenovirus-based vaccines. In these patients, a syndrome characterized by thrombosis, thrombocytopenia,18 and antibodies to platelet factor 4 were observed and the syndrome was termed vaccine-induced immune thrombotic thrombocytopenia (VITT) [19-21]. Whereas the relative changes in stroke [22-26] and subarachnoid hemorrhage volumes [27] have been described during the first wave of the COVID-19 pandemic, the low incidence of CVT has limited studies during the COVID-19 pandemic. At present, there is insufficient data to determine whether CVT incidence or mortality changed during the COVID-19 pandemic.
The primary objectives of this study were to evaluate changes in the volume of CVT hospitalizations and CVT in-hospital mortality during the 1st year of the COVID-19 pandemic (January 1, 2020, to February 28, 2021) compared to the preceding year (January 1, 2019, to February 29, 2020), adjusting for the beginning of the pandemic month in each country. The secondary objective of this study was to examine the association between the volume of COVID-19 admissions and the volume of CVT hospitalizations. An additional objective of this study was to evaluate whether CVT in COVID-19 positive patients was associated with increased risk of in-hospital mortality in the 1st year of the pandemic.

Methods

Hypothesis

Our primary hypothesis was that there would be an increase in the rate of CVT hospitalizations or CVT in-hospital mortality between the 1st year of the COVID-19 pandemic and the preceding year. Our secondary hypothesis was that there would be no association between the burden of COVID-19 admissions and CVT hospitalizations. Furthermore, given the higher mortality observed in ischemic stroke patients with COVID-19 [28], we hypothesized that CVT hospitalization in a COVID-19 patient would confer a higher risk of mortality compared to a patient without COVID-19.

Study design

We conducted a cross-sectional study evaluating the monthly volumes and mortality of consecutive patients hospitalized with a diagnosis of CVT or COVID-19 from January 1, 2019 to May 31, 2021. Case ascertainment was verified by a physician, stroke, or research coordinator at each site. This study followed the Strengthening the Reporting of Observational Studies in Epidemiology (STROBE) reporting guideline (Supplementary Table 1).

Setting and participants

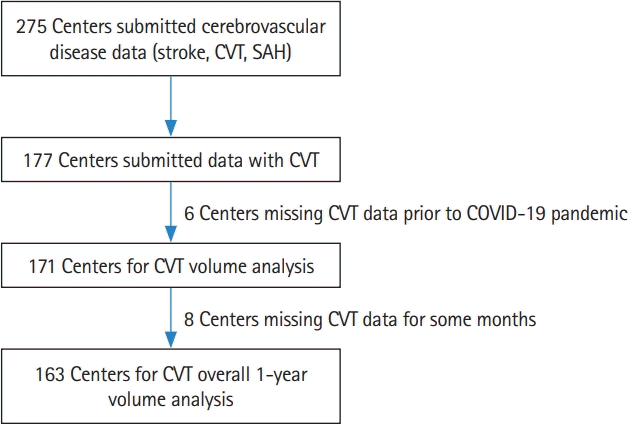
Data were collected from collaborators of the Society of Vascular and Interventional Neurology, the European Stroke Organization, the Middle East North Africa Stroke and Interventional Neurotherapies Organization, the Japan Society of Vascular and Interventional Neurology, the Latin America Stroke Group, and additional academic partners. Of 450 centers invited to participate in this global study of the impact of COVID-19 on cerebrovascular disease (including stroke, CVT, and subarachnoid hemorrhage), data were received from 275 centers. Of these 275 centers, 177 centers submitted data related to CVT. There were six centers with missing data prior to the COVID-19 pandemic, yielding 171 centers across six continents and 49 countries for the CVT analysis. For some months, there was missing CVT data from eight centers, yielding 163 centers for the 1-year volume comparative analysis (Figure 1). The study size was based on the number of submitted cases with complete data for each variable.
Comprehensive stroke centers (CSC) were defined by the availability of mechanical thrombectomy for ischemic stroke on January 1, 2019. All other centers were defined as primary stroke centers (PSC). Centers were divided into tertiles (low, intermediate, high) by COVID-19 monthly hospitalization volume (Supplementary Table 2).
The start date of the pandemic in each country was determined as the date of the first reported case of COVID-19 (Supplementary Table 3). We defined the second wave of the COVID-19 pandemic using a minimum doubling of case volume following a >50% decline in case volume from the previous wave’s peak. The start date for this occurrence was chosen as the case volume minimum closest to the second wave (Supplementary Table 3) [29]. The study’s primary data collection was conducted between May 1, 2021 and September 15, 2021. Follow-up queries to sites were completed by January 1, 2022.

Study variables and outcome measures

We collected monthly CVT hospitalization volume, CVT in-hospital mortality, and COVID-19 hospitalization volume. For patients hospitalized with CVT, the diagnosis had to be confirmed by neuroimaging with computed tomography venogram or magnetic resonance venogram. We recorded whether the CVT patient had concomitant COVID-19; we also collected thrombocytopenia status. CVT hospitalizations were identified using International Classification of Disease-10 (ICD-10) codes or prospectively maintained stroke databases. The following ICD-10 codes were used: G08 (intracranial phlebitis and thrombophlebitis), I63.6 (cerebral infarction due to CVT, nonpyogenic), I67.6 (nonpyogenic thrombosis of intracranial venous system), O22.5 (CVT in pregnancy). COVID-19 hospitalization was defined as any patient admitted with COVID-19 diagnosis to a participating center, including those without any neurologic diagnosis, utilizing ICD-10 code U07.1. Cases of confirmed or probable VITT were identified using the American Society of Hematology definitive diagnostic criteria [30]. Confirmed cases met all five criteria and probable cases met clinical criteria with incomplete laboratory testing.

Standard protocol approvals, registrations, and patient consents

This was an investigator-initiated study. The Institutional Review Boards (IRBs) from the coordinating sites (Emory University and Boston Medical Center) considered that the investigators did not have access to protected health information in this follow-up study, and thus no IRB oversight was required since the study did not meet the United States federal description of human subject research. Investigators sought local IRB or ethics approval when required by local regulations. Informed consent was waived because of the retrospective nature of this study and because the research was considered no more than minimal risk. The study was registered under NCT04934020.

Bias

Data verification was conducted by the lead author (T.N.N.) following submission by sites. In order to fully capture volume and mortality data, data collection was completed more than 3 months after the last date of patient inclusion to avoid incomplete data bias with any lag in data reporting. Centers contributing data within a stroke network were instructed to include transfer patients from the site of initial evaluation only. In nations with either consistently high COVID-19 case volumes or consistently near-zero case volumes, pandemic waves were obscured and not well captured.

Statistical analysis

We compared percentage change in the absolute number of CVT admissions for the following periods: (1) before and during the COVID-19 pandemic and (2) first 5 months of 2019 vs. 2020, 2019 vs. 2021, and 2020 vs. 2021. The 95% confidence intervals (CIs) for percentage change were calculated using the Wilson procedure without correction for continuity. The differences in admissions across the two periods were assessed for significance using the Poisson means test. The analysis was repeated by stroke center (primary or comprehensive) and hospital COVID-19 volume (low, intermediate, or high). The relative percentage decrease in volume between different categories (for example, low vs. intermediate hospital volume) was tested using the z-test of proportion.
In addition to absolute volume analysis, we also compared average monthly volumes (admissions/month) of CVT admissions for the aforementioned periods. The data were analyzed in a mixed design using a repeated-measures analysis of variance (PROC MIXED analysis in SAS) accounting for the paired data structure and potential covariates. The unstructured matrix was the best fit and used for the analyses. The monthly hospital volume analysis was adjusted for the date of peak COVID-19 volume for each country, the start date of the second wave, and the continent. Estimated marginal means were calculated using the least square means (LSMEANS) statement in PROC MIXED. Like the overall volume analysis, monthly volume analysis was stratified by stroke center and COVID-19 volume.
Finally, we compared CVT in-hospital mortality rate (CVT mortality/CVT admissions) before and during the COVID-19 pandemic and for the first 5 months of 2019, 2020, and 2021 using the chi-square test. The difference in in-hospital mortality in CVT patients with or without concomitant COVID-19 was also tested using the chi-square test. All data were analyzed using SAS version 9.4 (SAS Institute Inc., Cary, NC, USA), and the significance level was set at a P-value of <0.05.

Data availability

Data are available upon reasonable request to the corresponding author.

Results

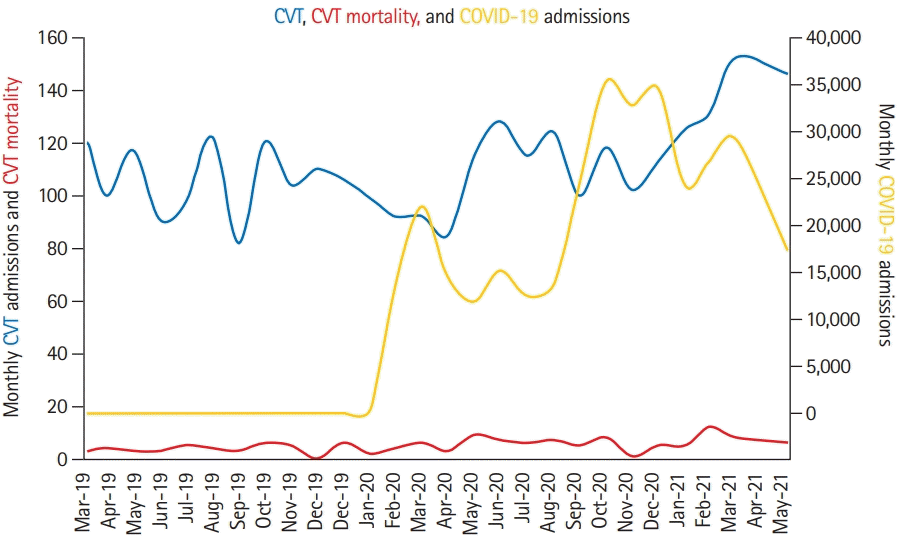
Across the study period from January 1, 2019 to May 31, 2021, there were 3,210 CVT hospitalizations and 329,042 COVID-19 admissions across 171 centers. During the 1st year of the COVID-19 pandemic from January 1, 2020, to February 28, 2021 (adjusting for the month in which the pandemic began in each country), there were 217,560 COVID-19 hospitalizations across 154 of 171 centers that submitted CVT and COVID data. There were 2,313 CVT admissions across the pandemic and pre-pandemic years (Table 1 and Figure 2).

CVT hospitalization volume

Over the 1 year of the COVID-19 pandemic, there was no difference in overall CVT hospitalization volume compared to the prior year (pre-pandemic 1,139 vs. pandemic 1,174; 3.1%; 95% CI, 2.2 to 4.2; P=0.47). No difference was observed in overall monthly volume before and during the COVID-19 pandemic (0.60 vs. 0.61, P=0.97), adjusting for the date of peak COVID-19 cases by country, date of the start of the second wave, and continent. Across subgroups of PSC versus CSC, COVID-19 hospitalization tertiles, there was no difference in overall or monthly CVT volume. However, the increase in CVT hospitalization volume at PSC was greater than at CSC (13.9% vs. 0.7%, P<0.0001) (Table 1).
During the first wave of the pandemic in 2020, there was a decrease in CVT monthly adjusted volumes when comparing the first 5 months of 2020 to the first 5 months of 2019 (0.65 vs. 0.55, P=0.03). For the overall 5-month volume, absolute declines were observed in all subgroups but were non-significant (Supplementary Table 4). In contrast, during the first 5 months of 2021, there was a significant increase in overall CVT volumes compared to the first 5 months of both 2019 (27.5%; 95% CI, 24.2 to 32.0; P<0.0001) (Supplementary Table 5) and 2020 (41.4%; 95% CI, 37.0 to 46.0; P<0.0001) (Supplementary Table 6). When comparing 2021 to 2020, significantly increased overall volumes were observed across all subgroups with no differences between subgroups. When comparing 2021 to 2019, increased CVT volumes were observed at CSC (31.3%; 95% CI, 26.8 to 36.1; P<0.0001) but not at PSC (14.9%; 95% CI, 9.5 to 22.6; P=0.28).

CVT mortality

A hundred and forty centers provided mortality data, among which 138 had complete information on CVT admissions. The in-hospital mortality rate was 3.46% (35/1,013) among CVT admissions in the year pre-pandemic compared to 4.82% (50/1,037) among CVT admissions during the first pandemic year, representing a non-significant change in mortality during the pandemic (P=0.12). No significant differences were observed within or between any subgroup (Table 2).
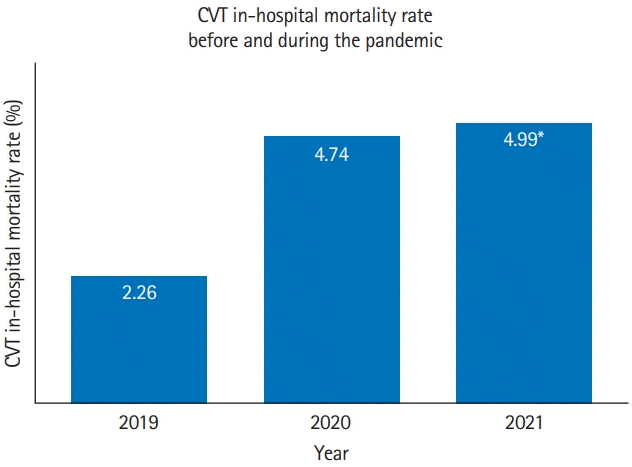
There was a statistically significant increase in CVT mortality during the first 5 months of pandemic years 2020 and 2021 when compared to the first 5 months of the pre-pandemic year 2019 (2019 vs. 2020: 2.26% vs. 4.74%, P=0.05; 2019 vs. 2021: 2.26% vs. 4.99%, P=0.03) (Figure 3). However, no difference in CVT mortality was noted between the first 5 months of the 2020 and 2021 (first 2 pandemic years).
During the initial 5 months of 2021, we identified 26 (18 confirmed, eight probable cases) of VITT, resulting in six deaths (three confirmed VITT, three probable VITT) at a case fatality rate of 23.08%. Excluding the VITT cases, the CVT mortality rate during the first 5 months of 2021 dropped from 4.99% to 4.04% (P=0.12) (Figure 3), resulting in a non-significant difference in CVT-related mortality between these months and the corresponding months of the pre-pandemic year.

CVT and COVID-19 diagnosis

There were 163 centers that reported CVT patients with concomitant COVID-19 diagnoses. During the first pandemic year through May 2021, COVID-19 diagnosis with CVT admission was present in 7.6% (132/1,738) of patients with continental variation: Africa 25.0% (13/52), Asia 5.5% (28/511), North America 3.0% (15/509), South America 13.4% (15/112), and Oceania 0% (0/25) (Supplementary Table 7). There were 154 centers that reported COVID-19 and CVT hospitalization. Of 292,080 COVID-19 hospitalizations, CVT was present in 103 patients (0.04%) (Supplementary Table 8).

CVT mortality and COVID

During the first 12 months of the pandemic, adjusted for the starting month of the pandemic by country, 120 centers from 41 countries reported CVT and COVID-19 incidence rates, and CVT mortality. There were 963 CVT patients in the 1st year of the COVID-19 pandemic, of which 910 were COVID-19 negative, and 53 had COVID-19. CVT mortality was higher in the COVID-19 patients compared to COVID-19 negative group (8/53 [15%] vs. 41/910 [4.5%], P=0.004) (Supplementary Table 9).

Discussion

In this large, multinational longitudinal cross-sectional study, we observed no significant differences in CVT volume or CVT in-hospital mortality overall, or any subgroup, between the 1st year of the COVID-19 pandemic compared to the prior year. In contrast, higher CVT in-hospital mortality was noted during the first 5 months of the pandemic for 2020 and 2021 than the equivalent months in 2019. During the 1st year of the pandemic, patients with CVT who were COVID positive had higher in-hospital mortality than COVID negative patients. Differences in the year-over-year CVT volume and mortality were observed between comprehensive and PSC. PSC had greater absolute increases for CVT volume than CSC.
No difference in CVT volume was observed between the 1st year of the pandemic, the first 5 months of the pandemic, and the prior year equivalent period. However, reduced volumes have been observed in other forms of stroke over the same time period [31,32]. In this context, the preservation of CVT volumes may represent a relative increase in CVT incidence, masked by decreased patient presentations for stroke overall. Moreover, the increase in CVT in-hospital mortality during the first 5 months of the COVID-19 pandemic may suggest that patients with milder CVT did not present to stroke centers during the COVID-19 pandemic. Since more than 80% of patients with CVT will have a favorable neurological outcome [14], patients with milder CVT and particularly those with isolated headache may have been less likely to present in a delayed fashion for persisting deficits and may have been missed altogether.
In order to evaluate differences between the early stage of the pandemic, later stages of the pandemic, and pre-pandemic, we compared the first 5 months of 2019, 2020, and 2021. When comparing 2019 to 2020, monthly adjusted CVT volumes decreased though overall 5-month volumes were not significantly decreased and CVT in-hospital mortality was increased. During the early stage of the pandemic, the decrease in CVT volume was similar in magnitude to that seen for overall stroke volume decline in the first wave or first 4 months of the COVID-19 pandemic [23]. The observation of significantly decreased CVT volumes during the initial months of 2020 but unchanged volumes for the entire year suggests differential presentation of CVT patients during the early stage of the pandemic.
An increase in CVT in-hospital mortality was observed in the first 5 months of 2020 as compared to the equivalent pre-pandemic period in 2019 (2.26% vs. 4.74%, P=0.05), which may be attributed to concomitant COVID infection during the pandemic (Supplementary Table 7) or a higher severity of CVT disease presentation during the initial pandemic months. The large increase in diagnosis and CVT in-hospital mortality during the first 5 months of 2021 suggests a substantially different patient population compared to previous years. This difference is likely explained by increased vigilance by both the public and medical community following the discovery of VITT. One single-center study reported a 262% increase in non-invasive venograms performed during the 3 weeks following the Ad.26. COV2.S vaccine administration pause in the United States compared to the same period in previous years and that patients were less likely to have classic symptoms of CVT [33].
During the initial months of 2021, we identified 26 confirmed or probable cases of VITT, resulting in six deaths, a case fatality rate of 23%. Excluding cases of confirmed or probable VITT, the case fatality rate of CVT during the first 5 months of 2021 dropped from 4.99% to 4.04%, suggesting VITT is an important factor contributing to the overall rise in CVT mortality during the first 5 months of 2021.
Our results contrast with previous studies indicating a potential increase in both CVT volume and mortality [34] during the COVID-19 pandemic. These previous studies were smaller, focused on patients with COVID-19 and concomitant CVT [9,17,35,36], and captured fewer CVT events than were observed in our study. The low incidence of CVT and lack of a control group of CVT patients prior to the pandemic limit the scope of prior studies. The lack of statistical significance in the mortality outcome of this study, despite a nearly 40% absolute increase, underscores the difficulty in studying CVT given its overall rarity. Additionally, we observed no difference in monthly CVT volumes during the COVID-19 pandemic when adjusting for the continent, COVID-19 volumes, and wave start dates. A previous large study of electronic health record data found an increase in CVT rates among those with COVID-19 infection compared to matched cohorts who had either received an mRNA vaccine or had an influenza infection. However, that study captured nearly 100 times fewer CVT events (23 vs. 2,274) and it is unclear whether the included population is representative [37].
During the 1st year of the pandemic, among patients with CVT and COVID-19, we noted a higher in-hospital mortality rate than patients who were COVID negative (15% vs. 4.5%, P=0.004). While we could not control for confounding factors, this relationship may be biologically plausible given that concomitant COVID-19 infection has been well documented to be associated with higher mortality in ischemic stroke patients [38,39]. To our knowledge, this is the first study to demonstrate the relationship between COVID-19 and increased CVT in-hospital mortality across a large, multinational CVT cohort.
While our study demonstrated no differences in CVT volumes or mortality during the 1st year of the COVID-19 pandemic in a large multinational sample, we drew our sample only from stroke centers. Diagnosis of CVT requires advanced imaging, and the availability of such imaging is country and center-dependent [40,41]. Any shift of patients towards presenting at non-stroke-centers is likely to lead to reduced CVT diagnosis. Due to the cross-sectional nature of this study, we were limited in our ability to investigate patient-level data. As a result, we cannot determine changes in CVT severity between time periods that did not result in a mortality difference. Further research is necessary to investigate any changes in the clinical characteristics of CVT during the COVID-19 pandemic.

Conclusions

No differences in CVT volume or mortality were observed during the 1st year of the COVID-19 pandemic compared to the prior year. During the 1st year of the pandemic, there was higher in-hospital mortality in patients with CVT who were COVID positive compared to COVID negative. A non-significant absolute increase in mortality may be attributable to the emergence of VITT and differences in patient presentation patterns during the pandemic.

Supplementary materials

Supplementary materials related to this article can be found online at https://doi.org/10.5853/jos.2022.00752.
Supplementary Table 1.
STROBE Statement—checklist of items that should be included in reports of observational studies
jos-2022-00752-suppl1.pdf
Supplementary Table 2.
Threshold values for monthly volume tertiles for COVID-19 admissions
jos-2022-00752-suppl2.pdf
Supplementary Table 3.
Timeline of first reported cases, 1st wave peak, and 2nd wave peak by country
jos-2022-00752-suppl2.pdf
Supplementary Table 4.
Cerebral venous thrombosis admissions; overall and monthly volumes first 5 months: 2019 vs. 2020
jos-2022-00752-suppl2.pdf
Supplementary Table 5.
Cerebral venous thrombosis admissions; overall and monthly volumes first 5 months: 2019 vs. 2021
jos-2022-00752-suppl3.pdf
Supplementary Table 6.
Cerebral venous thrombosis admissions; overall and monthly volumes first 5 months: 2020 vs. 2021
jos-2022-00752-suppl3.pdf
Supplementary Table 7.
Rates of concomitant COVID-19 with CVT admissions
jos-2022-00752-suppl3.pdf
Supplementary Table 8.
The proportion of patients hospitalized with COVID-19 with concomitant diagnosis of CVT
jos-2022-00752-suppl4.pdf
Supplementary Table 9.
Mortality as it relates to COVID-19 status during the first year of the COVID-19 pandemic from 120 centers
jos-2022-00752-suppl4.pdf

Notes

Disclosure

Diana Aguiar de Sousa reported speaker fees from Bayer, travel support from Boehringer Ingelheim, participating in an advisory board for Astrazeneca, and DSMB participation for the SECRET trial, outside the submitted work; Jordi Blasco reported speaker and CEC fees from Stryker and Medtronic, respectively; Manuel Bolognese reported participation in the advisory board (AstraZeneca) and speaker fee (Roche) outside the submitted work; Cristian Falup-Pecurariu reported royalties from Springer Nature Publishing Group and Elsevier, Research Grant from Transilvania University Brasov, speaker fees and honoraria from International Parkinson and Movement Disorders Society, AbbVie, outside the submitted work; Thalia S. Field reports in-kind study medication from Bayer Canada, consultation fees from HLS Therapeutics and is on the board of Destine Health outside the submitted work; Italo Linfante reported consulting fees from Penumbra, Medtronic, Stryker, Microvention, InNeuroCo, and Three Rivers; Patrik Michel reported grants from Swiss National Science Foundation and Swiss Heart Foundation outside the submitted work; Robert Mikulik was supported by project No. CA18118, IRENE COST Action funded by COST Association, by the IRIS-TEPUS Project No. LTC20051 from the INTER-EXCELLENCE INTER-COST Program of the Ministry of Education, Youth and Sports of the Czech Republic, and by STROCZECH within CZECRIN Large Research Infrastructure No. LM2018128 funded by the state budget of the Czech Republic; Jiangyong Min reported consulting fees from Medtronic and Abbott Laboratories; Simon Nagel reported personal fees for consultancy for Brainomix and payment for lectures including speaker bureaus with Boehringer Ingelheim and Pfizer outside the submitted work; Thanh N. Nguyen reported research support from Medtronic and SVIN (related); Raul G. Nogueira reported consulting fees for advisory roles with Anaconda, Biogen, Cerenovus, Genentech, Hybernia, Imperative Care, Medtronic, Phenox, Philips, Prolong Pharmaceuticals, Stryker Neurovascular, Shanghai Wallaby, and Synchron and stock options for advisory roles with Astrocyte, Brainomix, Cerebrotech, Ceretrieve, Corindus Vascular Robotics, Vesalio, Viz-AI, RapidPulse, and Perfuze, and investments in Viz-AI, Perfuze, Cerebrotech, Reist/Q’Apel Medical, Truvic, and Viseon; Santiago Ortega-Gutierrez reports being a consultant for Medtronic and Stryker Neurovascular and receiving grants from Stryker, IschemiaView, Viz.ai, and Siemens; Aleksandra Pikula reports research grant from CSC Stroke Pandemic Agile Response Competition (SPARC) Grant— National C-VASC COVID-19 Study; Martin Punter reports speaker fees for Alexion Pharmaceuticals; Petra Sedova and Robert Mikulik were supported by the project No. CA18118, IRENE COST Action—Implementation Research Network in Stroke Care Quality, by the project No. LQ1605 from the National Program of Sustainability II, by the IRIS-TEPUS Project No. LTC20051 from the INTER-EXCELLENCE INTER-COST program of the Ministry of Education, Youth and Sports of the Czech Republic; James E. Siegler reported consulting fees from Ceribell and speakers’ bureau involvement with AstraZeneca outside the submitted work; Hiroshi Yamagami reported research grants from Bristol-Myers Squibb, lecturer’s fees from Bayer, Daiichi-Sankyo, Stryker, and membership of the advisory boards for Daiichi-Sankyo outside the submitted work; Osama O. Zaidat reported consulting fees for Stryker, Medtronic, Cerenovus, and Penumbra, research grants from Stryker, Medtronic, Cerenovus, Penumbra, and Genentech; Osama O. Zaidat had a patent for Ischemic Stroke issued.

ACKNOWLEDGMENTS

The study was funded by the Society of Vascular and Interventional Neurology research pilot grant.

References

1. Ahmad FB, Anderson RN. The leading causes of death in the US for 2020. JAMA. 2021; 325:1829–1830.
crossref
2. Chou SH, Beghi E, Helbok R, Moro E, Sampson J, Altamirano V, et al. Global incidence of neurological manifestations among patients hospitalized with COVID-19: a report for the GCS-NeuroCOVID Consortium and the ENERGY Consortium. JAMA Netw Open. 2021; 4:e2112131.
3. Spudich S, Nath A. Nervous system consequences of COVID-19. Science. 2022; 375:267–269.
crossref
4. Elkind MSV, Boehme AK, Smith CJ, Meisel A, Buckwalter MS. Infection as a stroke risk factor and determinant of outcome after stroke. Stroke. 2020; 51:3156–3168.
crossref
5. Yaghi S, Ishida K, Torres J, Mac Grory B, Raz E, Humbert K, et al. SARS-CoV-2 and stroke in a New York healthcare system. Stroke. 2020; 51:2002–2011.
crossref
6. Siegler JE, Cardona P, Arenillas JF, Talavera B, Guillen AN, Chavarría-Miranda A, et al. Cerebrovascular events and outcomes in hospitalized patients with COVID-19: the SVIN COVID-19 Multinational Registry. Int J Stroke. 2021; 16:437–447.
crossref
7. Esenwa C, Cheng NT, Luna J, Willey J, Boehme AK, KirchoffTorres K, et al. Biomarkers of coagulation and inflammation in COVID-19-associated ischemic stroke. Stroke. 2021; 52:e706–e709.
crossref
8. Ma A, Kase CS, Shoamanesh A, Abdalkader M, Pikula A, Sathya A, et al. Stroke and thromboprophylaxis in the era of COVID-19. J Stroke Cerebrovasc Dis. 2021; 30:105392.
crossref
9. Abdalkader M, Shaikh SP, Siegler JE, Cervantes-Arslanian AM, Tiu C, Radu RA, et al. Cerebral venous sinus thrombosis in COVID-19 patients: a multicenter study and review of literature. J Stroke Cerebrovasc Dis. 2021; 30:105733.
crossref
10. Rana A, Nguyen TN, Siegler JE. Stroke and neurointervention in the COVID-19 pandemic: a narrative review. Expert Rev Med Devices. 2021; 18:523–531.
crossref
11. Devasagayam S, Wyatt B, Leyden J, Kleinig T. Cerebral venous sinus thrombosis incidence is higher than previously thought: a retrospective population-based study. Stroke. 2016; 47:2180–2182.
crossref
12. Otite FO, Patel S, Sharma R, Khandwala P, Desai D, Latorre JG, et al. Trends in incidence and epidemiologic characteristics of cerebral venous thrombosis in the United States. Neurology. 2020; 95:e2200–e2213.
crossref
13. Coutinho JM, Zuurbier SM, Aramideh M, Stam J. The incidence of cerebral venous thrombosis: a cross-sectional study. Stroke. 2012; 43:3375–3377.
14. Yaghi S, Shu L, Bakradze E, Salehi Omran S, Giles JA, Amar JY, et al. Direct oral anticoagulants versus warfarin in the treatment of cerebral venous thrombosis (ACTION-CVT): a multicenter international study. Stroke. 2022; 53:728–738.
15. Alimohammadi A, Kim DJ, Field TS. Updates in cerebral venous thrombosis. Curr Cardiol Rep. 2022; 24:43–50.
crossref
16. Klein P, Shu L, Nguyen TN, Siegler JE, Salehi Omran S, Simpkins A, et al. Factors associated with adverse outcomes following CVT: analysis of ACTION-CVT. Eur Stroke J. 2022; 7(1 Suppl):98.
17. Al-Mufti F, Amuluru K, Sahni R, Bekelis K, Karimi R, Ogulnick J, et al. Cerebral venous thrombosis in COVID-19: a New York Metropolitan Cohort Study. AJNR Am J Neuroradiol. 2021; 42:1196–1200.
crossref
18. Sánchez van Kammen M, Heldner MR, Brodard J, Scutelnic A, Silvis S, Schroeder V, et al. Frequency of thrombocytopenia and platelet factor 4/heparin antibodies in patients with cerebral venous sinus thrombosis prior to the COVID-19 pandemic. JAMA. 2021; 326:332–338.
crossref
19. Siegler JE, Klein P, Yaghi S, Vigilante N, Abdalkader M, Coutinho JM, et al. Cerebral vein thrombosis with vaccineinduced immune thrombotic thrombocytopenia. Stroke. 2021; 52:3045–3053.
crossref
20. Sánchez van Kammen M, Aguiar de Sousa D, Poli S, Cordonnier C, Heldner MR, van de Munckhof A, et al. Characteristics and outcomes of patients with cerebral venous sinus thrombosis in SARS-CoV-2 vaccine-induced immune thrombotic thrombocytopenia. JAMA Neurol. 2021; 78:1314–1323.
21. Perry RJ, Tamborska A, Singh B, Craven B, Marigold R, Arthur-Farraj P, et al. Cerebral venous thrombosis after vaccination against COVID-19 in the UK: a multicentre cohort study. Lancet. 2021; 398:1147–1156.
crossref
22. Nogueira RG, Abdalkader M, Qureshi MM, Frankel MR, Mansour OY, Yamagami H, et al. Global impact of COVID-19 on stroke care. Int J Stroke. 2021; 16:573–584.
23. Nogueira RG, Qureshi MM, Abdalkader M, Martins SO, Yamagami H, Qiu Z, et al. Global impact of COVID-19 on stroke care and IV thrombolysis. Neurology. 2021; 96:e2824–e2838.
24. Raymaekers V, Demeestere J, Bellante F, De Blauwe S, De Raedt S, Dusart A, et al. The impact of COVID-19 on acute stroke care in Belgium. Acta Neurol Belg. 2021; 121:1251–1258.
crossref
25. Sacco S, Ricci S, Ornello R, Eusebi P, Petraglia L, Toni D, et al. Reduced admissions for cerebrovascular events during COVID-19 outbreak in Italy. Stroke. 2020; 51:3746–3750.
26. Seiffert M, Brunner FJ, Remmel M, Thomalla G, Marschall U, L’Hoest H, et al. Temporal trends in the presentation of cardiovascular and cerebrovascular emergencies during the COVID-19 pandemic in Germany: an analysis of health insurance claims. Clin Res Cardiol. 2020; 109:1540–1548.
crossref
27. Nguyen TN, Haussen DC, Qureshi MM, Yamagami H, Fujinaka T, Mansour OY, et al. Decline in subarachnoid haemorrhage volumes associated with the first wave of the COVID-19 pandemic. Stroke Vasc Neurol. 2021; 6:542–552.
28. Ramos-Araque ME, Siegler JE, Ribo M, Requena M, López C, de Lera M, et al. Stroke etiologies in patients with COVID-19: the SVIN COVID-19 multinational registry. BMC Neurol. 2021; 21:43.
crossref
29. COVID-19 pandemic by country and territory: 5. Timeline of first confirmed cases by country or territory. Wikipedia. https://en.wikipedia.org/wiki/COVID-19_pandemic_by_country_and_territory#Timeline_of_first_confirmed_cases_by_country_or_territory. 2022. Accessed April 19, 2022.
30. Bussel JB, Connors JM, Cines DB, Dunbar CE, Michaelis LC, Kreuziger LB, et al. Vaccine-induced immune thrombotic thrombocytopenia. American Society of Hematology. https://www.hematology.org/covid-19/vaccine-induced-immunethrombotic-thrombocytopenia. 2022. Accessed April 19 2022.
31. Nguyen TN, Qureshi MM, Klein P, Mikulik R, Yamagami H, Abdalkader M, et al. Global impact of the COVID19 pandemic on subarachnoid hemorrhage hospitalizations, aneurysm treatment, and in-hospital mortality: 1 year follow-up. Eur Stroke J. 2022; 7(1 Suppl):553.
32. Siegler JE, Abdalkader M, Michel P, Nguyen TN. Therapeutic trends of cerebrovascular disease during the COVID-19 pandemic and future perspectives. J Stroke. 2022; 24:179–188.
crossref
33. Long CV, Clemente JD, Singh S, Strong D, Rhoten JB, Prasad T, et al. Brain venography performance following the pause of Ad.26.COV2.S COVID-19 vaccine administration. J Thromb Thrombolysis. 2022; 53:359–362.
crossref
34. Baldini T, Asioli GM, Romoli M, Carvalho Dias M, Schulte EC, Hauer L, et al. Cerebral venous thrombosis and severe acute respiratory syndrome coronavirus-2 infection: a systematic review and meta-analysis. Eur J Neurol. 2021; 28:3478–3490.
crossref
35. Cavalcanti DD, Raz E, Shapiro M, Dehkharghani S, Yaghi S, Lillemoe K, et al. Cerebral venous thrombosis associated with COVID-19. AJNR Am J Neuroradiol. 2020; 41:1370–1376.
crossref
36. Nwajei F, Anand P, Abdalkader M, Andreu Arasa VC, Aparicio HJ, Behbahani S, et al. Cerebral venous sinus thromboses in patients with SARS-CoV-2 infection: three cases and a review of the literature. J Stroke Cerebrovasc Dis. 2020; 29:105412.
crossref
37. Taquet M, Husain M, Geddes JR, Luciano S, Harrison PJ. Cerebral venous thrombosis and portal vein thrombosis: a retrospective cohort study of 537,913 COVID-19 cases. EClinicalMedicine. 2021; 39:101061.
crossref
38. Nannoni S, de Groot R, Bell S, Markus HS. Stroke in COVID-19: a systematic review and meta-analysis. Int J Stroke. 2021; 16:137–149.
crossref
39. Dmytriw AA, Dibas M, Phan K, Efendizade A, Ospel J, Schirmer C, et al. Acute ischaemic stroke associated with SARSCoV-2 infection in North America. J Neurol Neurosurg Psychiatry. 2022; 93:360–368.
40. Roushdy T, Aref H, Kesraoui S, Temgoua M, Nono KP, Gebrewold MA, et al. Stroke services in Africa: what is there and what is needed. Int J Stroke. 2022; Jan. 4. [Epub]. https://doi.org/10.1177/17474930211066416.
crossref
41. Nguyen TN, Abdalkader M, Nagel S, Qureshi MM, Ribo M, Caparros F, et al. Noncontrast computed tomography vs computed tomography perfusion or magnetic resonance imaging selection in late presentation of stroke with large-vessel occlusion. JAMA Neurol. 2022; 79:22–31.
crossref

Figure 1.
Study flow chart. CVT, cerebral venous thrombosis; SAH, subarachnoid hemorrhage; COVID-19, coronavirus disease 2019.
jos-2022-00752f1.tif
Figure 2.
Cerebral venous thrombosis (CVT), CVT mortality, and coronavirus disease 2019 (COVID-19) admissions. CVT admissions are based on data submitted from 171 centers. COVID-19 admissions are based on data submitted from 154/171 centers.
jos-2022-00752f2.tif
Figure 3.
Cerebral venous thrombosis (CVT) in-hospital mortality rate during the first 5 months of three different year (2019, 2020, 2021) comparisons in 138 hospitals with complete CVT mortality and CVT admission data. CVT in-hospital mortality 2019 vs. 2020: 2.26% vs. 4.74%, P=0.05; CVT in-hospital mortality 2019 vs. 2021: 2.26% vs. 4.99%, P=0.03; CVT in-hospital mortality 2020 vs. 2021, no difference. *Twenty-six vaccine-induced immune thrombotic thrombocytopenia (VITT) probable or confirmed cases were identified in 2021, resulting in six deaths. Excluding cases of confirmed or probable VITT, the case fatality rate of CVT during the first 5 months of 2021 drops from 4.99% to 4.04% (20/495 CVT cases) (P=0.1).
jos-2022-00752f3.tif
Table 1.
Cerebral venous sinus thrombosis admissions: overall 1-year and monthly volumes before and during the COVID-19 pandemic
Variable Overall volume
Monthly volume*
No. of hospital No. No. Change P No. of hospital Before COVID-19 During COVID-19 P
Overall 163 1,139 1,174 3.1 (2.2–4.2) 0.47 171 0.60±0.12 0.61±0.12 0.97
Primary vs. comprehensive stroke center§
 Primary 39 201 229 13.9 (9.8–19.4) 0.18 42 0.52±0.16 0.57±0.18 0.20
 Comprehensive 124 938 945 0.7 (0.4–1.5) 0.87 129 0.70±0.18 0.69±0.17 0.66
Center COVID-19 volume
 Low 51 216 246 13.9 (9.9–19.1) 0.16 52 0.50±0.12 0.55±0.13 0.11
 Intermediate 50 267 312 16.9 (12.8–21.8) 0.06 50 0.39±0.21 0.47±0.21 0.07
 High 49 536 509 –5.0 (–7.2 to –3.5) 0.40 52 1.07±0.26 1.02±0.26 0.43

Values are presented as percentage (95% confidence interval) or adjusted mean±standard error.

COVID-19, coronavirus disease 2019.

* The monthly volume analysis is adjusted for the date of peak COVID-19 volume for each country, the start date of the second wave, and the continent;

Number of admissions during 12 months before the COVID-19 pandemic;

Number of admissions during 12 months of COVID-19 pandemic;

§ Primary vs. Comprehensive, P<0.0001;

Low vs. Intermediate (P=0.366), Low vs. High (P=not available), Intermediate vs. High (P=not available).

Table 2.
CVT in-hospital mortality rate 1 year prior compared to 1 year during the COVID-19 pandemic
Variable No. of hospital CVT admissions CVT mortality Mortality rate (%) P
Overall
 Before COVID-19 138 1,013 35 3.46 0.12
 During COVID-19 1,037 50 4.82
Primary stroke centers
 Before COVID-19 37 196 8 4.08 0.25
 During COVID-19 226 15 6.64
Comprehensive stroke centers
 Before COVID-19 101 817 27 3.30 0.29
 During COVID-19 811 35 4.32
Center COVID-19 volume: low
 Before COVID-19 43 199 6 3.02 0.42
 During COVID-19 221 10 4.52
Center COVID-19 volume: intermediate
 Before COVID-19 42 243 10 4.12 1.00
 During COVID-19 267 11 4.12
Center COVID-19 volume: high
 Before COVID-19 44 483 19 3.93 0.23
 During COVID-19 464 26 5.60

The before COVID-19 period was the 12 months immediately preceding the during COVID-19 period.

COVID-19, coronavirus disease 2019; CVT, cerebral venous thrombosis.

Appendices

Appendix 1
List of co-authors and roles
jos-2022-00752-app1.pdf
TOOLS
Similar articles