Journal List > Kosin Med J > v.37(2) > 1516078074

Seo, Hwang, Yun, Moon, Choi, Shin, and Yoon: A prospective study of the correlation between hepatic fibrosis and noninvasively measured fibrosis markers including serum M2BPGi and acoustic radiation force impulse elastography

Abstract

Background

Mac-2 binding protein glycosylation isomer (M2BPGi) was introduced as a noninvasively measurable serologic marker for liver fibrosis. Acoustic radiation force impulse imaging (ARFI) elastography is another noninvasive method of measuring hepatic fibrosis. There are limited data about the correlations between histologic fibrosis grade and noninvasively measured markers, including M2BPGi and ARFI.

Methods

This prospective study was conducted among patients admitted consecutively for liver resection, cholecystectomy, or liver biopsy. ARFI elastography, serum M2BPGi levels, and the aspartate aminotransferase to platelet ratio index (APRI) score were evaluated before histologic evaluation. Histologic interpretation was performed by a single pathologist using the METAVIR scoring system.

Results

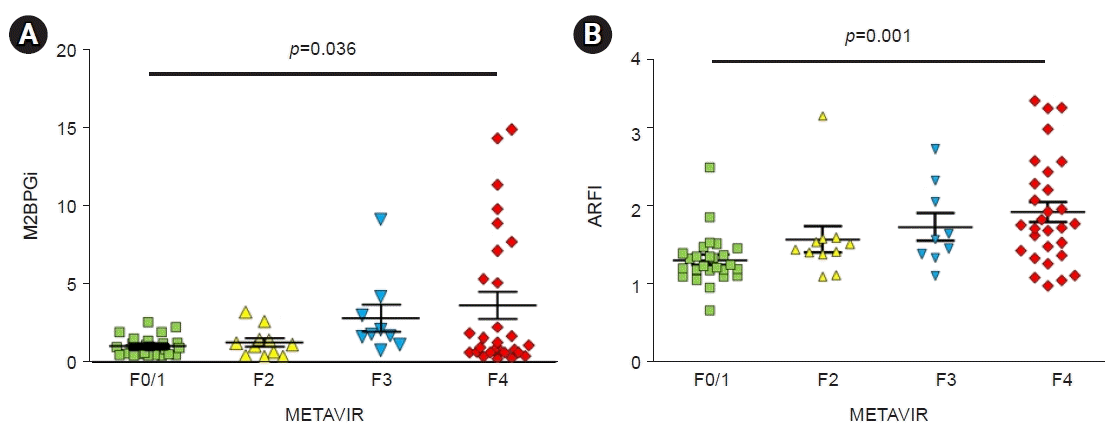
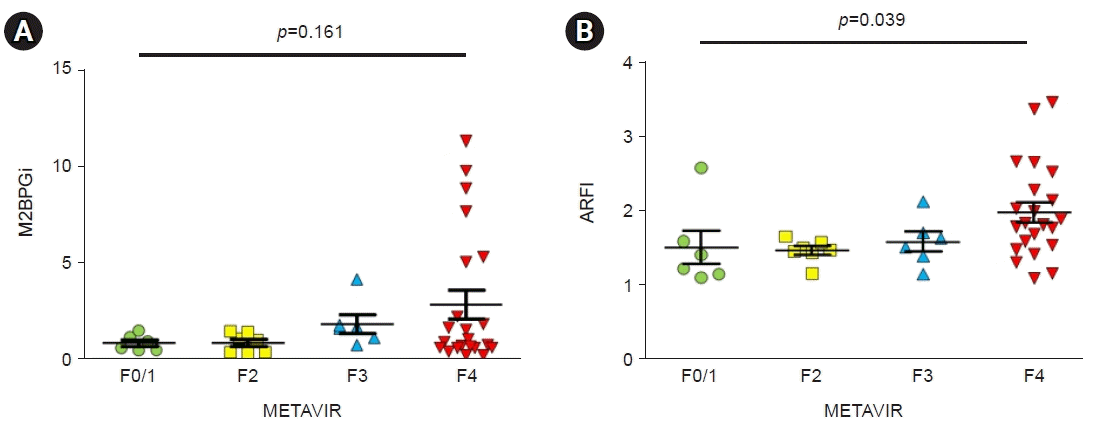
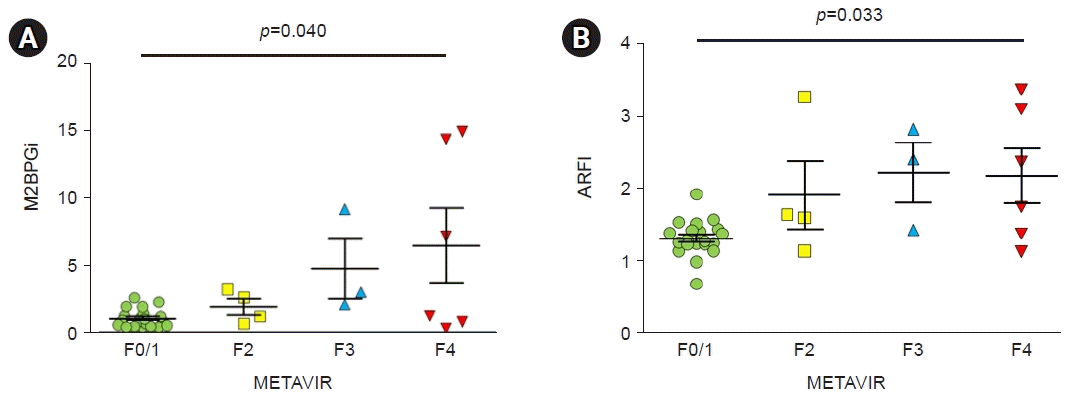
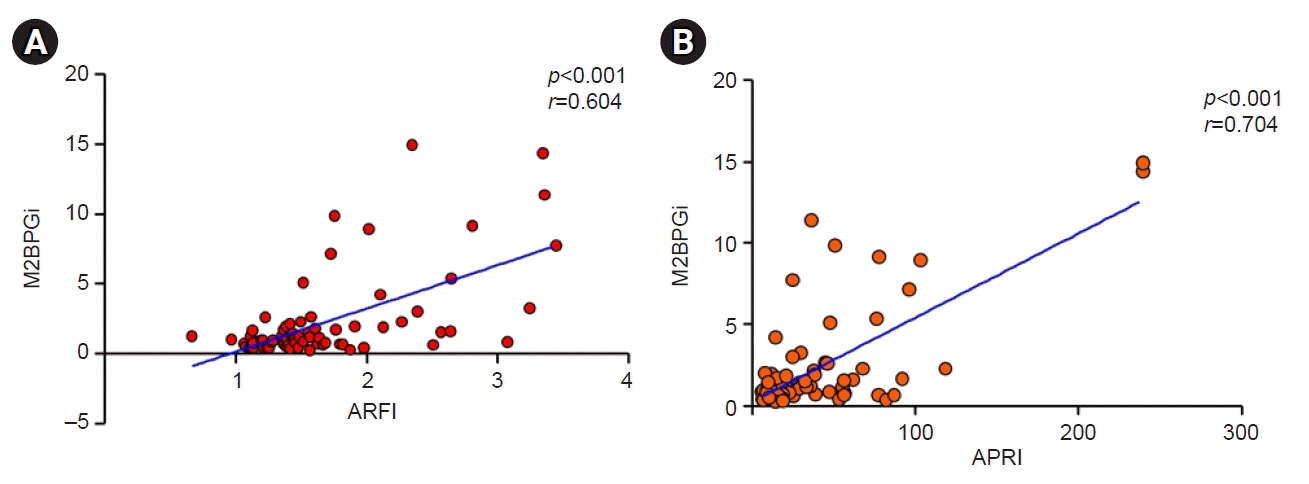
In patients with high METAVIR scores, M2BPGi levels and ARFI values showed statistically significant differences between patients with fibrosis and those without fibrosis. In 41 patients with hepatocellular carcinoma, as METAVIR scores increased, M2BPGi levels also tended to increase (p=0.161). ARFI values changed significantly as METAVIR scores increased (p=0.039). In 33 patients without hepatocellular carcinoma, as METAVIR scores increased, M2BPGi levels significantly increased (p=0.040). ARFI values also changed significantly as METAVIR scores increased (p=0.033). M2BPGi levels were significantly correlated with ARFI values (r=0.604, p<0.001), and APRI values (r=0.704, p<0.001), respectively.

Conclusions

Serum M2BPGi levels increased with liver fibrosis severity and could be a good marker for diagnosing advanced hepatic fibrosis regardless of the cause of liver disease.

Introduction

The most important pathologic finding of chronic liver disease is liver fibrosis, which can progress to decompensated liver cirrhosis or hepatocellular carcinoma (HCC). Various kinds of surrogate markers for liver fibrosis have been developed in clinical fields [1,2]. In practice, commonly used indirect markers of liver fibrosis include the aspartate aminotransferase (AST) to platelet ratio index (APRI) and fibrosis-4 [3,4]. Liver fibrosis is traditionally diagnosed with liver biopsy, imaging, and surrogate biomarkers [1,5]. Among them, liver biopsy is the gold standard for diagnosis of liver fibrosis based on histopathological grade [6,7], but the information that can be obtained from a liver biopsy can be inaccurate because of insufficient biopsy tissue and focal sampling [5]. For histological diagnosis, the opinion of an experienced pathologist is very important because differences in diagnosis can occur between observers.
Acoustic radiation force impulse imaging (ARFI) elastography uses ultrasound to evaluate the stiffness of liver tissue. ARFI imaging has been demonstrated in many clinical settings, including hepatobiliary patients [8]. Currently, ARFI elastography is well known as a noninvasive modality to detect hepatic fibrosis mainly in patients with chronic viral hepatitis [9].
In addition, Mac-2 binding protein glycosylation isomer (M2BPGi) has been introduced as a noninvasive serologic marker for liver fibrosis [10,11]. Numerous studies have shown that M2BPGi can predict against liver fibrosis in various liver diseases, such as viral hepatitis, nonalcoholic fatty liver disease, autoimmune hepatitis, primary biliary cirrhosis, and biliary atresia [12].
This prospective study aimed to evaluate the performance of noninvasive hepatic fibrosis markers, including M2BPGi and ARFI point shear wave elastography result, and to compare it with the liver histologic fibrosis grade.

Methods

Ethical statements: This study design was approved by the Institutional Review Board of Kosin University Gospel Hospital (KUGH 2015-06-105). All patients gave written consent for histologic evaluation of the liver at the time of initial consent for study participation.

1. Study protocol

This study was performed prospectively in patients admitted consecutively for liver resection, cholecystectomy, or liver biopsy from September 2015 to April 2020. ARFI elastography, serum M2BPGi measurement, and APRI testing were performed before histologic evaluation.

2. Measurement of M2BPGi

Preoperative serum samples were collected before histologic evaluation. Serum M2BPGi was measured at baseline using an automated immunoanalyzer (HISCL-800; Sysmex, Kobe, Japan). The measured result was presented as a cutoff index calculated as follows:
WFA-M2BP (WFA-M2BPsample−WFA-M2BPnc)/(WFA-M2BPpc−WFA-M2BPnc),
where WFA-M2BPsample is the measured value of the patient serum sample; WFA-M2BPnc is the negative control value; and WFA-M2BPpc is the positive control provided by the manufacturer.

3. ARFI imaging

Liver stiffness was measured using an ARFI elastography machine (ACUSON S3000; Siemens, Munich, Germany) at the Liver Clinic of Kosin University Gospel Hospital. For the ARFI examination of the liver, the patient lay in a supine position with abduction of the right arm. The liver was evaluated with grayscale ultrasound before ARFI, which was performed at 2–3 cm below the liver capsule, away from large vessels. For each patient, the ARFI value was obtained by repeating measurement more than three times, and then the average value was used in this study.

4. Histologic assessment of hepatic fibrosis

All liver histology interpretations were performed by a single pathologist well experienced in hepatobiliary pathology. A tissue sample was stained and scored for degree of fibrosis according to the METAVIR scoring system, which specifies a fibrosis score from 0–4 points; no portal fibrosis (stage F0), portal fibrosis without septa (stage F1), portal fibrosis with few septa (stage F2), septal fibrosis without cirrhosis (stage F3), and cirrhosis (stage F4) [13].

5. Laboratory examination

Laboratory data were collected at the time of the initial admission to the hospital. Complete blood count results, including hemoglobin concentration, white blood cell count, platelet count, and prothrombin time, and blood chemistry data were recorded. The APRI score was calculated using laboratory data as follows [14]:
APRI=([AST/upper limit of the normal range of AST]×100)/platelet×109/L

6. Statistical analysis

Demographic data and baseline characteristics are presented as mean and standard deviation values for continuous variables. To compare the three or four groups according to histologic fibrosis grade, one-way analysis of variance or the Kruskal-Wallis test was performed with continuous variables, and linear-by-linear association was performed with categorical variables. Statistical significance was determined as p<0.05 using SPSS software version 23 (IBM Corp., Armonk, NY, USA).

Results

1. Baseline characteristics

A total of 74 patients were included in this study. The mean age was 59.2±9.0 years, and 55 of the patients (74.3%) were male. The mean body weight was 65.2±11.0 kg, 19 patients (25.7%) had diabetes, and 26 patients (35.1%) had hypertension. Hepatitis B surface antigen positivity was found in 37 patients (50.0%), and anti-hepatitis C virus positivity was found in nine (12.2%). Thirteen patients had alcoholic liver disease, and 41 (55.4%) had HCC. Liver tissue was acquired through liver resection (68.9%), metastasectomy (8.1%), cholecystectomy (5.4%), liver transplantation (9.5%), and needle biopsy (8.1%). Histologic fibrosis grades were identified as F0/1 (35.1%), F2 (14.9%), F3 (12.2%), and F4 (37.8%) based on the METAVIR system (Table 1).

2. M2BPGi and ARFI correlated with METAVIR score

In all 74 patients, as the METAVIR score increased, there was a statistically significant difference between histologic fibrosis and both the M2BPGi (Fig. 1A) and ARFI (Fig. 1B) values. The M2BPGi result showed no statistical difference depending on the cause of liver disease, including hepatitis B virus, hepatitis C virus, or alcohol consumption (p=0.884). The APRI value also showed no significant difference according to the cause of liver disease (p=0.066) (Table 1).

1) M2BPGi and ARFI correlated with METAVIR score in HCC

Forty-one patients were diagnosed with HCC. As the METAVIR score increased, the M2BPGi level also tended to increase, but there was no statistical significance (p=0.161) (Fig. 2A). However, the ARFI value elevated significantly as the METAVIR score increased (p=0.039) (Fig. 2B).

2) M2BPGi and ARFI correlated with METAVIR score without HCC

Thirty-three patients did not have HCC. As the METAVIR score increased, the M2BPGi level also significantly increased (p=0.040) (Fig. 3A), and the ARFI value elevated significantly (p=0.033) (Fig. 3B).

3. Correlation among noninvasive fibrosis markers

The M2BPGi level was found to have a significant correlation with the ARFI value (r=0.604, p<0.001) (Fig. 4A) and the APRI value (r=0.704, p<0.001) (Fig. 4B).

Discussion

This prospective study confirmed a significant relationship between hepatic fibrosis grade and serum M2BPGi. Even in HCC patients, the M2BPGi level showed a tendency to infer hepatic fibrosis. M2BPGi showed a significant association with both the ARFI value as an elastography marker and APRI as a serologic marker.
M2BPGi, a secreted glycoprotein present in the extracellular matrix, correlates with liver fibrosis [15]. M2BPGi was chosen as a biomarker of liver fibrosis using serum from chronic hepatitis C patients, in whom it is currently used in hepatic fibrosis evaluation [16,17]. In addition, the M2BPGi level in patients with chronic hepatitis B increased as liver fibrosis progresses. However, the M2BPGi level in chronic hepatitis B patients was slightly lower than that in chronic hepatitis C patients [18]. In addition, the M2BPGi level for diagnosing liver fibrosis in nonalcoholic fatty liver disease patients was lower than that in chronic hepatitis C patients. Therefore, it is necessary to consider the cause of the underlying liver disease when interpreting the M2BPGi results [19]. According to the results of the present study, the M2BPGi level does not appear to change significantly depending on the cause of liver disease. It was also revealed to be able to predict hepatic fibrosis without being significantly affected by the presence or absence of HCC. This result will be helpful in evaluating the degree of hepatic fibrosis using M2BPGi easily and conveniently in clinical practice.
ARFI elastography uses ultrasound to visualize liver stiffness. In many studies, ARFI elastography was capable of detecting hepatic fibrosis, especially in patients with chronic viral hepatitis [9]. Recently, a meta-analysis of noninvasive imaging modalities in four ARFI elastography studies (6 cohorts) with 486 patients [20-23] revealed that the overall sensitivity and specificity were 0.92 (95% confidence interval, 0.81–0.97) and 0.72 (95% confidence interval, 0.62–0.81), respectively [24]. In addition, APRI is an indirect marker of hepatic fibrosis based on routine laboratory examinations. In a meta-analysis of 40 studies, investigators concluded that an APRI score >1.0 point had a sensitivity of 76% and a specificity of 72% for predicting advanced hepatic fibrosis [25]. In our study, M2BPGi level showed a significant correlation with both the APRI and ARFI values. In particular, M2BPGi level had a high correlation with noninvasive markers even when analyzed separately based on the presence or absence of HCC.
The main limitations of this study are its relatively small sample size (n=74) and lack of prognostic analysis for predicting deterioration of liver function or development of HCC. In addition, elastography study was performed with ARFI not FibroScan, which is more highly validated in real life. However, this study prospectively analyzed the correlation between liver histology and M2BPGi level and will be of great help in clinical practice. In conclusion, the serum M2BPGi level increased with liver fibrosis severity and could be a good marker for diagnosing advanced hepatic fibrosis regardless of the cause of liver disease.

Notes

Conflicts of interest

Hyunyong Hwang and Young Il Choi are editorial board members of the journal but were not involved in the peer reviewer selection, evaluation, or decision process of this article. No other potential conflicts of interest relevant to this article were reported.

Funding

This study was supported by a Korean National Research Foundation grant (2017R1C1B5076471) and partly supported by Sysmex Korea Co., Ltd. which had no role in study design, analysis, interpretation or publication. We declare that we have no financial conflicts of interest.

Author contributions

Conceptualization: KIS, HH. Data curation: BCY, HHM, YIC, DHS, MY. Formal analysis: KIS, HH. Funding acquisition: KIS, HH. Investigation: BCY, HHM, YIC, DHS, MY. Methodology: KIS, HH, BCY, HHM, YIC. Project administration: HH. Resources: HH. Supervision: BCY, DHS, MY. Visualization: KIS, HH. Writing - original draft: KIS. Writing - review & editing: HH. Approval of final manuscript: all authors.

References

1. Ahmad W, Ijaz B, Gull S, Asad S, Khaliq S, Jahan S, et al. A brief review on molecular, genetic and imaging techniques for HCV fibrosis evaluation. Virol J. 2011; 8:53.
crossref
2. Parkes J, Guha IN, Harris S, Rosenberg WM, Roderick PJ. Systematic review of the diagnostic performance of serum markers of liver fibrosis in alcoholic liver disease. Comp Hepatol. 2012; 11:5.
crossref
3. Poynard T, Halfon P, Castera L, Munteanu M, Imbert-Bismut F, Ratziu V, et al. Standardization of ROC curve areas for diagnostic evaluation of liver fibrosis markers based on prevalences of fibrosis stages. Clin Chem. 2007; 53:1615–22.
crossref
4. Schuppan D, Afdhal NH. Liver cirrhosis. Lancet. 2008; 371:838–51.
crossref
5. Castera L, Pinzani M. Biopsy and non-invasive methods for the diagnosis of liver fibrosis: does it take two to tango? Gut. 2010; 59:861–6.
crossref
6. Theise ND. Liver biopsy assessment in chronic viral hepatitis: a personal, practical approach. Mod Pathol. 2007; 20 Suppl 1:S3–14.
crossref
7. Brunt EM. Grading and staging the histopathological lesions of chronic hepatitis: the Knodell histology activity index and beyond. Hepatology. 2000; 31:241–6.
crossref
8. Nightingale K. Acoustic radiation force impulse (ARFI) imaging: a review. Curr Med Imaging Rev. 2011; 7:328–39.
crossref
9. Haque M, Robinson C, Owen D, Yoshida EM, Harris A. Comparison of acoustic radiation force impulse imaging (ARFI) to liver biopsy histologic scores in the evaluation of chronic liver disease: a pilot study. Ann Hepatol. 2010; 9:289–93.
crossref
10. Narimatsu H. Development of M2BPGi: a novel fibrosis serum glyco-biomarker for chronic hepatitis/cirrhosis diagnostics. Expert Rev Proteomics. 2015; 12:683–93.
crossref
11. Toshima T, Shirabe K, Ikegami T, Yoshizumi T, Kuno A, Togayachi A, et al. A novel serum marker, glycosylated Wisteria floribunda agglutinin-positive Mac-2 binding protein (WFA(+)-M2BP), for assessing liver fibrosis. J Gastroenterol. 2015; 50:76–84.
crossref
12. Tamaki N, Kurosaki M, Loomba R, Izumi N. Clinical utility of Mac-2 binding protein glycosylation isomer in chronic liver diseases. Ann Lab Med. 2021; 41:16–24.
crossref
13. Bedossa P, Poynard T. An algorithm for the grading of activity in chronic hepatitis C. The METAVIR Cooperative Study Group. Hepatology. 1996; 24:289–93.
crossref
14. Li Q, Song J, Huang Y, Li X, Zhuo Q, Li W, et al. The gamma-glutamyl-transpeptidase to platelet ratio does not show advantages than APRI and Fib-4 in diagnosing significant fibrosis and cirrhosis in patients with chronic hepatitis B: a retrospective cohort study in China. Medicine (Baltimore). 2016; 95:e3372.
15. Rosenberg I, Cherayil BJ, Isselbacher KJ, Pillai S. Mac-2-binding glycoproteins: putative ligands for a cytosolic beta-galactoside lectin. J Biol Chem. 1991; 266:18731–6.
crossref
16. Kuno A, Ikehara Y, Tanaka Y, Ito K, Matsuda A, Sekiya S, et al. A serum “sweet-doughnut” protein facilitates fibrosis evaluation and therapy assessment in patients with viral hepatitis. Sci Rep. 2013; 3:1065.
crossref
17. Yamasaki K, Tateyama M, Abiru S, Komori A, Nagaoka S, Saeki A, et al. Elevated serum levels of Wisteria floribunda agglutinin-positive human Mac-2 binding protein predict the development of hepatocellular carcinoma in hepatitis C patients. Hepatology. 2014; 60:1563–70.
crossref
18. Nishikawa H, Enomoto H, Iwata Y, Kishino K, Shimono Y, Hasegawa K, et al. Serum Wisteria floribunda agglutinin-positive Mac-2-binding protein for patients with chronic hepatitis B and C: a comparative study. J Viral Hepat. 2016; 23:977–84.
crossref
19. Shigefuku R, Takahashi H, Nakano H, Watanabe T, Matsunaga K, Matsumoto N, et al. Correlations of hepatic hemodynamics, liver function, and fibrosis markers in nonalcoholic fatty liver disease: comparison with chronic hepatitis related to hepatitis C virus. Int J Mol Sci. 2016; 17:1545.
crossref
20. Burak Ozkan M, Bilgici MC, Eren E, Caltepe G. Diagnostic accuracy of point shear wave elastography in the detection of portal hypertension in pediatric patients. Diagn Interv Imaging. 2018; 99:151–6.
crossref
21. Attia D, Schoenemeier B, Rodt T, Negm AA, Lenzen H, Lankisch TO, et al. Evaluation of liver and spleen stiffness with acoustic radiation force impulse quantification elastography for diagnosing clinically significant portal hypertension. Ultraschall Med. 2015; 36:603–10.
crossref
22. Takuma Y, Nouso K, Morimoto Y, Tomokuni J, Sahara A, Takabatake H, et al. Portal hypertension in patients with liver cirrhosis: diagnostic accuracy of spleen stiffness. Radiology. 2016; 279:609–19.
crossref
23. Salzl P, Reiberger T, Ferlitsch M, Payer BA, Schwengerer B, Trauner M, et al. Evaluation of portal hypertension and varices by acoustic radiation force impulse imaging of the liver compared to transient elastography and AST to platelet ratio index. Ultraschall Med. 2014; 35:528–33.
crossref
24. Hai Y, Chong W, Eisenbrey JR, Forsberg F. Network meta-analysis: noninvasive imaging modalities for identifying clinically significant portal hypertension. Dig Dis Sci. 2021; Jul. 17. [Epub]. https://doi.org/10.1007/s10620-021-07168-y.
crossref
25. Lin ZH, Xin YN, Dong QJ, Wang Q, Jiang XJ, Zhan SH, et al. Performance of the aspartate aminotransferase-to-platelet ratio index for the staging of hepatitis C-related fibrosis: an updated meta-analysis. Hepatology. 2011; 53:726–36.
crossref

Fig. 1.
M2BPGi levels and ARFI values correlated with METAVIR scores in all patients. As METAVIR scores increased, there were statistically significant differences in M2BPGi (A) and ARFI (B) values. M2BPGi, Mac-2 binding protein glycosylation isomer; ARFI, acoustic radiation force impulse imaging.
kmj-22-110f1.tif
Fig. 2.
M2BPGi levels and ARFI values correlated with METAVIR scores in hepatocellular carcinoma. (A) As METAVIR scores increased, M2BPGi levels tended to increase, but without statistical significance. (B) ARFI values changed significantly as METAVIR scores increased. M2BPGi, Mac-2 binding protein glycosylation isomer; ARFI, acoustic radiation force impulse imaging.
kmj-22-110f2.tif
Fig. 3.
M2BPGi levels and ARFI values correlated with METAVIR scores in the absence of hepatocellular carcinoma. (A) As METAVIR scores increased, M2BPGi levels significantly increased, as did (B) ARFI values. M2BPGi, Mac-2 binding protein glycosylation isomer; ARFI, acoustic radiation force impulse imaging.
kmj-22-110f3.tif
Fig. 4.
Correlations among noninvasive fibrosis markers. (A) M2BPGi levels showed a significant correlation with ARFI values and (B) with APRI values. M2BPGi, Mac-2 binding protein glycosylation isomer; ARFI, acoustic radiation force impulse imaging; APRI, aspartate aminotransferase to platelet ratio index.
kmj-22-110f4.tif
Table 1.
Baseline characteristics, M2BPGi levels, and laboratory data of patients by cause of liver disease
Characteristics All (n=74) Cause of disease
p-value
HBV (n=37) HCV (n=9) Alcohol (n=13) Unknown (n=15)
Age (yr), median (IQR) 58.5 (54.0–66.0) 57.0 (52.5–63.0) 57.0 (55.5–62.5) 59.0 (52.0–67.5) 65.0 (55.0–71.0) 0.246
Sex, no. (%) 0.002
 Male 55 (74.3) 32 (86.5) 7 (77.8) 10 (76.9) 6 (40.0)
 Female 19 (25.7) 5 (13.5) 2 (22.2) 3 (23.1) 9 (60.0)
Body scale, median (IQR)
 Body weight (kg) 64.80 (57.20–70.60) 68.00 (58.25–75.20) 60.40 (55.80–77.10) 64.00 (54.75–68.50)  64.80 (54.00–69.60) 0.490
 Height (cm) 165.4 (159.7–168.0) 166.0 (160.4–169.5) 166.7 (160.5–169.7) 165.0 (158.0–169.0) 160.0 (155.1–165.0) 0.103
Co-morbidity, no. (%)
 Diabetes mellitus 19 (25.7) 7 (18.9) 4 (44.4) 4 (30.8) 4 (26.7) 0.452
 Hypertension 26 (35.1) 11 (29.7) 3 (33.3) 6 (46.2) 6 (40.0) 0.331
Hepatocellular carcinoma, no. (%) 41 (55.4) 28 (75.7) 8 (88.9) 4 (30.8) 1 (6.7) <0.001
Noninvasive marker, median (IQR)
 ARFI 1.50 (1.25–1.88) 1.52 (1.39–1.84) 1.82 (1.59–2.46) 1.44 (1.24–2.11) 1.23 (1.12–1.50) 0.011
 M2BPGi 1.12 (0.62–1.99) 1.08 (0.68–1.84) 1.26 (0.53–7.59) 1.12 (0.42–2.33) 1.21 (0.54–2.25) 0.884
 APRI 23.86 (13.53–51.44) 28.69 (15.97–56.07) 36.59 (15.31–81–81) 16.24 (9.99–29.20) 16.49 (8.82–45.00) 0.066
Tissue acquisition, no. (%) 0.183
 Liver resection 51 (68.9) 27 (73.0) 8 (88.9) 8 (61.5) 8 (53.3)
 Cholecystectomy 4 (5.4) 3 (8.1) 0 0 1 (6.7)
 Metasectomy 6 (8.1) 0 1 (11.1) 1 (7.7) 4 (26.7)
 Liver transplantation 7 (9.5) 5 (13.5) 0 2 (15.4) 0
 Needle biopsy 6 (8.1) 2 (5.4) 0 2 (15.4) 2 (13.3)
METAVIR 0.001
 F 0/1 26 (35.1) 8 (21.6) 1 (11.1) 6 (46.2) 11 (73.3)
 F2 11 (14.9) 6 (16.2) 1 (11.1) 2 (15.4) 2 (13.3)
 F3 9 (12.2) 7 (18.9) 0 1 (7.7) 1 (6.7)
 F4 28 (37.8) 16 (43.2) 7 (77.8) 4 (30.8) 1 (6.7)
Laboratory result, median (IQR)
 WBC (×10³/μL) 5.08 (4.00–6.19) 4.82 (3.59–6.04) 4.45 (2.94–5.09) 5.96 (5.22–7.45) 5.18 (4.41–6.98) 0.038
 Platelet (×10³/μL) 157.11 (111.50–214.75) 131.00 (111.00–183.50) 116.00 (71.50–141.00) 234.00 (142.50–282.50) 204.00 (116.00–247.00) 0.004
 PT (INR) 1.03 (0.98–1.11) 1.02 (0.99–1.17) 1.03 (0.94–1.08) 1.02 (0.97–1.35) 1.03 (0.97–1.09) 0.844
 Protein total (g/dL) 7.10 (6.70–7.50) 7.15 (6.80–7.50) 7.30 (7.10–7.85) 6.90 (6.55–7.35) 7.10 (6.60–7.70) 0.317
 Albumin (g/dL) 4.10 (3.80–4.42) 4.30 (3.85–4.45) 4.00 (3.65–4.55) 3.80 (3.75–4.30) 4.10 (3.70–4.50) 0.526
 Total bilirubin (mg/dL) 0.83 (0.60–1.31) 0.93 (0.66–1.49) 0.75 (0.60–1.17) 0.76 (0.56–3.57) 0.67 (0.47–0.90) 0.316
 Direct bilirubin (mg/dL) 0.31 (0.21–0.50) 0.34 (0.23–0.53) 0.34 (0.25–0.38) 0.25 (0.20–1.71) 0.27 (0.19–0.43) 0.423
 AST (U/L) 35.00 (23.75–54.50) 35.00 (27.00–55.50) 36.00 (22.05–60.50) 38.00 (22.50–64.00) 31.00 (20.00–45.00) 0.862
 ALT (U/L) 26.00 (16.75–38.25) 28.00 (19.00–40.50) 23.00 (15.50–28.50) 17.00 (12.00–42.50) 26.00 (16.00–39.00) 0.335
 Creatinine (mg/dL) 0.69 (0.57–0.87) 0.74 (0.63–0.86) 0.79 (0.59–0.90) 0.68 (0.58–0.92) 0.56 (0.47–0.90) 0.281
 hs-CRP (mg/dL) 0.13 (0.03–0.90) 0.13 (0.02–0.51) 0.03 (0.02–0.18) 0.83 (0.16–2.63) 0.10 (0.04–0.97) 0.023

M2BPGi, Mac-2 binding protein glycosylation isomer; HBV, hepatitis B virus; HCV, hepatitis C virus ; IQR, interquartile range; ARFI, acoustic radiation force impulse; APRI, aspartate aminotransferase to platelet ratio index; WBC, white blood cell; PT (INR), prothrombin time (international normalized ratio); AST, aspartate aminotransferase; ALT, alanine aminotransferase; hs-CRP, high-sensitivity C-reactive protein.

TOOLS
Similar articles