

 PDF
PDF Citation
 Print
Print


INTRODUCTION
Spontaneous intracranial hemorrhage (ICH) causes a high proportion of cerebrovascular diseases, contributing to approximately 10%–15%. Although treatments for this condition have been investigated for a long time, the prognosis remains poor [9]. ICH treatments can be broadly divided into conservative medical treatment and surgical treatment. In several analyses of surgery attempts in patients with ICH, surgery had better results than medical treatment in terms of mortality [1,4,10,13,14].
In general, ICH removal involves craniotomy and minimally invasive surgical removal procedures such as stereotactic aspiration. Several recent randomized studies compared minimally invasive aspiration with standard craniotomies and suggested better outcomes with less invasive approaches [11,13,17,19].
Although stereotactic aspiration is a relatively simple and less invasive procedure in which a drainage catheter is inserted, it is not easy to insert the catheter in the exact and optimal location that physicians intend to [5]. Moreover, we could not find any study describing the impact of incorrect catheter positioning on a patient’s prognosis. Therefore, we analyzed approximately 36 cases of stereotactic aspiration that used a thrombolytic agent to explore how the catheter position inside the hematoma affects hematoma size reduction.
Go to : 
MATERIALS AND METHODS
Enrolled patients
This study was approved by the Institutional Review Board/Ethics Committee of Presbyterian Medical Center (IRB No. 2021-09-038). We retrospectively reviewed the details of 34 patients with ICH who underwent minimally invasive surgery using stereotactic aspiration plus urokinase for intracranial hemorrhage removal from 2010 to 2018. All patients with ICH >50 cc underwent stereotactic aspiration with the same protocol using two catheters to clarify the changes in the hematoma size measured by the ABC/2 method. The formula ABC/2 was used, where A is the greatest hemorrhage diameter by CT, B is the diameter 90 degrees to A, and C is the approximate number of CT slices with hemorrhage multiplied by the slice thickness [8]. We excluded cases of ICH due to secondary causes such as brain tumor, trauma, hemorrhagic transformation of cerebral infarction, cerebral aneurysm, or Moyamoya disease [12]. We also excluded cases where craniotomy for evacuation was performed for ICH expansion.
Preoperative management
We managed the risks of initial hematoma growth or instability using a stability protocol that combined the normalization of coagulation variables and guideline-based blood pressure management [6]. Blood pressure was checked every 5 min, and it was lowered to <140 mmHg within an hour. Nicardipine intravenous (IV) bolus infusion and continuous infusion lowered blood pressure aggressively. Patients were administered vitamin K1 and aminomethylbenzoic acid (AMBA) IV injection immediately after the discovery of hemorrhage. Platelet transfusion was done for patients with <50,000 platelets at the time of admission, and fresh frozen plasma was prepared for patients with an INR of >1.5. However, due to the long preparation time, most operations began before administration. To control intracranial pressure, mannitol ~1-2 g/kg was administered, and sodium valproate 400 mg IV was administered as a prophylactic anticonvulsant.
Operation
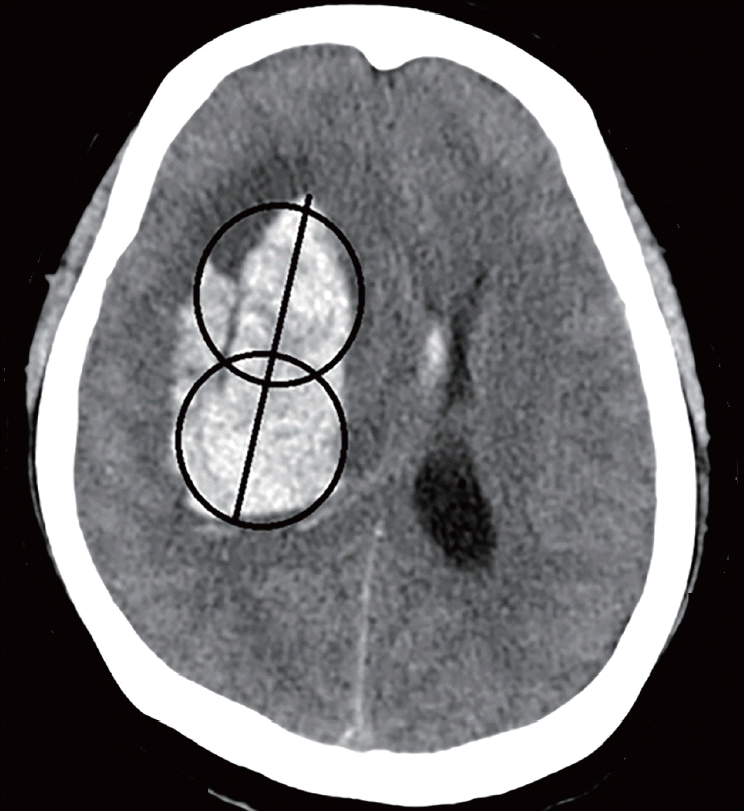
The Leksell stereotactic system head frame (ELEKTA, Stockholm, Sweden) was applied to the patient’s head with four symmetric aseptic pins under local anesthesia. The appropriate entry point was determined to the 1) frontal area (to 3 cm lateral to the midline and ~1-2 cm anterior to the coronal suture) and 2) temporal or parietal area (to the point close to the hematoma). The catheters were placed at the centers of two imaginary spheres assumed by dividing into two zones along the long axis of the hematoma (Fig. 1). If the patient had intraventricular hemorrhage, extraventricular drainage was additionally performed on Kocher’s point using the stereotactic frame. A postoperative CT scan was obtained to confirm the appropriate location of the drainage catheter. The stereotactic frame was then removed.
Postoperative management and thrombolysis procedure
The patient was managed in the NCU after the operation. Vitamin K1 and aminomethylbenzoic acid IV were administered for 2 days. The systolic blood pressure was strictly maintained at 110-130 mmHg, and the mannitol dose was tapered after approximately 1 week. After injecting urokinase 6000 IU in 1.2 mL of normal saline into the catheter, 1 ml of normal saline was further injected. This was repeated every 6 h. The urokinase injection was continued until the removal of the catheter. The tube was removed when the amount of hemorrhage on brain CT was <5 cc. A follow-up routine brain CT was taken on postoperative days (PODs) 3, 7, 14, 21, and 28. When a deteriorating change was detected in the neurological examination, a brain CT was taken immediately to check for an increase in hemorrhage, rebleeding, or change in edema. Glasgow coma scale (GCS) score was evaluated and recorded twice daily by a trained nurse.
Methods of catheter positioning
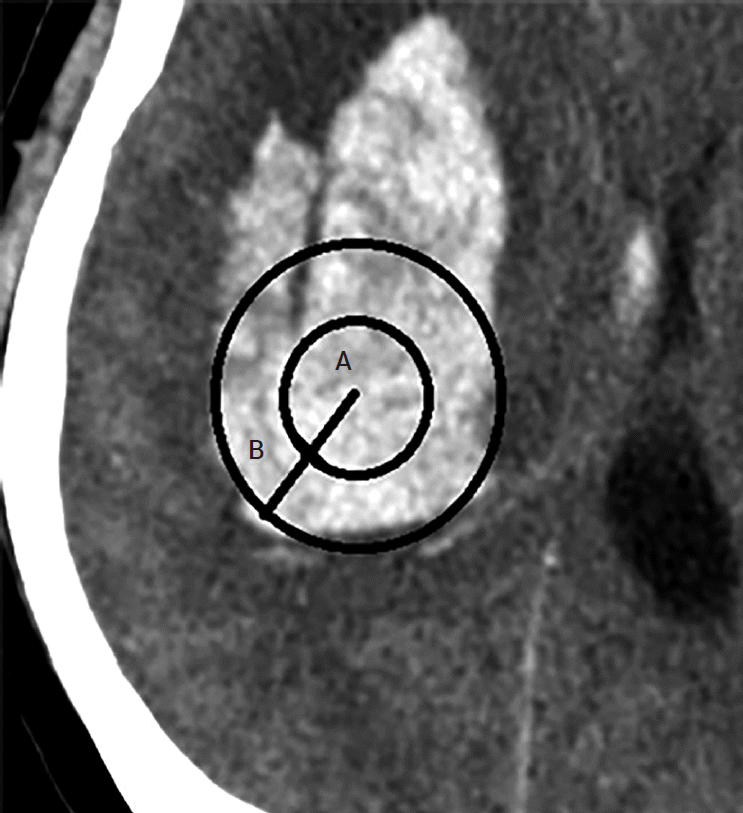
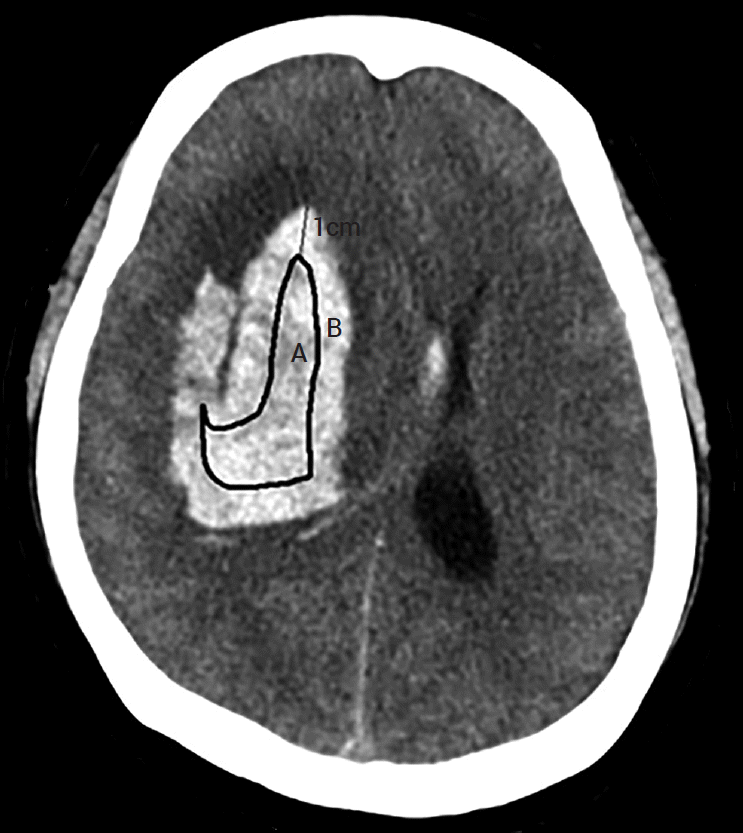
The silicone catheter we used is a 9F external ventricular drainage catheter GCAVI0-301736 (Sewoon Medical, Cheonan, Republic of Korea); holes on the silicon catheter for drainage are within 2 cm of the tip. Thus, it is reasonable to say that the center of the drainage is 1 cm away from the tip. Two methods evaluated the catheter position. In the first method, known as the two-circles half method, the radius of each circle is divided into half, and if the catheter is in the center, it is in a good position. When the catheter is halfway out, it is known as a poor position (Fig. 2). The hematoma volume measured on POD 0 was compared with that measured on POD 3 according to the number of tubes in a good position. If the catheter tip were located within 1 cm of the hematoma margin, several catheter holes would be located in the brain. The second method divides the position into cases where the tube was within 1 cm of the margin and a case where it was in the deeper part. This is known as the 1-cm margin method. A case of 1 cm deeper from the margin of the hematoma indicates a good position, whereas a case close to the margin is a poor position (Fig. 3). The evaluation was performed according to the number of tubes in good positions.
Collection and analysis of medical and radiological data
In the case of the two-circles half method and the 1-cm margin method, the average difference in hematoma volume on brain CT taken on POD 3 and immediately after surgery was compared according to the number of tubes. The Independent t test compared the average of both values. Depending on the number of tubes, the average values of PODs 0, 3, 7, 21, and 28, the GCS score at 3 months postoperatively, and the average of hematoma volume on PODs 0, 3, 7, 21, and 28 was compared using repeated measures ANOVA. All statistical analyses were conducted using SPSS 18.0 version (IBM Corp., Armonk, NY, USA).
Go to :
RESULTS
Using the two-circles half method, the number of catheters in a good position was 0 in 3 cases, 1 in 19 cases, and 2 in 14 cases. We evaluated the data of 36 patients with spontaneous ICH of >50 cc who underwent stereotactic hematoma drainage with thrombolysis. Using the two-circles half method, the number of catheters in a good position was 0 in 3 cases, 1 in 19 cases, and 2 in 14 cases. The mean ages in each case were 58.0, 67.1, and 69.6, respectively, with p-value of 0.403. Midline shifts seen in each case were 6.0±2.3 mm, 7.7±3.9 mm, and 6.9±3.9 mm, respectively, with p-value of 0.712. Mean hematoma volumes on admission in each case were 60.9±12.7 cc, 70.8±23.3 cc, and 72.1±21.3 cc, respectively, with p-value of 0.722. Mean GCS scores on admission in each case were 10.3±2.5, 11.7±2.5, and 10.8±2.8, respectively, with p-value of 0.517. The average times from initial onset to operation in each case were 4.3±2.7 h, 5.4±5.1 h, and 3.4±1.7 h, respectively, with p-value of 0.378. The intraventricular hemorrhage (IVH) portions among total hematoma in each case were 67%, 89%, and 50%, respectively, with p-value of 0.042. Systolic blood pressure measurements in each case were 146.7±30.6 mmHg, 153.8±35.6 mmHg, and 180.7±27.3 mmHg, respectively, with p-value of 0.051 (Table 1). As there were few cases with 0 catheters, we compared cases with two catheters and one catheter. In cases with one catheter, the average difference between the hematoma volume on POD 3 and POD 0 was 32.7 cc (Table 2). In cases with two catheters, the average difference was 36.8 cc, with no significant difference. In cases evaluated using the 1-cm margin method, the number of catheters in a good position was 0 in 4 cases, 1 in 19 cases, and 2 in 13 cases. In cases evaluated using the 1-cm margin method, the numbers of catheters in a good position were 0 in 4 cases, 1 in 19 cases, and 2 in 13 cases, respectively. The mean ages were 55.3±15.9, 69.1±9.7, and 68.4±16.1, respectively, with p-value of 0.159. Midline shifts seen in each case were 6.3±2.0 mm, 6.7±3.4 mm, and 8.3±4.5 mm, respectively, with p-value of 0.438. The IVH portions amongst total hematoma in each case were 75%, 68%, and 77%, respectively, with p-value of 0.873. Mean hematoma volumes on admission in each case were 53.2±2.9 cc, 70.7±21.8 cc, and 75.6±22.8 cc, respectively, with p-value of 0.196. Mean GCS scores on admission in each case were 11.5±2.6, 11.8±2.2, and 10.3±3.0, respectively, with p-value of 0.279. The average times from initial onset to operation in each case were 2.9±1.8 h, 5.6±5.1 h, and 3.4±1.7 h, respectively, with p-value of 0.237. Systolic blood pressure measurements in each case were 170.0±47.6 mmHg, 160.6±34.5 mmHg, and 166.2±32.3 mmHg, respectively, with p-value of 0.846 (Table 3). As there were few cases with 0 catheters, we compared cases with two catheters and one catheter. In cases with one catheter, the average difference between the hematoma volume on POD 3 and POD 0 was 33.5 cc, and in cases with two catheters, the average difference was 40.0 cc, which was slightly high. However, there was no significant difference (Table 4). Since changes in the hematoma volume were maximal between PODs 0 and 3, we chose to compare those values.
Table 1.
Clinical characteristics of patients in the two-circles half method
![]()
Table 2.
Average of the difference in hematoma volume between postoperative days 3 and 0 in the two-circles half method
![]()
Table 3.
Clinical characteristics of patients in the 1-cm margin method.
![]()
Table 4.
Average of the difference in hematoma volume between postoperative days 3 and 0 in the 1-cm margin method.
![]()
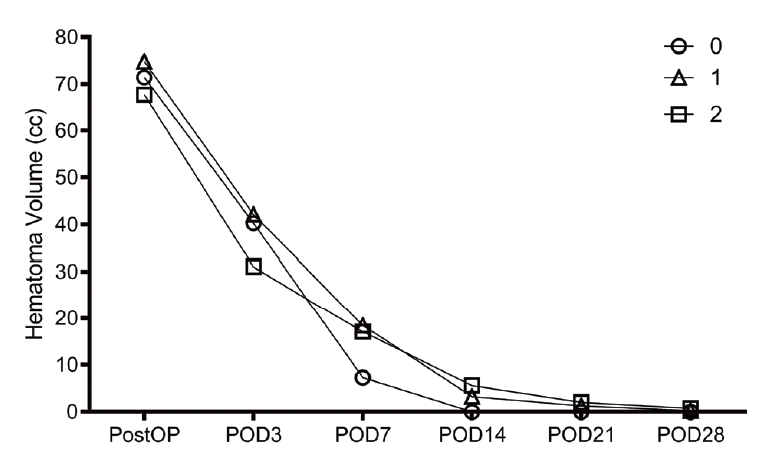
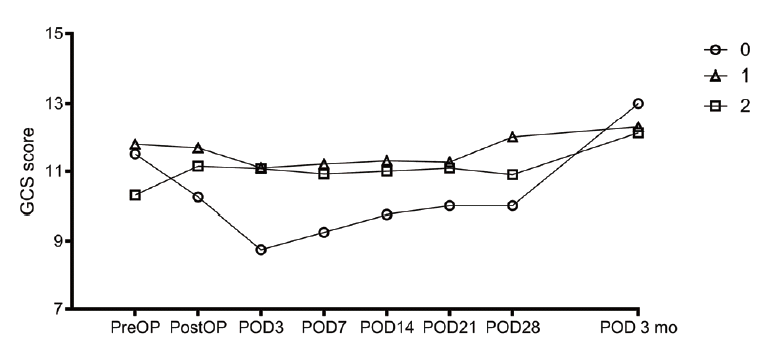
The change of hematoma volume and the change in GCS score compared with the two-circle half method are shown in figures (Figs. 4 and 5). In cases with two catheters, the change appeared to decrease more steeply, but there was no significant difference.
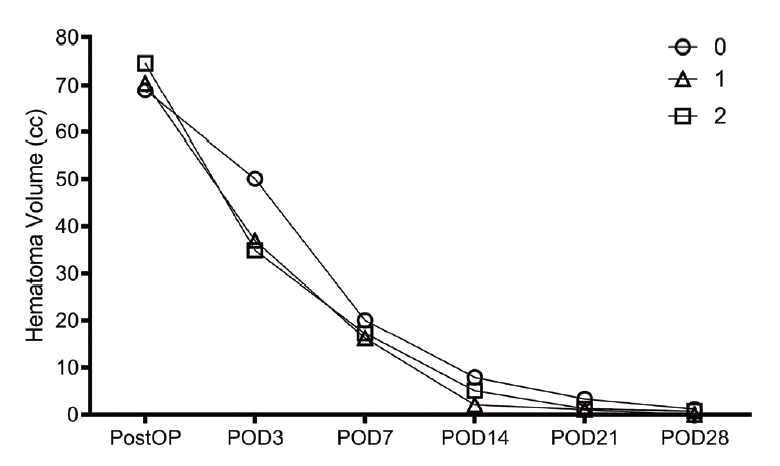
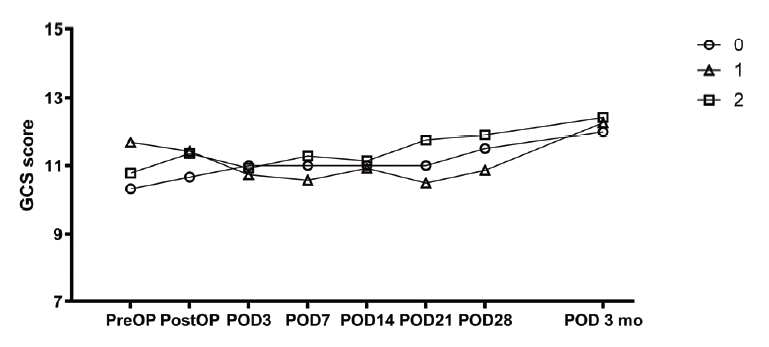
The change in blood loss and the change in GCS score compared with the 1-cm margin method are shown in figures (Figs. 6 and 7). In the cases of two catheters, the change appeared to decrease more steeply, but there was no significant difference.
Go to :
DISCUSSION
In most studies, stereotactic aspiration was performed by targeting the catheter toward the center or median of the hematoma [2,7,15,16]. It is difficult to explain the location of the catheter inside the hematoma logically. The shape and location of the hematoma vary, and the catheter has several holes, thereby making it difficult to set the exact location. Hence, we explained it using the two-circle half method and 1-cm margin method, which have not yet been explained to date. The two-circle half method evaluates how closer the tube is to the center of the hematoma, with a greater effect on hematoma reduction. The 1-cm margin method evaluates how the tube’s location affects the loss of hematoma volume, even when several holes in the tube are located in the brain because the tube’s location is close to the hematoma margin.
According to the recently announced efficacy and safety of minimally invasive surgery with thrombolysis in intracerebral hemorrhage evacuation (MISTIE III) trial, the placement accuracy was classified into three categories. The good position is when it is on the long axis of the hematoma, and the suboptimal position is when it is off the long axis. The poor position is when it is not in the hematoma. In that trial, the probabilities of each position were 58%, 28%, and 14%, respectively [3,5]. It is difficult to place the catheter correctly in minimally invasive surgery using stereotactic aspiration plus urokinase for intracerebral hemorrhage evacuation. The hematoma shape can vary, and it can be difficult to determine its center. Moreover, the size and shape of the hematoma may change before or during surgery. The position of the catheter may vary depending on the experience of the operator [3]. When the postoperative CT scan shows that the catheter is not in the desired position, it is not easy to readjust the catheter. There may be situations when the surgery must be repeated, and in some cases, the hole may need to be redrilled. However, we could not find any literature on the prognoses of patients undergoing stereotactic aspiration in which the catheter was not inserted into the hematoma. According to this report, if the catheter was only inside the hematoma, some location change did not have much effect on hematoma disappearance. Brain swelling due to brain edema proceeds around ICH] [9,18]. When the catheter enters, the pressure decreases only at that location, and brain swelling is expected to push the hematoma to the location where the catheter is located. For this reason, it appears that if the catheter enters only the hematoma, the hematoma is well removed even if it is not in the center.
It was difficult to set standards for the catheter tip’s good or poor position and obtain meaningful results due to the small number of cases.
Go to :
CONCLUSIONS
We compared the differences in ICH amount removal by analyzing the catheter position by two methods; that is to say, the two-circle half method and the 1-cm margin method, during stereotactic ICH evacuation. According to our results, hematoma volume difference between PODs 0 and 3 in terms of cc and % showed no significant differences regardless of the number of catheters inserted in good positions. This infers that the removal rate is similar if the catheter tip is simply within the hematoma.
Go to :
 XML Download