Highlights
INTRODUCTION
METHODS
Study population
Assessment of demographic and anthropometric information
Measurement of blood biomarkers
Calculation of normalized creatinine-to-cystatin C ratio and other parameters
Assessment of muscle strength
Statistical analysis
RESULTS
Baseline characteristics of enrolled participants
Table 1.
| Variable | Total |
Tertiles of normalized creatinine-to-cystatin C ratio |
P valuea | ||
|---|---|---|---|---|---|
| Lowest (0.10±0.01) | Middle (0.13±0.008) | High (0.18±0.03) | |||
| No. of participants | 5,055 | 1,685 | 1,685 | 1,685 | |
| Age, yr | 60.0±9.7 | 60.3±10.0 | 60.0±9.5 | 59.6±9.7 | 0.119 |
| Male sex | 2,372 (46.9) | 696 (41.3) | 814 (48.3) | 862 (51.2) | <0.001 |
| Smokingb | 1,987 (39.3) | 585 (34.7) | 686 (40.7) | 716 (42.5) | <0.001 |
| Drinking | 1,643 (32.5) | 478 (28.4) | 572 (33.9) | 593 (35.2) | <0.001 |
| Presence of | |||||
| Hypertension | 1,987 (39.3) | 788 (46.8) | 689 (40.9) | 510 (30.3) | <0.001 |
| Dyslipidemia | 1,958 (38.7) | 708 (42.0) | 626 (37.2) | 624 (37.0) | 0.003 |
| Heart diseaseb | 531 (10.5) | 234 (13.9) | 160 (9.5) | 137 (8.1) | <0.001 |
| BMI, kg/m2 | 23.2±3.4 | 25.2±3.4 | 23.0±2.8 | 21.3±2.7 | <0.001 |
| SBP, mm Hg | 130.1±20.1 | 133.1±20.3 | 130.3±20.1 | 126.8±19.4 | <0.001 |
| DBP, mm Hg | 75.0±11.1 | 76.5±11.2 | 75.2±11.0 | 73.4±10.8 | <0.001 |
| MAP, mm Hg | 93.4±13.0 | 95.3±13.1 | 93.6±12.9 | 91.2±12.6 | <0.001 |
| FPG, mg/dLc | 100.5±10.9 | 100.8±10.5 | 100.4±10.7 | 100.2±11.4 | 0.227 |
| HbA1c, % | 5.1±0.4 | 5.1±0.4 | 5.1±0.4 | 5.1±0.4 | 0.023 |
| HbA1c, mmol/mol | 32±4.4 | 32±4.4 | 32±4.4 | 32±4.4 | 0.023 |
| METS-IRc | 34.4±7.1 | 37.8±7.1 | 33.9±6.1 | 31.4±6.4 | <0.001 |
| TC, mg/dL | 192.6±37.5 | 189.2±37.6 | 192.3±36.5 | 196.3±38.3 | <0.001 |
| TG, mg/dL | 121.7±74.1 | 121.6±67.4 | 119.6±69.6 | 124.1±84.0 | 0.210 |
| HDL, mg/dL | 52.0±14.7 | 49.6±13.3 | 52.4±14.6 | 54.1±15.9 | <0.001 |
| LDL, mg/dL | 117.1±34.1 | 117.2±34.7 | 117.5±33.2 | 116.7±34.5 | 0.812 |
| UA, mg/dL | 4.4±1.2 | 4.3±1.2 | 4.4±1.2 | 4.5±1.3 | <0.001 |
| Cr, mg/dL | 0.77±0.18 | 0.71±0.17 | 0.77±0.16 | 0.84±0.18 | <0.001 |
| eGFR, mL/min/1.73 m2 | 79.5±9.5 | 82.7±10.5 | 79.2±8.4 | 76.4±8.4 | <0.001 |
| hs-CRP, mg/Ld | 2.4±6.0 | 3.0±6.9 | 2.3±6.3 | 2.0±4.4 | <0.001 |
Values are presented as mean±standard deviation or number (%).
BMI, body mass index; SBP, systolic blood pressure; DBP, diastolic blood pressure; MAP, mean arterial pressure; FPG, fasting plasma glucose; HbA1c, glycosylated hemoglobin; METS-IR, the metabolic score for insulin resistance; TC, total cholesterol; TG, triglyceride; HDL, high-density lipoprotein; LDL, low-density lipoprotein; UA, uric acid; Cr, creatinine; eGFR, estimated glomerular filtration rate; hs-CRP, high-sensitivity C-reactive protein.
Normalized creatinine-to-cystatin C ratio and risk of diabetes
Table 2.
| Variable |
Normalized creatinine-to-cystatin C ratio |
|||
|---|---|---|---|---|
| Lowest (tertile 1) | Middle (tertile 2) | Highest (tertile 3) | Per 1 SD higher | |
| Total no. | 1,685 | 1,685 | 1,685 | 5,055 |
| No. of cases | 261 | 196 | 177 | 634 |
| Model 1a | 1 (ref) | 0.72 (0.59–0.88) | 0.64 (0.52–0.79) | 0.85 (0.78–0.94) |
| Model 2b | 1 (ref) | 0.74 (0.60–0.90) | 0.66 (0.54–0.81) | 0.87 (0.79–0.95) |
| Model 3c | 1 (ref) | 0.81 (0.65–0.99) | 0.76 (0.61–0.94) | 0.91 (0.83–0.99) |
c Adjusted for age, gender, history of smoking and drinking, presence of hypertension, dyslipidemia, and heart disease, mean arterial pressure, glycosylated hemoglobin, total cholesterol/high-density lipoprotein, triglyceride, low-density lipoprotein, uric acid, and high-sensitivity C-reactive protein.
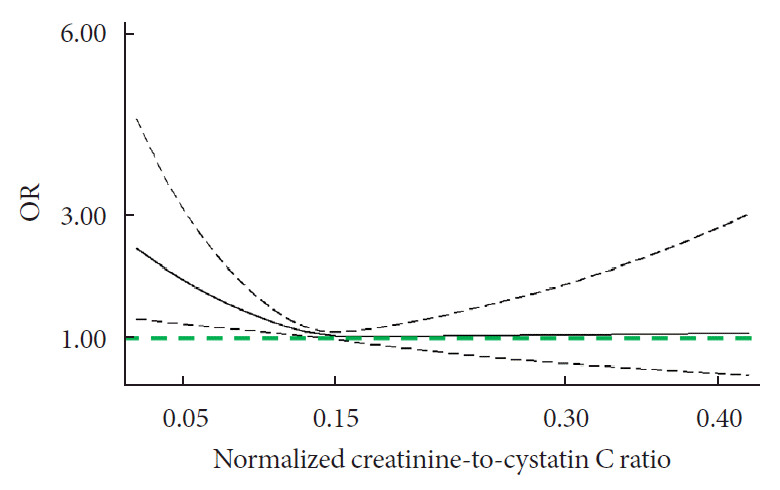
Fig. 1.

Subgroup and joint analyses
Table 3.
| Variable |
Overweight/obesity (BMI ≥24 kg/m2) |
Normal-weight (BMI <24 kg/m2) |
||
|---|---|---|---|---|
| Low NCCR | High NCCR | Low NCCR | High NCCR | |
| Total no. | 1,048 | 857 | 637 | 2,513 |
| No. of cases | 188 | 149 | 73 | 224 |
| Model 1a | 1 (Ref) | 0.96 (0.76–1.22) | 0.59 (0.44–0.79) | 0.45 (0.36–0.55) |
| Model 2b | 1 (Ref) | 1.01 (0.79–1.28) | 0.56 (0.42–0.75) | 0.44 (0.36–0.55) |
| Model 3c | 1 (Ref) | 0.95 (0.74–1.22) | 0.77 (0.56–1.05) | 0.62 (0.49–0.78) |
Values are presented as odds ratio (95% confidence interval). Low NCCR referred to the lowest tertile of NCCR, and high NCCR was defined as the middle and highest tertiles.
BMI, body mass index; NCCR, normalized creatinine-to-cystatin C ratio.
c Adjusted for age, gender, history of smoking and drinking, presence of hypertension, dyslipidemia, and heart disease, mean arterial pressure, glycosylated hemoglobin, total cholesterol/high-density lipoprotein, triglyceride, low-density lipoprotein, uric acid, and high-sensitivity C-reactive protein.
Mediation analysis
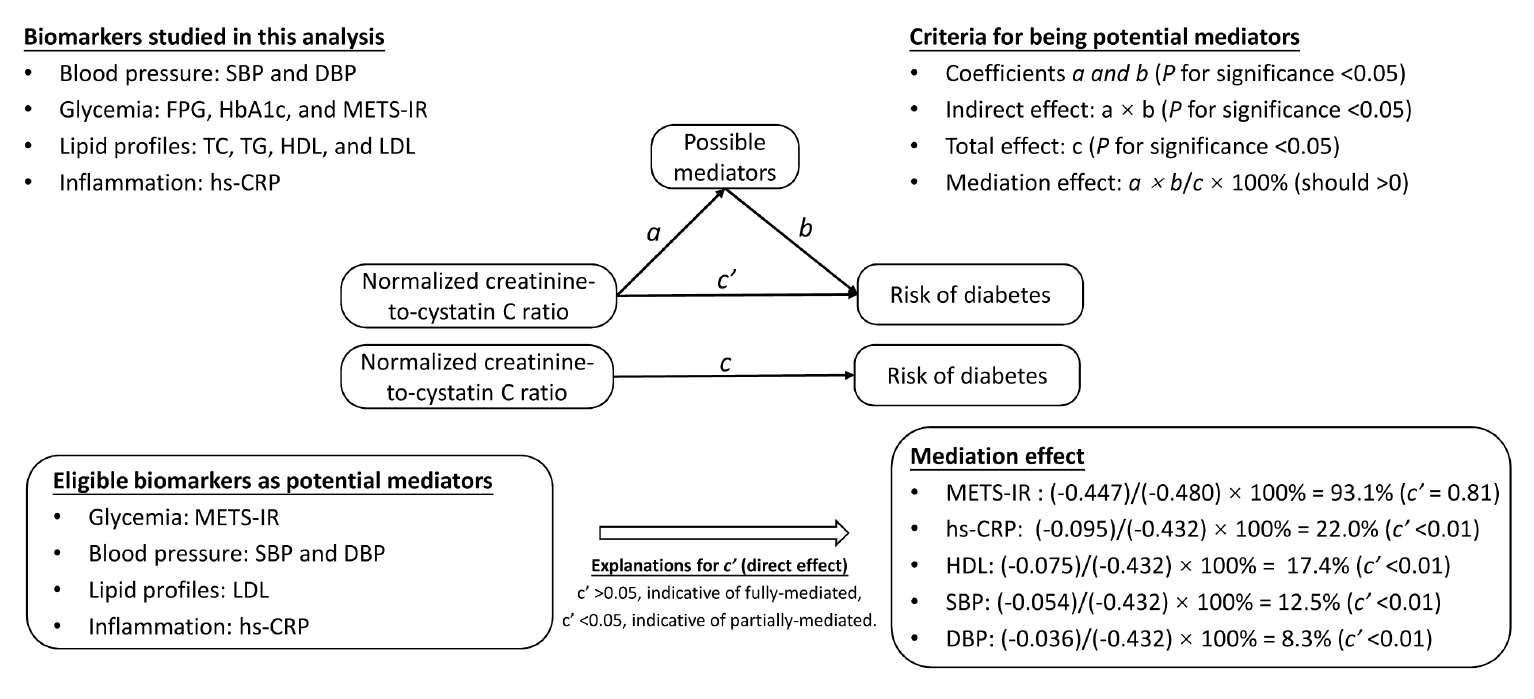
Fig. 2.

Table 4.
| Independent variable |
Simple linear regression analysis Independent variable |
Multivariable linear regression analysisa |
||
|---|---|---|---|---|
| Sβ | P value | Sβ’ | P value | |
| SBP | –0.11 | <0.001 | –0.11 | <0.001 |
| DBP | –0.09 | <0.001 | –0.10 | <0.001 |
| FPG | –0.01 | 0.553 | –0.006 | 0.679 |
| HbA1c | –0.03 | 0.086 | –0.02 | 0.120 |
| METS-IR | –0.34 | <0.001 | –0.35 | <0.001 |
| TC | 0.11 | <0.001 | 0.12 | <0.001 |
| TG | 0.07 | <0.001 | 0.07 | <0.001 |
| HDL | 0.10 | <0.001 | 0.10 | <0.001 |
| LDL | –0.0001 | >0.999 | 0.009 | 0.518 |
| UA | 0.07 | <0.001 | 0.06 | <0.001 |
| eGFR | –0.30 | <0.001 | –0.41 | <0.001 |
| hs-CRPb | –0.14 | <0.001 | –0.15 | <0.001 |
Sβ, standardized regression coefficient; SBP, systolic blood pressure; DBP, diastolic blood pressure; FPG, fasting plasma glucose; HbA1c, glycosylated hemoglobin; METS-IR, the metabolic score for insulin resistance; TC, total cholesterol; TG, triglyceride; HDL, high-density lipoprotein; LDL, low-density lipoprotein; UA, uric acid; eGFR, estimated glomerular filtration rate; hs-CRP, high-sensitivity C-reactive protein.


 PDF
PDF Citation
 Print
Print


 XML Download