

 PDF
PDF Citation
 Print
Print


INTRODUCTION
Coronavirus disease 2019 (COVID-19) has developed into a global pandemic since its initial outbreak in December 2019.1 In South Korea, the first case of COVID-19 was confirmed on January 20, 2020,2 and in mid-February, an outbreak in Daegu and Gyeongsangbuk-do led to a surge of 8,164 patients.2 Accordingly, the South Korean government implemented a high-level national response to suppress the spread of COVID-19 at the beginning of the pandemic.3 This response strategy included rapid diagnostic testing, rapid epidemiological investigations and close contact tracing, patient triage and isolation, and treatment systems.
Viral respiratory infections are primarily spread through the air by respiratory droplets from infected people coughing or sneezing, or through feces or in the environment.4 In South Korea, some acute respiratory infections have been designated as grade 4 infectious diseases, and subsequently undergo pathogen surveillance based on laboratory tests as well as patient monitoring in the clinical setting. Laboratory surveillance involves taking oropharyngeal and nasopharyngeal swab samples from patients with influenza and other respiratory infections who attend the hospitals which have agreed to participate in the sampling and surveillance. Samples are collected every Monday and Tuesday and are sent to the Incheon Metropolitan City Institute of Public Health and Environment for testing; respiratory virus-specific genes are detected and reported weekly through real-time reverse transcription polymerase chain reaction (RT-PCR) (Fig. 1).5 This surveillance system is called the Korea Influenza and Respiratory Viruses Surveillance System (KINRESS). Laboratory surveillance projects for eight types of viruses including human influenza virus (IFV), ADV, parainfluenza virus (PIV), respiratory syncytial virus (RSV), human rhinovirus (hRV), human coronavirus, human bocavirus (BoV), and human metapneumovirus (MPV), are operating in 17 cities through provincial institutes of public health and environment research, together with the Korea Disease Control and Prevention Agency (KDCA), affiliated hospitals, clinics, and related organizations. These projects contribute to strengthening the pathogen surveillance system by identifying the pathogenic causes of acute respiratory infections, conducting comprehensive analysis of epidemic patterns, and providing information to prepare measures to limit the spread.5
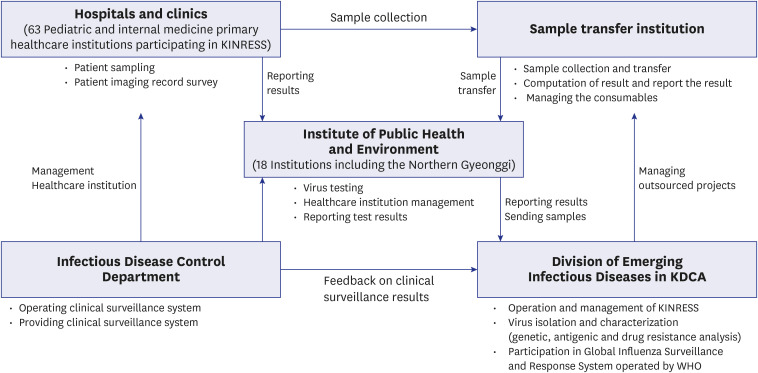 | Fig. 1Systematic diagram of the KINRESS project (Source: Respiratory Infectious Disease Control Guidelines for 2021).5KDCA = Korea Disease Control and Prevention Agency, KINRESS = Korea Influenza and Respiratory Viruses Surveillance System, WHO = World Health Organization.
|
In South Korea, the outbreak of COVID-19 led to the strict implementation of non-pharmacological interventions (NPIs) such as mask use, social distancing, and contact precautions including hand hygiene.3 Such measures were also expected to influence the spread of other respiratory viruses transmitted through droplets or contact in general. Identifying the changes in the respiratory virus isolation trends after NPIs will lead to increasing knowledge of the lifecycle and transmission of each virus. Furthermore, NPIs can be a strong weapon to deal with such respiratory viruses.
This study aims to identify the changes in the respiratory virus isolation trend in Incheon Metropolitan City after the implementation of comprehensive and extensive NPIs.
Go to : 
METHODS
Subjects
In Incheon Metropolitan City, two hospitals were already participating in KINRESS prior to this study, and one more hospital was added in 2020 to set an appropriate sample size for the population. Currently, a total of three hospitals are participating in preparing basic data for the occurrence and prevalence of acute respiratory infections. Due to a decrease in the number of samples requested by hospitals participating in KINRESS since the COVID-19 outbreak, additional tests were conducted6 on samples from patients with respiratory symptoms, and positive samples for COVID-19 were among the samples requested for COVID-19 testing to increase the effectiveness of the laboratory surveillance project. The subjects of this study included respiratory samples from three hospitals participating in Incheon Metropolitan City’s KINRESS project from January 2018 to December 2021, as well as samples from symptomatic COVID-19 positive and negative patients with fevers of 38°C or higher, requested by the Incheon Metropolitan City Institute of Public Health and Environment from September 2020 to December 2021. The samples were tested for eight types of respiratory and IFVs, which included the following: ADV, human BoV, hRV, human coronavirus, PIV, RSV, human MPV, influenza A virus, and influenza B virus.
Sample testing
The oropharyngeal or nasopharyngeal swab samples of the patients were transferred using a virus transport medium at 4°C. Following RNA extraction, virus-specific genes were detected by real-time RT-PCR (Fig. 2). The test was conducted according to the standard procedure for respiratory virus and influenza diagnostic test methods, following the standards of the 2021 respiratory infectious disease management guidelines and influenza management guidelines.
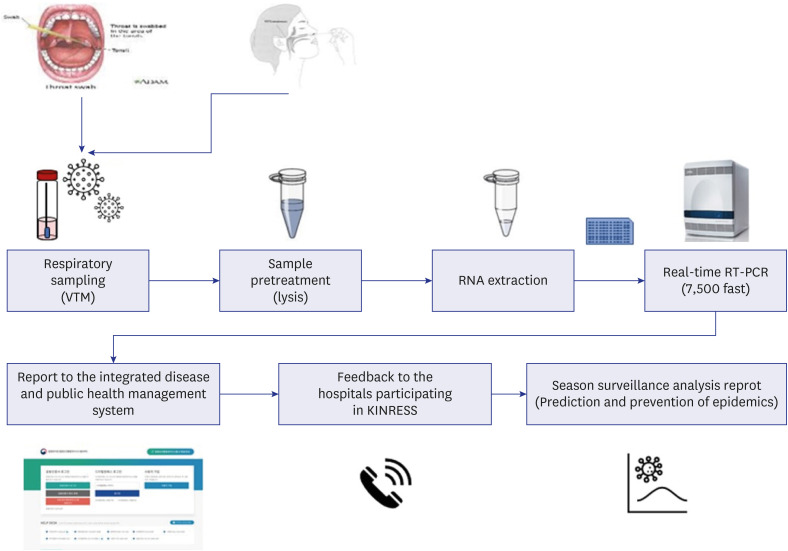
(1) RNA extraction
After homogenizing the Viral Transport Media containing the specimen, 60 uL of RNA was extracted from 140 uL using the membrane filter method (miniviral RNA kit; QIAGEN, Hilden, Germany).
(2) Real-time RT-PCR
After adding 5 uL of the extracted RNA into a real-time PCR premix (KOGENE, Seoul, Korea) for each virus, the process of reverse transcription was carried out as follows: The first cycle was run at 50°C for 30 minutes, and the second involved initial denaturation at 95°C for 10 minutes, 1 cycle. The third step had denaturation at 95°C for 15 seconds, and annealing/extension 60°C for 1 minute were performed for 40 cycles to check the target gene value. The threshold reference value was 0.2, which was determined by the threshold cycle (Ct) value. When the Ct value was ≤ 37, it was judged as positive (only RV had a Ct value of ≤ 35), and the accuracy was examined by testing the negative control and the positive control concurrently. Thermo Fisher Scientific, Applied Biosystems 7500 Fast (Thermo Fisher Scientific, Waltham, MA, USA) was used for analysis.
Statistical analysis
Results are expressed as mean ± standard deviation (SD). Student’s t-test and Mann-Whitney test were used to compare continuous variables. The χ2 test and Fisher’s exact test were used for categorical variables. All P values were reported to three decimal places, and P values of < 0.050 were considered significant. A collinearity test was also performed to exclude the possibility of cross-influences. When the median and interquartile ranges (IQRs) were reported, the median was assumed to reflect the mean, and IQR was assumed to be 1.35 SD. IBM SPSS statistics software for Windows (version 24; SPSS Inc., Chicago, IL, USA) was used for the analyses.
Ethics statement
The present study protocol was reviewed and approved by the Institutional Review Board of Gil Medical Center (approval No. GFIRB2022-057) with waived informed consent.
Go to :
RESULTS
As a result of the respiratory virus pathogen surveillance in Incheon Metropolitan City, 3,334 KINRESS and COVID-19 testing samples were collected from January 2018 to December 2021. The samples included 1,955 upper respiratory tract samples from patients with respiratory symptoms who visited the hospitals participating in KINRESS, as well as 833 severe acute respiratory syndrome coronavirus-2 (SARS-CoV-2) negative samples and 546 SARS-CoV-2 positive samples from patients with respiratory symptoms. There were 1,379 samples of symptomatic patients with fever. When calculated by year, 574 cases of KINRESS samples were secured in 2018 and 689 cases in 2019. In 2020, a total of 1,043 samples (309 KINRNESS samples and 734 samples from patients with respiratory symptoms through public health centers) were secured. In 2021, a total of 1,028 samples (383 samples from KINRESS and 645 samples from public health centers) were secured.
During the investigation period, 1,469 viruses were isolated from a total of 3,334 samples requested from the Incheon Metropolitan City Institute of Public Health and Environment, showing a virus detection rate of 44.1% out of the total number of tests. There are obvious changes in virus detection before and after NPIs. The detection rate by year decreased from 69.5% (399/574) in 2018 and 73.3% (505/689) in 2019 to 19.8% (206/1,043) in 2020 and 34.9% (365/1,028) in 2021 (Table 1). In 2020, the number of hospitals participating in the KINRESS project increased by one, but the number of samples requested decreased from 574 samples in 2018 and 689 samples in 2019 to 309 samples in 2020 and 383 samples in 2021, by about half compared with 2019. Therefore, from September 2020 to September 2021, a total of 833 SARS-CoV-2 negative samples (including 338 samples in 2020 and 495 samples in 2021) from patients with respiratory symptoms were obtained and tested. Eighty-nine respiratory virus isolates were identified: ADV in five samples, BoV in eight samples, PIV in 10 samples, and MPV in one sample, with RV the most commonly identified in 65 samples (73.0%). Testing of SARS-CoV-2 negative samples conducted by the KDCA from week 44 in 2020 revealed three types of respiratory viruses: 12.2% were RVs, 1.3% were ADVs, and 0.8% were BoVs—showing a consistent trend with the nationwide surveillance project.5
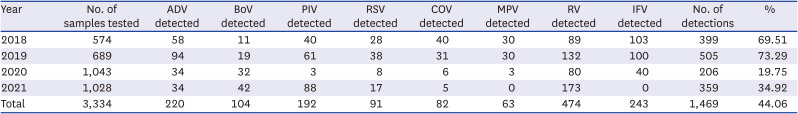
Table 1
Number of monthly respiratory virus detections and detection rates (total), 2018–2021
ADV = adenovirus, BoV = bocavirus, PIV = parainfluenza virus, RSV = respiratory syncytial virus, COV = coronavirus, MPV = metapneumovirus, RV = rhinovirus, IFV = influenza virus.
![]()
In addition, samples from symptomatic patients among the COVID-19 confirmed cases in Incheon Metropolitan City were also tested for respiratory viruses, with a total of 546 samples, including 396 samples in 2020 and 150 samples in 2021. In addition to SARS-CoV-2, other respiratory viruses were isolated in nine samples, including ADV in three samples, BoV in three samples, and RV in three samples (Table 2).
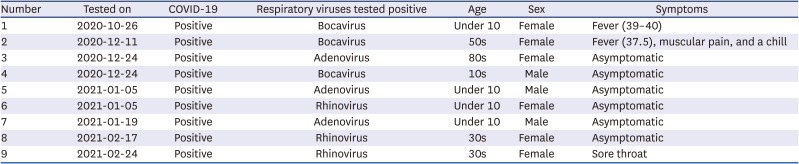
Table 2
Respiratory virus positive samples among COVID-19 positive samples, 2020–2021
![]()
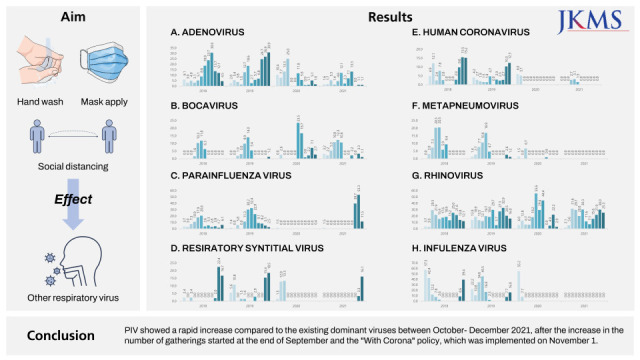
Comparing detection by year revealed that the prevalence of all eight respiratory viruses tended to decrease after NPI (2020–2021) compared with before NPI (2018–2019). Comparing the isolation rates by year showed that the average the isolation rate for ADV decreased from 11.53 ± 6.56% in 2018–2019 to 5.584 ± 3.54% in 2020–2021; and this decrease was statistically significant (P = 0.045). On average, BoV was isolated at 2.71 ± 4.45% in 2018–2019 and 4.4 3± 3.24% in 2020–2021 (P = 0.221), showing no further decrease but rather a slight increase after NPI. PIV was isolated at 9.09 ± 7.51% in 2018–2019 and 4.45 ± 9.05% in 2020–2021, showing an increasing trend again after October 2021. RSV was isolated at 4.24 ± 6.74% in 2018–2019, which reduced to 1.96 ± 3.12% in 2020–2021. Human COV was isolated at 4.99 ± 4.41% in 2018–2019, but was barely isolated at all by 2020–2021 (0.76 ± 1.09%), which was statistically significant (P = 0.009). MPV also showed a significant decrease in isolation from 4.75 ± 6.28% in 2018–2019 to 0.37 ± 0.96% in 2020–2021 (P = 0.035). RV was isolated at 17.67 ± 6.21% in 2018–2019 and 18.34 ± 10.30% in 2020–2021, showing an increasing trend (Table 3). IFV was isolated at 13.60 ± 14.33% in 2018–2019 and significantly decreased to 2.62 ± 7.94% in 2020–2021 (P = 0.006); it was detected in early 2020, but has not been detected since May 2020, when social distancing was implemented in earnest (Table 3, Fig. 3).
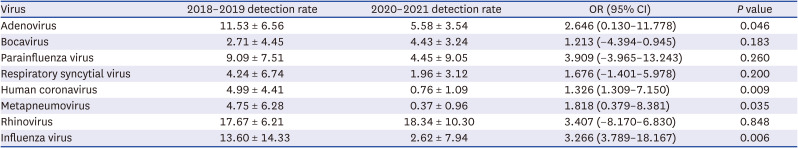
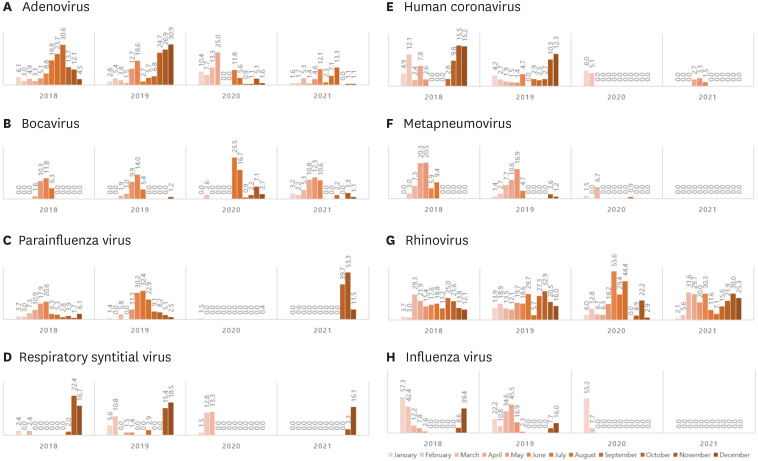
Table 3
Difference in detection rates before NPI (2018–2019) and after NPI (2020–2021)
Values are presented as mean ± standard deviation.
NPI = non-pharmacological intervention, OR = odds ratio, CI = confidential interval.
![]()
ADV, BoV, and RV were among the eight types of viruses surveyed, and showed no significant change in isolation, regardless of NPIs, whereas human coronavirus, PIV, RSV, human MPV, and influenza have either not been isolated or have significantly decreased since March 2020. Viruses that were significantly reduced were human MPV, human coronavirus, and IFV, all of which are enveloped viruses (Table 3, Fig. 3). On the other hand, parainfluenza was not isolated between February 2020 and August 2021, but was detected after the increase in the number of gatherings after the end of September and after implementation of the “Relaxing COVID19 and mitigation policy” on November 1; rising from 39.7% in October to 53.3% in November. This was in line with the nationwide trend, according to the KDCA 2021 report of the virus causing acute respiratory infection.7
Go to :
DISCUSSION
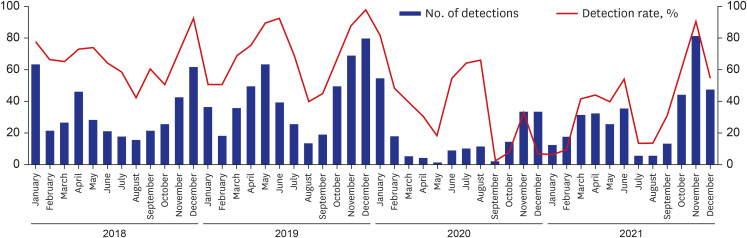
In 2020, the number of hospitals participating in the KINRESS project increased by one, but the number of samples requested decreased from 574 samples in 2018 and 689 samples in 2019 to 309 samples in 2020 and 383 samples in 2021, by about half compared with 2019. Since the COVID-19 pandemic in February 2020, visits to primary medical institutions have decreased as patients with respiratory symptoms started visiting places dedicated to COVID-19 testing and treatment, such as screening clinics, thereby reducing samples in the surveillance project. General detection rate was decreased, which was consistent with trends of another domestic study (Fig. 4).8
In some cases, ADV, BoV, and RV were simultaneously isolated from SARS-CoV-2 PCR positive samples. Although it is not possible to confirm whether the situation of simultaneous isolation indicates co-infection, it is necessary to continuously monitor the samples considering the possibility of co-infection with SARS-CoV-2 and other respiratory viruses, including the IFV. Case studies are required for samples from which multiple viruses are isolated. When co-infection with COVID-19 and other respiratory viruses occurs, the prognosis of the patient may be affected, and further deterioration or treatment may be required. In a meta-analysis of co-infections,910 RSV was the most frequently isolated, followed by influenza A, rhino, influenza B, parainfluenza, coronavirus, ADV, and MPV. These viruses were all under surveillance in this study. In addition to ADV and RV, co-infection was also confirmed with BoV, which was also consistent with overseas studies11 and domestic studies.1213
Although the degree varies between countries, NPIs such as wearing a mask and physical distancing have been implemented worldwide.1415161718 In almost all the studies, the IFV showed the most distinctly similar trend across different countries. IFV tended to decrease in most countries. In New Zealand, influenza-like illness significantly decreased and was found to be reduced by 99.9% during lock-down.9 Several measures implemented to reduce COVID-19 in Brazil have also wiped out influenza.19 In Turkey, rhino/enterovirus and MPV were dominant, while influenza was showing a decreasing trend.20
In South Korea, influenza that spreads through droplet transmission and all influenza-like illnesses decreased in terms of both hospitalization and incidence rates after the implementation of physical distancing.14 Other studies also show the same trends.2122 In Italy, in addition to detection, hospitalization and morbidity also tended to decrease.23 A statistically significant decrease in influenza was also observed in US, Chile, Israel, Australia, and South Africa,24 and IFV activity decreased by 64% in Singapore after the COVID-19 control method was initiated.19 A Chinese pediatric study also reported that MPV and IFV disappeared,25 and a decrease in IFV activity of up to 93% was reported in Northern California.26 In this study, IFV also showed a sharply decreasing trend, with the average annual detection rate decreasing from 13.60 ± 14.33% in 2018–2019 before physical distancing for the prevention of COVID-19 was implemented, to 2.62 ± 7.94 in 2020–2021, odds ratio 3.266 (3.789–18.167), after implementing physical distancing and mask use.
Although there is ongoing research into the cause of the pronounced decrease in influenza, one hypothesis is that NPI has a greater effect on influenza than other viruses, as it used to be the dominant virus prior to COVID-19. A study in Austria reported that as the coronavirus became dominant, other respiratory viruses decreased.27 A study in the UK found that COVID-19 became the dominant virus in 54%11 of total identified respiratory viruses, and another study in Austria reported that lockdown and release influenced changes in the dominant viruses,28 which supported this. Considering the shift in bacterial infection seen in healthcare-associated infections (HAIs), there is sufficient evidence to hypothesize that a sudden increase in one type of respiratory virus in a specific group will lead to a decline in the other viruses. A laboratory study would be useful in confirming this. In a systemic review conducted during the SARS period, there were reports that the detection of respiratory viruses was reduced by 91% after N95 mask use was introduced.24 If a similar effect could be studied in “social distancing,” it would be helpful to identify the cause.
In this study, RSV did not show a clear decreasing trend; however, in an early 2020 pandemic impact study in Singapore, RSV and IFV tended to decrease.29 In our study, IFV disappeared, but RSV was consistently detected even after NPI implementation. In studies conducted in Northern California26 and with Chinese children,30 RSV showed a trend consistent with this study, as the decreasing trend was not clear. This trend was especially common in children with respiratory viruses, which was also consistent with this study.30
MPV was significantly decreased in this study. A Chinese pediatric study reported that ADV, MPV, and IFVs other than RSV disappeared,25 but another study in the Netherlands did not show a decreasing trend.31 Interestingly, in this Dutch study, laboratory tests showed an increase in MPV infection but no significant change was found. Considering that most studies, including this study, only performed PCR detection, further research is required to determine how the recorded infection rate differs from the actual infection. On the other hand, in an Italian study, MPV was significantly reduced when comparing PCR results of actual pediatric inpatients.23
In the present study, ADV, BoV, and RV showed steady detection rates, even after NPIs were implemented. In contrast, cases of human coronavirus started to decline after March 2020. A nation-wide study in South Korea demonstrated a similar trend.832 Interestingly, non-enveloped virus (hRV, human BoV, and human ADV) detection rates did not decrease much even after implementing NPIs for COVID-19, which was in line with the results of this study.32 Unlike the IFV (an enveloped virus), all three non-enveloped viruses (ADV, BoV, and RV) were continuously detected during the COVID-19 epidemic. These viruses can be released from infected vectors for up to two to three weeks and survive in the environment for a long time with strong resistance to disinfectants. They can also be spread through feces, in addition to respiratory secretions, leading to their continuous detection. In a study conducted in New Zealand, the reduction rate after NPI implementation was somewhat lower for non-enveloped viruses such as ADV, RV, and enterovirus compared with enveloped viruses such as influenza or MPV.9 In an Austrian study, annual epidemics ended after NPI for enveloped viruses such as MPV, RSV, and influenza27; even in Brazil, MPV and RSV with viral envelopes were rarely detected.19 In a pediatric study in China, enveloped viruses such as influenza, RSV, and PIV were significantly reduced,30 and in a study conducted in Turkey, RV, a non-enveloped virus, became dominant after lockdown.20 Although this study also aimed to statistically analyze the changes33 in virus detection rates according to the presence of viral envelopes, there was no statistical significance, requiring additional analysis with a larger number of samples.
There were viruses that surged post lockdown or physical distancing. PIV and RV show such trends. In this study, parainfluenza disappeared after the COVID-19 pandemic with a detection rate of 0.0% between February 2020 and August 2021. In October 2021, after the relaxation of physical distancing and increased movement of people, detection rose to 39.7%, 53.3%, and 11.5% (October, November, and December); more than the average of 10–20% before the epidemic. This was in line with the nationwide trend of the virus causing acute respiratory infection, according to a report by the KDCA in 2021.34 RV also increased to 3.3% (November) and 16.1% (December) after “with-COVID-19” policy. In a Dutch study, overall viruses such as ADV and RV decreased, but RV increased before ADV after lockdown.9 In an Austrian study, a tendency for RVs to re-increase was observed after relaxation of some of the lockdown regulations.27 Contrary to the significant decrease in IFV described above, viruses that were not dominant increased. Considering the superinfection observed in HAI, the hypothesis that when the IFV in a specific population decreases, other viruses become dominant also seems plausible.
This study has several advantages. First, a large volume of data collected over four years was analyzed, using more than 3,000 samples. Examining a large number of samples over a long period of time allowed for clearer identification of trends. Second, it was possible to analyze the samples not only in terms of the virus detection rate but also by the timing of physical distancing measures. Although hypothetical, the causes of the decreases and increases of specific viruses were speculated upon. It is helpful as a literature reference as it has sufficiently presented a similar trend through comparison with the results from domestic and foreign studies.
There are also several limitations in this study. First, it is based on laboratory findings from PCR results, not the results obtained through the analysis of virus culture, hospitalization, or analysis of actual morbidity. As in the Dutch study,9 there are cases where the actual disease morbidity results differ from the PCR results. However, as our results show a similar trend to other reports based on PCR results, without a significant difference between the results of this study and other studies analyzing the morbidity rates in South Korea and abroad, the large number of samples seems to compensate for this. Second, although a hypothesis was presented, our study has not proven whether the detection rate of each virus was actually affected by the presence or absence of a viral envelope or change in the dominant species. Both clinical and laboratory studies should be conducted to clarify this in the future.
Second, the number of people getting tested or presenting to outpatient clinics was substantially lower in 2020 than previous years. Since we added respiratory symptom samples through public health centers and public health center samples contain inpatient samples, the results of 2020 and 2021 may be different from those of only outpatients. The proportion of the total inpatients cannot be accurately calculated, thus the result can be somewhat different. However, only public health center samples were added, and most of the public health center samples consisted of outpatients. And IFV and ADV, which were detected a lot in inpatients in a previous domestic study,33 decreased in this study. Also, the total number was nearly double in 2020 and 2021 (1,043 samples and 1,028 samples, respectively), compared to 2018 and 2019 (574 samples and 689 samples, respectively) should be taken into account. It is noteworthy that a lower detection rate was obtained despite a higher number of samples being run.
Third, since most of the respiratory viruses targeted in our study are cause of mild respiratory diseases or fever diseases, it is difficult to rule out the possibility that they may have changed according to changes in medical care practices. Along with the implementation of the NPI, a shift in health care utilization for fever and respiratory diseases occurred in medical institutions, which may have reduced virus detection as people were restricted from visiting hospitals. To compensate for this possibility, we added a sample from a patient with respiratory symptoms and tested the sample nearly twice, and the detection rate was still low in the sample including the sample from the symptomatic person. So we judged that the actual virus was more likely to have decreased. The fact that it is difficult to know exactly whether the difference is due to changes in medical care practices or the difference in actual detection rate can be considered as a common limitation of this study as well as all the pathogen monitoring type research. For the development of the pathogen monitoring system, there must be a link with the clinical symptom/sign monitoring system. Linkage studies with more monitoring systems should be organized in the future.
Since the outbreak of COVID-19, despite global efforts such as social distancing, mask use, and coughing etiquettes to prevent the spread, the pandemic is ongoing due to the continued spread of COVID-19 and the emergence of mutated viruses. Understanding the survival rate, infectivity, and ecology of viruses according to their characteristics, studying the spread of the IFV epidemic, and analyzing trends in virus detection patterns prior to the COVID-19 epidemic is important for managing the COVID-19 outbreak. This study suggested that the virus had a great influence on the detection of seasonal respiratory viruses, just as it completely changed the lifestyle and culture of mankind.
In conclusion, laboratory analysis of respiratory virus samples collected between 2018–2021 revealed that, in addition to a reduction in COVID-19 detection, detection of respiratory viruses in general also decreased following the implementation of NPIs. This trend was more prominent in respiratory viruses such as IFV and RSV, which were previously considered dominant enveloped viruses, while the trend was somewhat less apparent in non-enveloped viruses such as hRV, human BoV, and human ADV. Some viruses (RV and PIV) that were not considered dominant even re-surged after the relaxation of physical distancing. Using our study result, we believe that we now better understand respiratory virus responses to NPIs, transmission of these viruses, and some of their life cycles. Further studies on the detection of viruses and changes in the actual infection pattern before and after the implementation of NPIs are very important.
Go to :
 XML Download