Introduction
Methods
1. Survey participants
2. Questionnaire
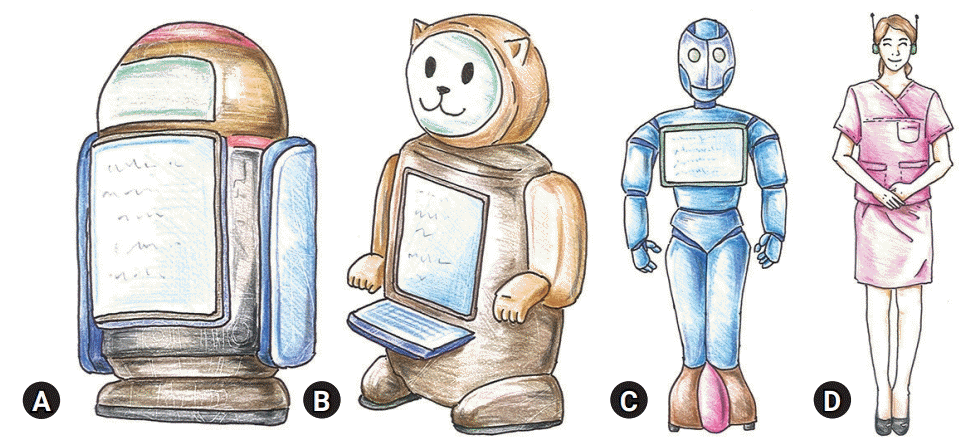
 | Fig. 1.List of the external appearance of medical service robots. (A) Cylindrical or square type with a screen, (B) animal type with a screen, (C) humanoid (a simplified human structure), and (D) android (very similar to human appearance). |
Table 1.
Table 2.
3. Statistical analysis
Results
1. Characteristics of participants
2. Preference for the external appearance of medical service robots
3. Perceptions of medical service robots
Table 4.
4. Expected utilization of services provided by medical service robots
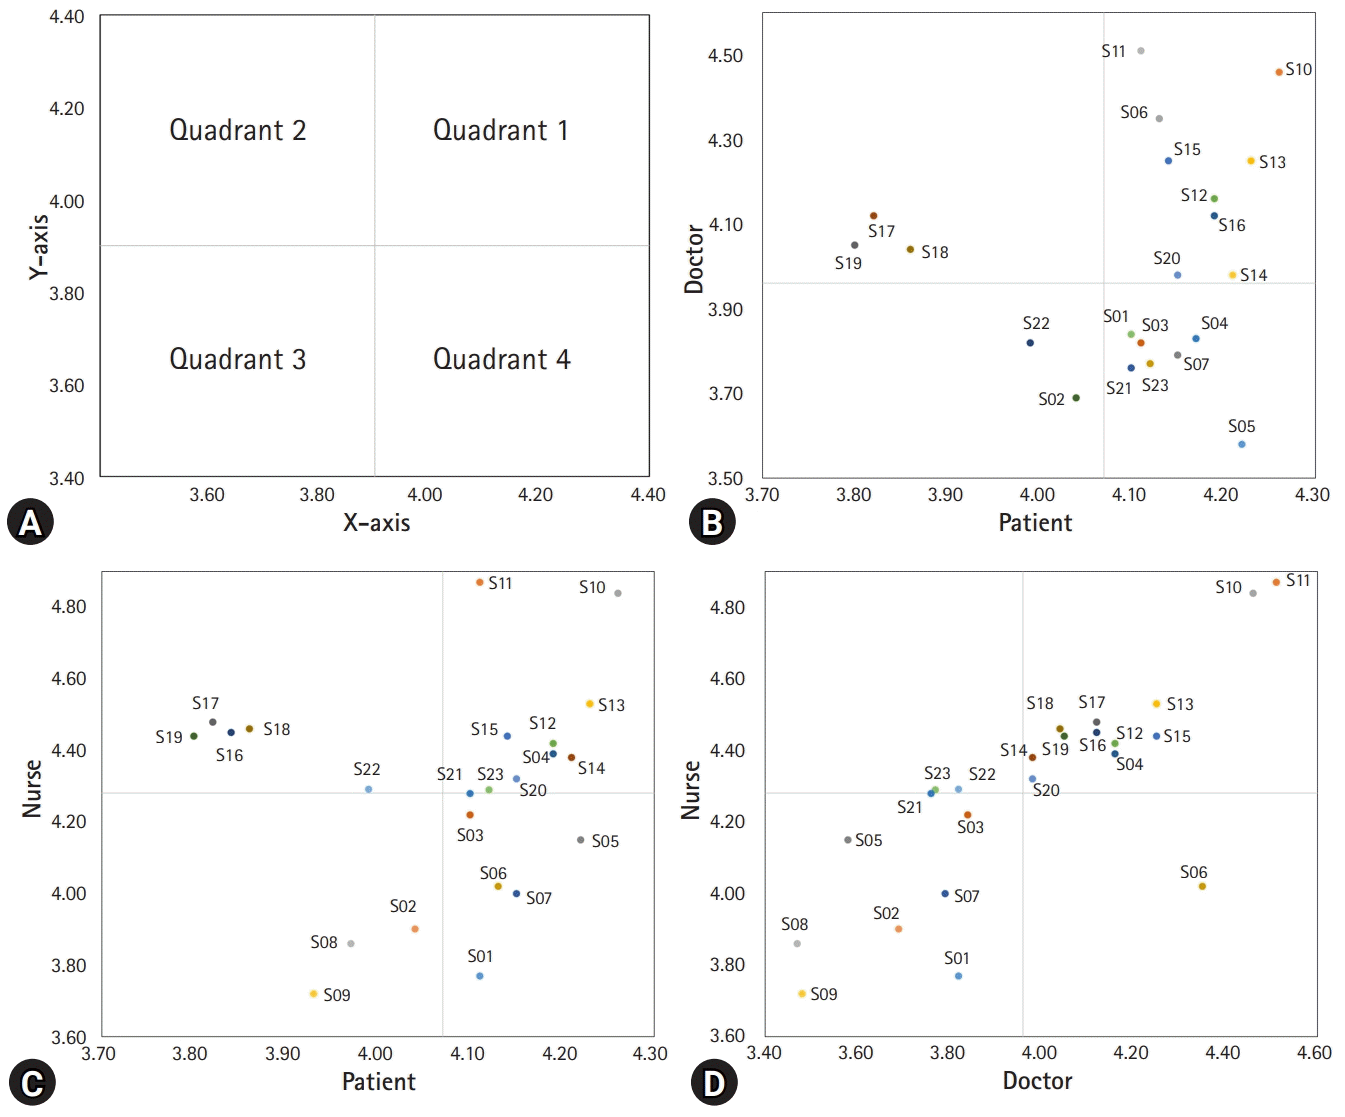
 | Fig. 2.Scatter plots for expected utilization. (A) Interpretation of a scatter plot. Items in quadrant 1 are preferred for both the x-axis and y-axis groups. Items in quadrant 2 are less preferred in the x-axis group but are more preferred in the y-axis group. Items in quadrant 3 are less preferred for both the x-axis and y-axis groups. Items in quadrant 4 are more preferred in the x-axis group but are less preferred in the y-axis group. (B) The scatter plot for the doctor-patient groups. (C) The scatter plot for the nurse-patient groups. (D) The scatter plot for the doctor-nurse groups. |


 PDF
PDF Citation
 Print
Print


 XML Download