

 PDF
PDF Citation
 Print
Print


INTRODUCTION
Sepsis is a life-threatening organ dysfunction caused by a dysregulated host response to infection.1 Although the prognosis of patients with sepsis has been improved due to advances in critical care management, mortality from sepsis remains high.2 Sepsis is associated with a deficit in effective blood volume, endothelial cell dysfunction, and fluid leakage into the interstitial space.34 Therefore, intravenous fluid resuscitation is a mainstay in the treatment of sepsis.5 However, as reported in previous studies, a positive fluid balance may be associated with worse prognosis.46 Therefore, to manage sepsis, it is important to assess the volume status of patients.
Plasma volume is associated with the regulation between interstitial and intravascular spaces and can be used as a marker for volume overload.7 Recently, Duarte et al.8 proposed to use a simple formula based on hemoglobin and hematocrit to estimate the plasma volume in patients with heart failure (HF). Previous studies have reported that a high estimated plasma volume status (ePVS) was related to a poor prognosis of patients with HF.910 Although previous studies have shown that the ePVS value on admission to the emergency department (ED) correlated with the risk of death in patients with fever or dyspnea,1112 few studies have evaluated its prognostic power in patients with sepsis or septic shock admitted to the intensive care unit (ICU).
Therefore, we conducted a prospective observational study to assess the prognostic power of ePVS in critically ill patients with sepsis who required admission to the ICU.
METHODS
Study population
This is a monocentric prospective observational study conducted in the ICU of the Seoul St. Mary’s Hospital, Korea (460,000 visits per year, 1,369 beds, and 20 medical ICU beds) from March 2019 to June 2020. During the study period, blood samples were collected from patients with sepsis on the day of the ICU admission (day 1). Sepsis was diagnosed according to the third international consensus definitions for sepsis and septic shock (Sepsis-3). Patients with a history of bleeding or transfusion within 3 days prior to the ICU admission were excluded. On day 1, Sequential Organ Failure Assessment (SOFA) and Simplified Acute Physiology Score 3 (SAPS3) scores were used as indicators of sepsis severity. We collected comorbidity data of the patients to calculate the Charlson comorbidity score index.13 The variables shown in Table 1 were measured and recorded on admission (day 1).
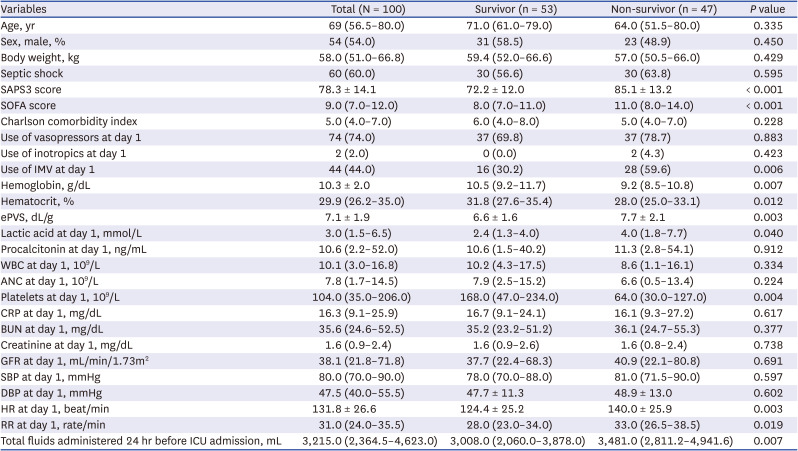
Table 1
Comparison of baseline characteristics of the study population at ICU admission (N = 100)
Values are presented as number (%) or mean ± standard deviation or median (interquartile range).
ICU = intensive care unit, SAPS3 = Simplified Acute Physiology Score 3, SOFA = sequential organ failure assessment, IMV = invasive mechanical ventilation, ePVS = estimated plasma volume status, WBC = white blood cells, ANC = absolute neutrophil count, CRP = C-reactive protein, BUN = blood urea nitrogen, GFR = glomerular filtration rate, SBP = systolic blood pressure, DBP = diastolic blood pressure, HR = heart rates, RR = respiratory rates.
![]()
ePVS measurement
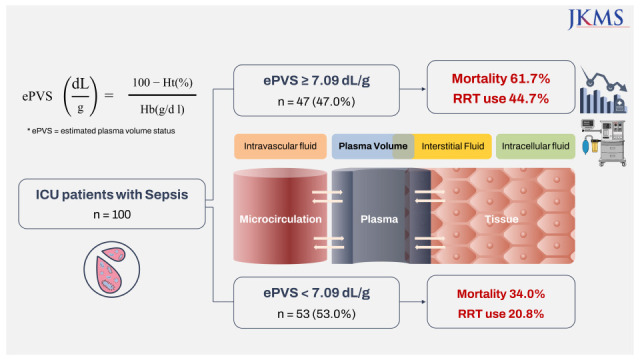
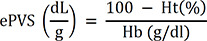
Blood samples were collected on admission to the ICU and a complete blood count (CBC) analysis was performed using the Sysmex analyzer (Sysmex XN-9000, Sysmex Co, Kobe, Japan). The ePVS value was calculated using the hematocrit and hemoglobin values from the CBC, using the following formula8:
Statistical analyses
All statistical analyses were performed using the R 4.0.2 version (R Foundation, Vienna, Austria). All results are reported as means ± standard deviations for normally distributed continuous variables and as medians and interquartile ranges (IQRs) for non-normally distributed continuous data. Categorical data are described as numbers and percentages. Patient characteristics were compared using the χ2 test or Fisher’s exact test for categorical variables, and independent samples t-tests for continuous variables. We performed linear regression to determine the association of ePVS with the amount of total fluids administered 24 hours before the ICU admission. Logistic regression analyses were performed to investigate associations between patient characteristics and in-hospital mortality. Clinical parameters with a P value of 0.05 in the univariate logistic regression were included in the multivariate logistic regression. Odds ratios (ORs) and the corresponding 95% confidence intervals (CIs) were computed. Goodness-of-fit was computed to assess the relevance of the logistic regression model. Receiver operating characteristic (ROC) curves were used to evaluate the ability of ePVS to predict in-hospital mortality. Probabilities of in-hospital survival for each group were estimated using the Kaplan-Meier method and compared using the log rank test. All tests were two-sided, and P values < 0.05 were considered statistically significant.
Ethics statement
This study was conducted in accordance with the relevant legislation and approved by the Ethics Committee of Seoul St. Mary’s Hospital (KC18DESI0739). The study complied with the Declaration of Helsinki and Good Clinical Practice Guidelines, and all patients provided informed consent for inclusion in the study.
RESULTS
Baseline characteristics
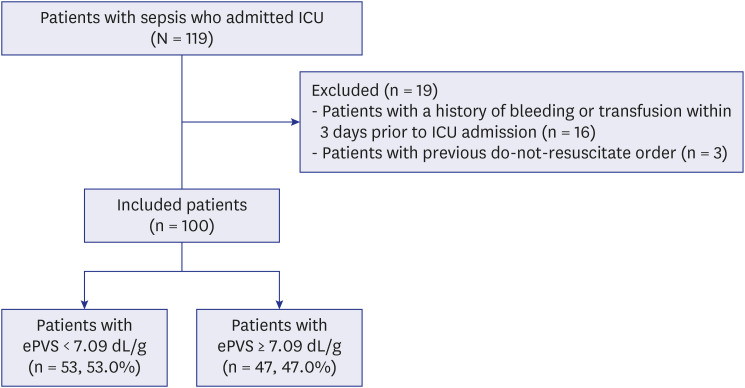
Of the 119 patients with sepsis admitted to our ICU from March 2019 to June 2020, 100 patients (54 men and 46 women), were included in this study and 47 (47.0%) patients died in-hospital (Fig. 1). All patients met the criteria for sepsis or septic shock according to the Sepsis-3 criteria. Baseline characteristics of the patients are shown in Table 1. The median age of the patients was 69.0 years (IQR, 56.5–80.0), and median body weight was 58.0 kg (IQR, 51.0–66.0). Septic shock was diagnosed in 60 (60.0%) patients. The mean initial SAPS3 and median SOFA score on day 1 were 78.3 ± 14.1 and 9.0 (IQR, 7.0–12.0), respectively, and both scores were significantly higher in non-survivors than those in survivors (both, P < 0.001). The median hemoglobin and hematocrit values were significantly lower in non-survivors than in survivors (P = 0.007 for hemoglobin; P = 0.012 for hematocrit). Among the cases, 74 (74.0%) needed vasopressor support and 44 (44.0%) had hypoxemia-requiring invasive ventilation. The amount of total fluids administered 24 hours before the ICU admission was 3,215.0 mL (2,364.5–4,623.0) and significantly higher in non-survivors than in survivors (3,481.0 [2,811.2–4,941.6] vs. 3,008.0 [2,060.0–3,878.0], P = 0.007). The mean value of ePVS was 7.1 ± 1.9 dL/g and significantly higher in non-survivors (7.7 ± 2.1 vs. 6.6 ± 1.6, P = 0.003).
Clinical determinants of ePVS
Univariable linear regression analysis showed that the amount of total fluids administered 24 hours before the ICU admission, old age, higher lactic acid and higher SAPS3 score were significantly correlated with higher ePVS (Table 2). In multivariate linear regression models, only the amount of total fluids administered 24 hours before the ICU admission and higher lactic acid were significantly correlated with higher ePVS.
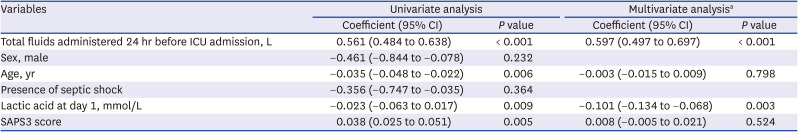
Table 2
Multivariate model for the association of clinical parameters with estimated plasma volume status
CI = confidence interval, ICU = intensive care unit, SAPS3 = Simplified Acute Physiology Score 3.
aClinical parameters with a P value of 0.05 in the univariate logistic regression were included in the multivariate logistic regression.
![]()
In-hospital mortality prediction performance of ePVS
ROC curves were generated to compare the ePVS, SOFA, and SAPS3 for predicting in-hospital mortality in patients with sepsis or septic shock who required admission to the ICU (Fig. 2). In all patients, ePVS showed an area under the curve (AUC) of 0.655 (95% CI, 0.553–0.747), with 61.7% sensitivity and 67.9% specificity, at a cutoff point ≥ 7.09 dL/g. While SAPS3 showed an AUC of 0.768 (95% CI, 0.673–0.847) with 72.3% sensitivity and 79.3% specificity, and SOFA showed an AUC of 0.724 (95% CI, 0.625–0.809) with 48.9% sensitivity and 72.3% specificity, but the AUC among the three scores was not significantly different (P = 0.365).
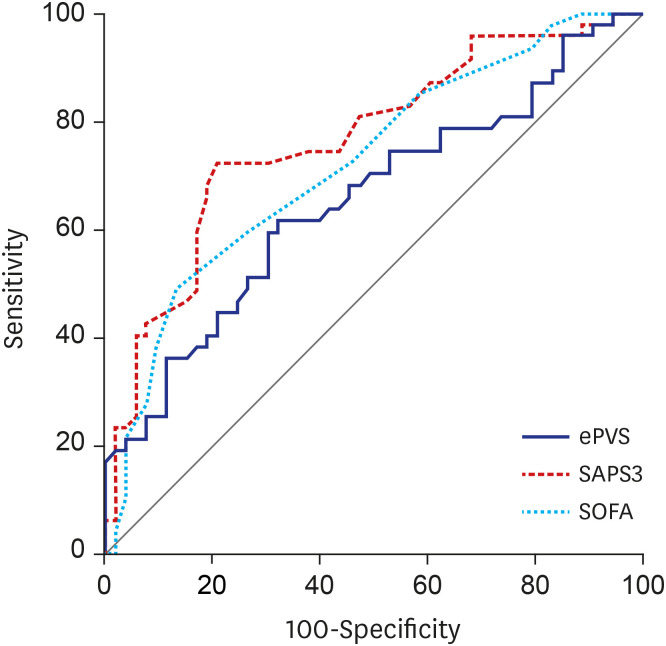
Table 3 lists the patient outcomes according to ePVS values. Patients with ePVS > 7.09 dL/g had a significantly higher rate of ICU mortality (53.2% vs. 30.2%, P = 0.033), and in-hospital mortality (61.7% vs. 34.0%, P = 0.010) than those with ePVS < 7.09 dL/g. In adittion, patients with ePVS > 7.09 dL/g had a significantly higher rate of renal replacement therapy (RRT) during the ICU stay (44.7% vs. 20.8%, P = 0.019). After adjusting for potential confounding factors, higher ePVS remained significantly associated with RRT during the ICU stay (adjusted OR, 1.41; 95% CI, 1.03 – 1.92; P = 0.030) (Supplementary Table 1).
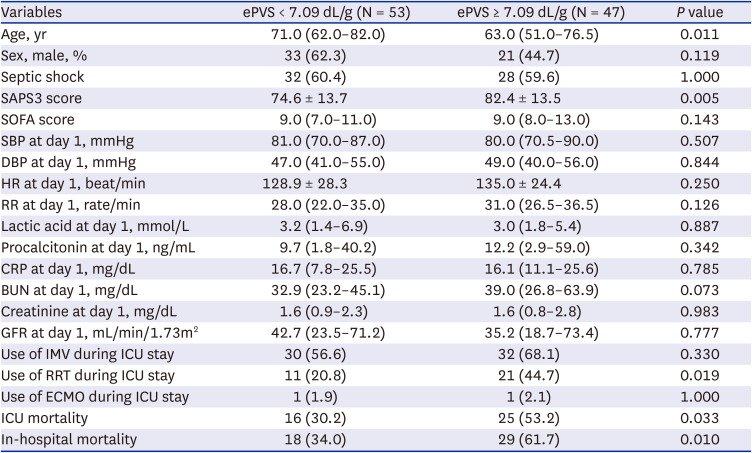
Table 3
Comparison of baseline characteristics and outcomes according to cut-off ePVS value
Values are presented as number (%) or mean ± standard deviation or median (interquartile range).
ePVS = estimated plasma volume status, SAPS3 = Simplified Acute Physiology Score 3, SOFA = sequential organ failure assessment, SBP = systolic blood pressure, DBP = diastolic blood pressure, HR = heart rate, RR = respiratory rate, CRP = C-reactive protein, BUN = blood urea nitrogen, GFR = glomerular filtration rate, IMV = invasive mechanical ventilation, RRT = renal replacement therapy, ECMO = extracorporeal membrane oxygenation, ICU = intensive care unit.
![]()
Factors associated with in-hospital mortality in patients with sepsis
Logistic regression analysis of clinical parameters for evaluating the risk factors associated with hospital mortality in patients with sepsis is shown in Table 4. The increase of 1 dL/g in ePVS at day 1 was independently associated with in-hospital mortality by univariate analysis (crude OR, 1.40; 95% CI, 1.11–1.77; P = 0.005). Other independent risk factors for hospital mortality were higher lactic acid, higher SAPS3 score, higher SOFA score, use of mechanical ventilation (MV), higher heart rate, higher respiratory rate on day 1, and total fluids administered 24 hours before ICU admission (Table 4). After adjusting for potential confounding factors, higher ePVS, higher SAPS3 score, and use of MV on day 1 remained independently associated with in-hospital mortality (P = 0.028, P = 0.011, P = 0.020, respectively).
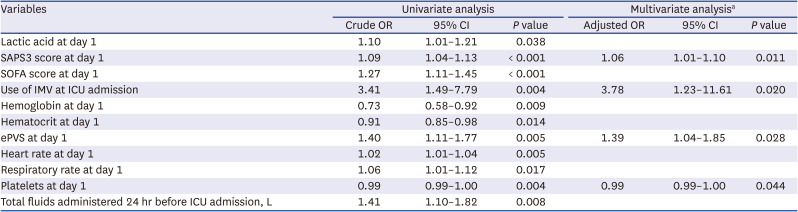
Table 4
Logistic regression analysis for in-hospital mortality
OR = odds ratio, CI = confidence interval, SAPS3 = Simplified Acute Physiology Score 3, SOFA = sequential organ failure assessment, IMV = invasive mechanical ventilation, ICU = intensive care unit, ePVS = estimated plasma volume status.
aClinical parameters with a P value of 0.05 in the univariate logistic regression were included in the multivariate logistic regression.
![]()
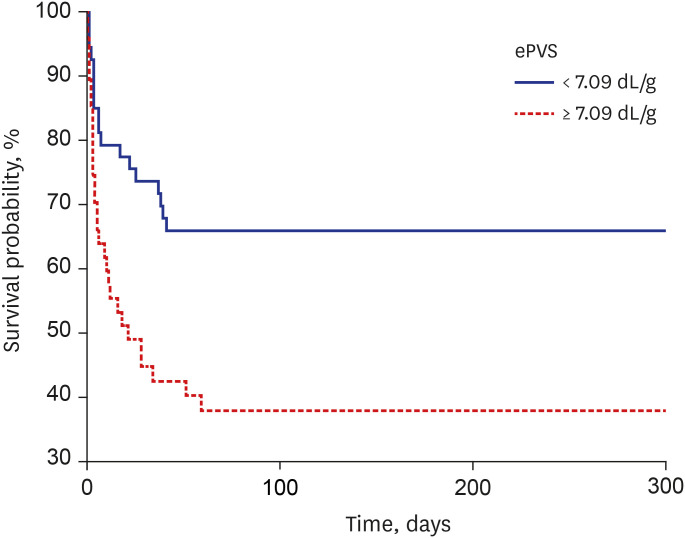
Finally, the Kaplan–Meier survival analysis showed that patients with ePVS > 7.09 dL/g were associated with an increased risk of in-hospital death compared with the rest of the population (log-rank test P = 0.004) (Fig. 3).
DISCUSSION
In this prospective observational study of sepsis patients admitted to the ICU, the ePVS was correlated with the amount of total fluids administered before the ICU admission and independently associated with in-hospital mortality even after multivariate adjustment for other patient clinical and laboratory conditions. To our knowledge, this result is the first attempt to predict the outcome of sepsis patients admitted to the ICU using this new biological surrogate. Our results suggest that ePVS could be a promising tool to predict the prognosis of patients with sepsis.
Key components of treatment in patients with sepsis include intravenous fluid resuscitation to restore tissue perfusion, along with antibiotic therapy, source control, and vasopressors.5 However, recent studies have shown that positive fluid balance is associated with poor outcome in patients with sepsis.4614 The mechanisms by which positive fluid balance could cause harm are uncertain, but previous studies suggest that excessive intravenous fluid resuscitation may induce iatrogenic endothelial injury.1516 Increased endothelial permeability due to endothelial injury leads to tissue edema and hypoxia, which might eventually lead to organ damage.1617 Therefore, a simple and universally available tool for assessing volume status is needed.
In the present study, ePVS was correlated with the amount of total fluids administered 24 hours before the ICU admission. Plasma volume is a marker of volume overload and is linked to the regulation between the interstitial and intravascular spaces.7 By using a simple formula based on hemoglobin and hematocrit concentrations, the plasma volume of each patient can be calculated; previous studies have shown that the calculated plasma volume measured by this method was well correlated with actual plasma volume, which is measured by radiolabeled albumin techniques.81819 The ePVS is defined as the percentage difference between ideal plasma volume and actual plasma volume and has emerged as a noninvasive method to assess volume status.8910
Initially, the ePVS was developed to predict the prognosis of patients with HF; after acute myocardial infarction, higher ePVS was significantly associated with hospitalization or cardiovascular death.8 Furthermore, a decrease in the ePVS was related to decongestion associated with effective treatment and better cardiovascular outcome.8910 Recently, Chouihed et al.12 reported the results of the PARADISE study, which consisted of patients with acute HF and inflammatory diseases. Results showed that high ePVS was significantly associated with in-hospital mortality in patients who visited the ED with acute dyspnea. In patients who visited the ED with fever, ePVS was independently associated with poor prognosis after adjusting for confounding factors.11
In this study, higher ePVS was significantly associated with in-hospital mortality and the risk of RRT in critically ill patients with sepsis. A possible explanation for these results may be the side effect of excessive fluid resuscitation. As previously stated, ePVS was correlated with the amount of fluids administered before the ICU admission, and intravenous fluid resuscitation could cause harm in patients with sepsis. Studies have shown that volume overload was associated with poor outcome such as mortality and renal failure.4620 Increased endothelial permeability due to endothelial injury leads to tissue edema and hypoxia, a key factor in the development of organ dysfunction and death.2122
The SAPS3 and SOFA score are systematic scoring systems for sepsis patients created and verified through large-scale clinical studies.123 In this study, ePVS has a prognostic value similar to SAPS3 or SOFA score in critically ill patients with sepsis. Although the in-hospital mortality AUC for ePVS (0.655) was lower than for SAPS3 (0.768) or SOFA score (0.724), it was not significantly different. Although similar, the SAPS3 and SOFA scores are calculated using distinct, complicated formulas; therefore, ePVS could be a simple tool to predict the prognosis of critically ill patients with sepsis.
To the best of our knowledge, this is the first study to evaluate the value of the ePVS in predicting the prognosis of critically ill patients with sepsis. However, the present study had some limitations. First, the size of this study was relatively small. Second, we did not evaluate the association between a dynamic change in the ePVS value and the prognosis of patients with sepsis. Although previous studies have suggested that a variation of the ePVS is associated with poor prognosis,910 transfusion or bleeding commonly occurred after the ICU admission in this study; therefore, change in the ePVS could not be evaluated. Third, the correlation between the ePVS value and actual plasma volume status was not investigated. Although previous studies have reported that the ePVS reflected plasma volume status, it would have been possible to provide more accurate information if the plasma volume status was measured by other methods. Therefore, additional studies need to be carried out in order to evaluate the correlation between the ePVS and the actual plasma volume value.
In summary, we found that the ePVS, which is simple to perform on admission to the ICU, was correlated with the amount of intravenous fluid resuscitation and significantly associated with mortality in patients with sepsis. Although further research is required to determine these clinical findings, the ePVS may provide the prognostic granularity required for clinical use in critically ill patients with sepsis.
 XML Download