

 PDF
PDF Citation
 Print
Print


INTRODUCTION
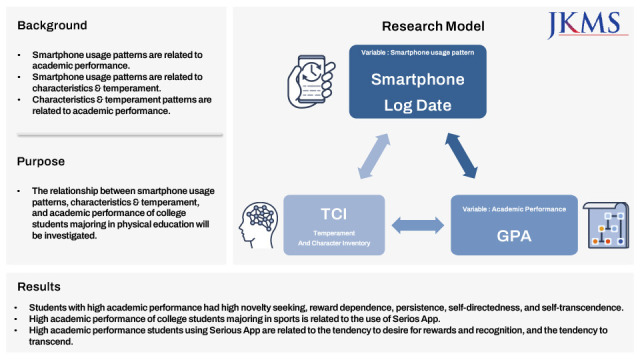
Smartphones have become an indispensable part of daily life. According to a 2020 report by the Pew Internet and American Life Project, 96% of college students and 89% of non-students of the same age had a cellphone.1 Smartphones provide access to vast amounts of information, and increase convenience in daily life through a wide range of applications2 including news, social media, entertainment, and education. Daily benefits include cameras, navigation, and schedule notifications. Today’s college students are the first fully grown digital natives. Incorporating digital technologies into daily life among this cohort is a cultural norm.3
Despite the numerous benefits of smartphone use, they can also be harmful.4 Excessive screen use is associated with poor sleep and academic performance in adolescents and young adults.5 Similarly, low self-control results in excessive smartphone usage and poor academic achievement.6 Life attitudes associated with smartphone use result from temperament and personality traits.7 As smartphones become more accessible, a study on the relationship between smartphone usage habits, personality, temperamental characteristics, and grades of college students in their 20s is needed.
Smartphone usage patterns have a relatively greater influence on school achievement than usage time.8 In addition, the use of smartphones for productive purposes is related to excellent academic performance.9 Therefore, there is a strong causal relationship between smartphone use time and school achievement.10 Researchers have studied the relationship between smartphone usage and grades in college students, and reported that participants were divided into high- and low-grade groups according to the type of app used.4 In addition, studies have suggested a relationship between smartphone usage and academic performance in adolescents, young adults, and college students.1112
In previous studies of sports players and students, smartphone app use pattern predicted sports and academic performances.13 Comparing the smartphone usage patterns of excellent and general players, that the former used useful apps more often.1415 In addition, smartphone use is closely related to personal achievement for most students and athletes, regardless of their major.16
Smartphone usage information can be acquired in various ways. Self-report questionnaire survey on smartphone usage time and app usage.1718 Lin et al.19 and Zimmermann installed a smartphone usage tracking app to collect data.20 However, these methods have several limitations. First, subjective responses regarding smartphone usage may differ according to individual cognitive abilities and interests.21 Second, there is the possibility of response bias, with respondents underreporting their smartphone usage time and frequency, or being dishonest about the apps they used.22 Third, the procedure of installing a separate app for tracking smartphone usage is a limitation of data collection.23
Smartphones have built-in screen time features. Wang et al.24 used iOS Screen Time and Android’s Digital Wellbeing data to compare users’ smartphone security attitudes across countries. Ohme et al.22 demonstrated the need for research on smartphone log data by comparing the Screen Time and user self-reports. Rosenthal et al.25 reported high accuracy in comparing self-reported data on depression and smartphone usage time and Screen Time or Digital Wellbeing. Determining the correlation between the smartphone usage habits of infants and toddlers, and the degree of interaction at home, Lauricella et al.26 reported that smartphone usage data should be viewed as a warning message.
Most studies on the relationship between personality, temperament, and smartphone usage habits used self-reported data.2728293031 Personality and temperament studies have also been conducted using commercial smartphone usage measurement apps.1920 However, few studies have examined the relationship between smartphone log data and personality and temperament. Lee et al.13 classified app usage history from mobile log data for four weeks into four types (“social networking sites [SNS],” “entertainment,” “games,” and “serious”), and reported a correlation between golf players’ performance and smartphone usage patterns. This study collected smartphone usage patterns and app usage history using Screen Time and Digital Wellbeing features on iOS and Android, respectively. We examined the correlation between the academic performance of physical education students and their smartphone app use patterns in an environment where physical activity classes and theoretical classes were combined.
Several studies have investigated the relationship between smartphone use and personality. The Big Five personality traits (openness, conscientiousness, extraversion, agreeableness, and neuroticism) could be predicted from smartphone usage data.3233 In addition, the Big Five personality traits influence the use of specific apps.243435
Personal traits such as extraversion and sociability are associated with the overuse of social media.36 Schoedel et al.37 conducted a study on the temperament associated with behavioral addiction; specifically, they investigated the relationship between Internet addiction and temperament. Additionally, studies have revealed the difference between the temperamental characteristics visible in behavioral addictions, and those associated with smartphone addiction through the relationship between smartphone use and individual temperament.38 Zeidan et al.39 reported that the more depressive one’s temperament, the greater the smartphone addiction.
Previous studies have mainly explored the association between the causes of behavioral addiction (tobacco, alcohol, and drugs) and temperament and character inventory (TCI).404142 In addition, they explored the relationship between nomophobia, temperament, and personality, suggesting a correlation between the fear of not being able to access a mobile phone and personality.43 The few studies that investigated the relationship between the TCI and smartphone use focused on problematic smartphone behavior, not the individual characteristics that appear in general smartphone use.744 Thus, it is important to explore whether the TCI can aid in the formulation of a research approach for non-addicted smartphone users.
Studies have focused on the relationship between personality and academic performance. As a predictor of academic performance, the conscientiousness of the Big Five had a positive correlation with academic performance,45 whereas neurotic factors and affinity factors had a negative correlation.46 In addition, there is also interest in the performance ability of personality to conceptually link personality with academic performance. Attempts have been made to integrate personality and academic performance, but consistent and repeatable correlations are difficult to obtain. When trying to understand human performance, it is very meaningful to examine how the two variables work together.47 Considering that these factors are related to each other, personality and academic performance factors are involved in human performance, especially in students’ academic performance.48 Temperament is a factor that determines academic performance, mainly in children.718 In addition, types of temperament of university students can be classified as favorable ones for their well-being, academic performance, and school life adaptation.49
Among research studies that have proven the relationship of academic performance with characteristics and temperament, it is difficult to find a study that combines sports and academics in the field of physical education. Some studies have shown that physical activity through exercise participation has a positive effect on academic performance, with personality and temperament being important intervention variables.505152 However, it is a different matter to understand characteristics of students majoring in physical education who aim to obtain better grades for both sports and academics. It is necessary to find out the characteristics and temperament for achieving positive academic performance of students majoring in physical education with both characteristics of an athlete and an academic student.
Therefore, this study assumes a correlation between academic performance and personality factors and that a certain combination affects the academic achievement and stagnation of college students. In addition, when examining the correlation between academic performance and personality, personality is divided into genotype (temperament) and phenotype (characteristic).53
Thus far, the correlation between academic performance and the TCI for the smartphone usage patterns of college students majoring in physical education has not been thoroughly investigated. Even though a few studies have examined the relationship between smartphone habits, personality, and temperament,115455 not as many have shown correlations between smartphone app usage patterns and personal characteristics. Therefore, the objective of this study was to investigate the correlation between TCI and academic performance through mediating effects of app use pattern.
METHODS
Participants
The participants were 151 students majoring in sports at a renowned university in Korea. The inclusion criteria were as follows: 1) aged 20–25 years, 2) usage of smartphone apps for at least the past month, and 3) activation of the log data monitoring function on the smartphone. The exclusion criteria were as follows: 1) past or current history of medical or psychiatric disorder, including attention deficit hyperactivity disorder, substance use disorder, and Internet gaming disorder, problematic behaviors related to smartphone use, and comorbidities judged to require medical access; 2) those who used two or more smartphones; and 3) those who used apps on both smartphones and iPads.
A total of 151 sports majors were assigned to two groups based on academic performance: elite (n = 37) and general (n = 114). The elite group was defined as students who got an A grade in the previous semester. The academic grades included “A,” “B,” “C,” “D,” and “E,” calculated using the mean of the total subjects selected by the student and the awards won at sports competitions. If students received awards at sports competitions, they were given additional credits for better academic grades.
Grade A was established based on the group of students whose academic performances were within the top 30% of the group as a leading player, having won a prize in individual events and individual record titles in group events. Grade B consisted of the following: 1) a group of students with top 30–50% academic performances while holding individual events as a leading player and individual record titles as a leading player; and 2) a leading player who had no individual event winning record or group event individual record title whose grade was in the top 30%. Grade C consisted of the following: 1) a leading player in individual events, with individual record titles in team events, but in the bottom 50% of academic grades; 2) a leading player within top 30–50% academic grades without personal events or individual records; and 3) a group of students whose grades were within the top 30% as non-main players. Grade D consisted of the following: 1) a main player who had no winning history in individual events or individual record titles in a group event, and scored in the bottom 50% in academic performance; and 2) not a main player with a score of 30–50% at academic performance. Grade E consisted of non-main players and the bottom 50% in academic performance.
Study design
This was a four-week observational study. The participants were asked to provide smartphone log data for the previous four weeks from the point of response, which were transmitted to the researcher as a photo file. In addition, the participants responded to a survey on age, grade, academic performance, and TCI.
Smartphone app use pattern
Based on the time and frequency of use of each app from smartphone log data, we classified 3,500 apps into 20 categories.56 The iPhone has the following detailed app types on the official application developer webpage: books, business, education, entertainment, finance, food & drink, games, health & fitness, lifestyle, magazines & newspapers, medical, music, navigation, news, photo & video, productivity, reference, shopping, social networking, sports, stickers, travel, utilities, and weather. Android phones have the following detailed app types on the Google Play Store: books and reference, business, comic, communication and social, decoration, education, finance, game, health, lifestyle, media and video, medical, music and audio, news, personalization, photo, productivity, shopping, traffic and travel, and weather. However, as each OS application type was different, there were too many applications for analysis. Therefore, the applications were merged and the categories were rearranged. We classified the 20 initially identified categories into four application types: social networking (SNS, blogs, cafés, video calling, and messengers), entertainment (YouTube, TikTok, music apps, Netflix, podcasts, webtoons, media apps, and games), serious apps (Internet browser, schedule, e-books, creativity [camera, photo, video], education, and diaries), and others (banking, shopping, and delivery apps).13 These four classifications of apps have already been used in our previous study on the relationship between golf performance and smartphone app use pattern.13 Serious apps included those used by participants to support their studies.575859 “Others” consisted of apps not covered by previous studies or included in different categories in varied studies.1360
TCI revised
The TCI is a multidimensional scale that distinguishes between innate temperament from birth and personality that shows social maturity while growing up.61 Temperament traits are defined in terms of individual differences in associative learning in response to areas of novelty seeking, harm avoidance, reward dependence, and persistence.61
This questionnaire comprised 240 items (five on validity) on a five-point Likert-type response scale, grouped into four temperament dimensions (novelty seeking, harm avoidance, reward dependence, and persistence) and three-character dimensions (self-directedness, cooperativeness, and self-transcendence). This measurement tool has been validated in general and elite Korean university students,6263 and construct equivalence has been verified.64
Novelty seeking is often associated with risk-taking and exploratory features, as well as self-regulatory skills such as limiting impulsivity. Harm avoidance is related to the inhibition of behaviors, passivity, avoidance, shyness, and rapid fatigability. Reward dependence shows the maintenance or continuation of ongoing behaviors, sentimentality, and social attachment.65 Persistence is associated with heritable bias toward continuing and persevering without rewards.66
In addition, the characters are thought to reflect epigenetic influences on behaviors in response to social stimuli.676869 Self-directedness is associated with autonomy and life purpose, and cooperativeness is related to positive relationships with others. Finally, self-transcendence is associated with personal growth and self-actualization. 70
Factor analysis for validity and reliability
To verify the validity and reliability of the data collected through questionnaires in the survey, confirmatory factor analysis (CFA) and reliability analysis were conducted (Table 1). The maximum likelihood was applied to the CFA to test the convergent validity. Resulting values of construct reliability and average variance extracted for the convergent validity appeared in ranges of 0.902–0.939 and 0.716–0.758 based on criteria of levels above 0.70 and 0.50, respectively. In the meantime, values of indices of conformance to the conceptual model of CFA appeared to exceed 0.9 (Tucker-Lewis index [TLI] = 0.933, comparative fit index [CFI] = 0.917), whereas values of root mean square error of approximation (RMSEA) and root mean square residual (RMR) appeared to fall below 0.048 and 0.051, respectively, which were regarded to be favorable. As a result, all values of the goodness of fit satisfied the criteria of acceptance.
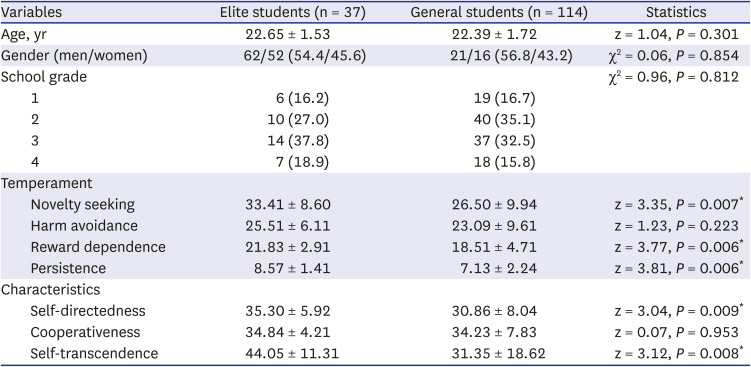
Table 1
Demographic and temperamental characteristics
![]()
The reliability of the collected data presented in terms of internal consistency was tested by calculating the coefficient of Cronbach’s α. It was found that the Cronbach’s α was 0.852 for TCI, 0.880 for serious app, and 0.872 for academic performance, thus confirming the reliability of collected data (Supplementary Table 1).
Data analysis
Data were analyzed using IBM SPSS Statistics & AMOS (version 25.0; IBM Corp., Armonk, NY, USA). The Kolmogorov-Smirnov test was performed to determine data normality. In addition, a Mann-Whitney U test and the χ2 test were performed to compare academic performance, smartphone log data, and the TCI of elite and general students. Effect size was assessed using independent t-tests with Cohen’s d, which we interpreted as follows: 0.0 < d < 0.2, small; 0.3 < d < 0.5, medium; d > 0.6, large.71
Controlling for covariates—including demographic characteristics, TCI, and smartphone app use patterns—a hierarchical logistic regression analysis was adopted. In a multiple hierarchical regression analysis of elite students, a discrete set of hierarchical variables was added: Model 1: demographic characteristics; Model 2: demographic characteristics + TCI; Model 3: demographic characteristics + TCI + smartphone app use pattern. The dependent variable of the “elite student” and the “general student” were coded as “1” and “0,” respectively.
Pearson’s correlation analysis were conducted to evaluate the correlation between the serious app usage time and temperament and characteristics scores, including novelty seeking, reward dependence, and self-transcendence in the elite group. All tests were performed with two-sided significance levels of α < 0.05.
TCI and serious app use time were used for path analysis. CFA and reliability analysis were performed to analyze the validity and reliability of academic performance data. Path analysis was conducted to examine the relationship between students’ TCI and serious app use time by dividing the academic performance of elite physical education students into theoretical performance and sports performance.
Ethics statement
The study was approved by the Chung-Ang University Institutional Review Board (reference number: 1041078-202009-HRSB-290-01), and all participants provided written informed consent. The study was conducted in accordance with the Declaration of Helsinki.72
RESULTS
Demographic and temperamental characteristics
The mean ± standard deviation of age, academic performance scores, and TCI score in the overall sample were 22.52 ± 1.63 years, 3.52 ± 0.78, and 26.80 ± 9.99, respectively.
There were no significant differences in age (z = 1.04, P = 0.301), gender ratio (χ2 = 0.06, P = 0.854), or school grade (χ2 = 0.96, P = 0.812) between the elite and general students (Table 1).
Compared to general students, elite students scored higher on novelty seeking (z = 3.35, P = 0.007), reward dependence (z = 3.77, P = 0.006), persistence (z = 3.81, P = 0.006), self-directedness (z = 3.04, P = 0.009), and self-transcendence (z = 3.12, P = 0.008) (Table 1).
Comparison of app use patterns of elite and general students
The most frequently used app category in both groups of students was social networking, followed by entertainment. However, regarding the third most frequently used app category, serious apps were more popular among elite than general students (Table 2).
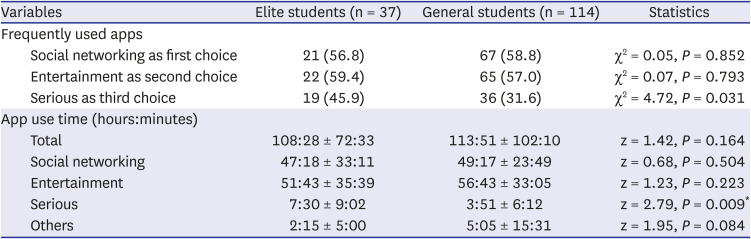
Table 2
Comparison of app use patterns between elite and general students
![]()
There was no significant difference in the total smartphone usage time between elite and general students (z = 1.42, P = 0.164). However, elite students used serious apps for longer than general students (z = 2.79, P = 0.009) (Table 2).
Hierarchical logistic regression analysis for the determining elite student group
Among the three models, Models 2 and 3 were significantly associated with the elite student group. With step χ2/p (42.9/0.001 and 11.3/< 0.042), TCI and smartphone app usage patterns could predict the elite student group.
In Model 3 (demographic + TCI + smartphone app use pattern), model χ2 (55.1/< 0.001), and Nagelkerke’s R2 (0.455) (45.5% of the variance in the dependent variable of the elite students) indicated that Model 3 was adequate for predicting the elite student group. According to the Wald statistics for all independent variables, high novelty seeking, reward dependence, self-transcendence, and more smartphone serious app use time were significant predictors of elite students (Table 3).
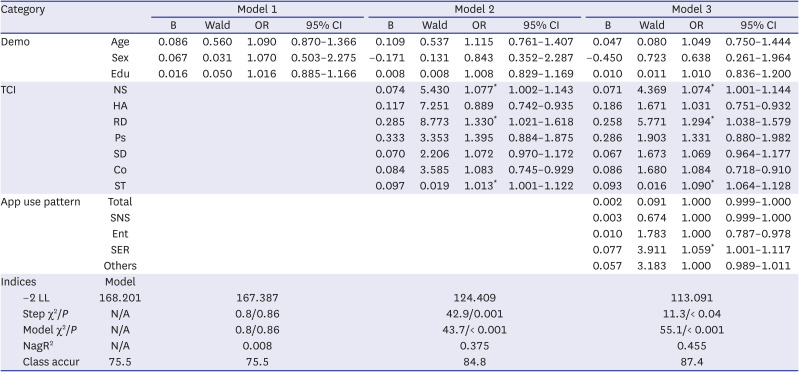
Table 3
Hierarchical logistic regression analysis
−2LL, −2 log likelihood, NagR2; class accur, classification accuracy (%), dependent variable, elite student group, Model 1: Demo, Model 2: Demo + TCI, Model 3: Demo + TCI + smartphone app use pattern (app use pattern).
OR = odds ratio, CI = confidence interval, Demo = demographic characteristics, Edu = educational year, NS = novelty seeking, HA = harm avoidance, RD = reward dependence, Ps = persistence, SD = self-directedness, Co = cooperativeness, ST = self-transcendence, SNS = social network service, Ent = entertainment, SER = serious app, −2LL = −2 log likelihood, TCI = temperament and character inventory, class accur = classification accuracy.
*P < 0.001.
![]()
Correlations between TCI scores and app use time
In all participants, the usage time of serious apps was correlated with novelty seeking (r = 0.32, P = 0.007), reward dependence (r = 0.32, P = 0.007), and self-transcendence (r = 0.35, P = 0.006). In the elite group, the usage time of serious apps was correlated with novelty seeking (r = 0.45, P = 0.001), reward dependence (r = 0.39, P = 0.022), and self-transcendence (r = 0.35, P = 0.031). In the general group, the usage time of serious apps was correlated only with the self-transcendence score (r = 0.32, P = 0.007) (Fig. 1).
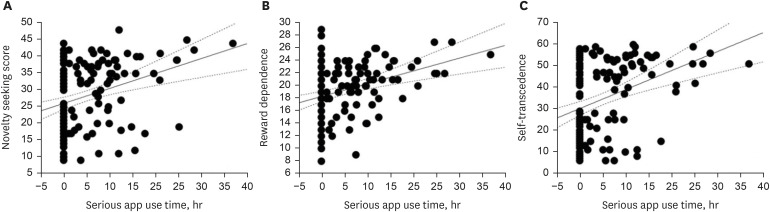
Fig. 1
The correlations between biogenetic traits and app use time. (A) The correlation between the use time of serious app and the scores of novelty seeking, r = 0.32, P = 0.007. (B) The correlation between the use time of serious app and the scores of reward dependence, r = 0.32, P = 0.007. (C) The correlation between the use time of serious app and the scores of Self-Transcendence, r = 0.35, P = 0.006.
![]()
Path analysis for TCI, serious app use pattern, and academic performance
The path analysis was conducted to verify the relation of the model of factor selected for the present study. The maximum likelihood was used for the analysis to estimate relevant parameters. The estimation showed values of normed fit index = 0.945 (≥ 0.90), TLI = 0.963 (≥ 0.90), and CFI = 0.970 (≥ 0.90), while values of RMR and RMSEA were derived as 0.029 (≥ 0.08) and 0.060 (≥ 0.08), respectively. Therefore, all indices of the goodness of fit appeared to satisfy the criteria. They showed favorable conformance of the research model based on the criteria.
Results of the path analysis conducted prior to comparison of groups in the research model to verify the research model of the entire participants are shown in Table 4 and Fig. 2. There were statistically significant relationships of serious app use pattern with novelty seeking (t = 6.387, P = 0.012), reward dependence (t = 6.210, P = 0.012), and self-transcendence (t = 5.990, P = 0.013). Theoretical performance showed statistically significant relationships with reward dependence (t = 8.214, P = 0.010) and persistence (t = 5.837, P = 0.013). Sports performance showed statistically significant relationships with novelty seeking (t = 6.967, P = 0.011) and persistence (t = 6.226, P = 0.012). In addition, serious app use pattern showed significant relations with theoretical performance (t = 11.495, P = 0.010) and sports performance (t = 10.348, P = 0.010).
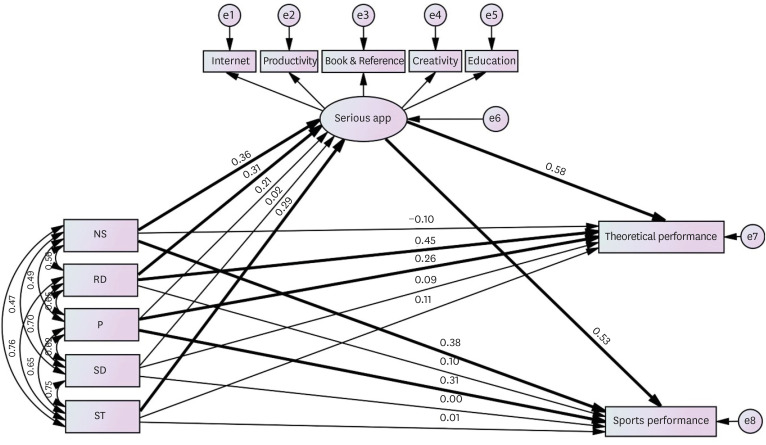
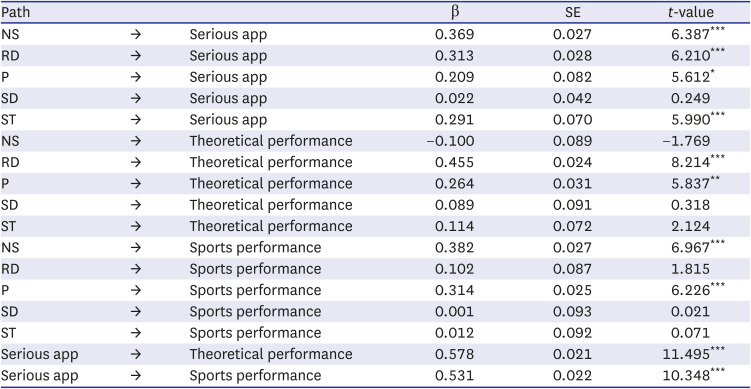
Fig. 2
Path analysis of temperament and character inventory, serious app and theoretical/sports performance.
NS = novelty seeking, RD = reward dependence, P = persistence, SD = self-directedness, ST = self-transcendence.
![]()
Table 4
Result of path analysis
χ2 = 144.371, df = 64, P value = 0.001, Tucker-Lewis index = 0.918, comparative fit index = 0.906, root mean square error of approximation = 0.057, root mean square residual = 0.064.
SE = standard error, NS = novelty seeking, RD = reward dependence, P = persistence, SD = self-directedness, ST = self-transcendence.
*P < 0.050, **P < 0.010, ***P < 0.001.
![]()
DISCUSSION
Compared with general students, elite students showed higher scores for temperament, including novelty seeking, reward dependence, and persistence, as well as for characteristics such as self-directedness and self-transcendence. In a previous study, novelty seeking was higher in college students with low academic performance, which contradicts the present results.73 Cloninger et al.61 reported that the higher the novelty seeking, the more exploratory and impulsive but extroverted and active the individual. Student athletes should be involved in both academic and sports performance.7475 In both academic and sports performance, novelty seeking is known to be associated with excellent performance.76777879808182 Extroversion required in sports activities is predicted to be the cause of effective academic performance in sports majors.64767783
Reward dependence is a tendency toward social reward behavior; further, students with high academic performance tend to seek recognition from others through high academic performance.618485 In other words, we can confirm previous findings showing the tendency of reward dependence in both elite athletes7986 and elite students.8788 People with high persistence scores are considered industrious, stubborn, steady, and stable despite frustration, whereas those with low persistence scores are considered unstable and lazy.89 In particular, a strong tendency toward persistence can be observed in celebrities and famous athletes,7890 and it is an important temperamental cause of high performance in various fields.91 Therefore, college students majoring in sports who are inquisitive but impulsive and easily bored show lower academic performance, whereas those with a more diligent and steady personality have higher academic performance.
In a previous study, students with low academic performance spent more time using SNS and entertainment apps9293; however, in this study, there was no difference between elite and general students in this regard. In addition to the overall high novelty-seeking tendencies, the high activity, and social needs of physical education students94 and the self-expression needs of athletes are related to this result.95 This indicates that a variety of other factors may determine academic performance, and that social media use may not necessarily be detrimental to academic performance.96 It was found that elite students with high academic performance spent more time using serious apps than general students. In addition, they actively utilized an e-learning app to improve students’ concentration and learning effects.97 A prior study showed that active study data collection using an Internet browser was associated with high academic performance in college students.98 Many athletes spent much time using serious apps for self-management, which include image analysis, scheduling, diet, and sleep.99100101102 Smartphone usage time had no significant correlation with academic achievement; previous findings confirm that keeping smartphones out of reach led to academic success contradicts this finding.103104 Smartphone usage patterns had a relatively higher impact on academic performance compared with smartphone usage time.11 In addition, the use of smartphones for productive purposes was associated with high academic performance.105
In Model 3 of the hierarchical logistic regression of the current study, TCI (high novelty seeking, reward dependence, and self-transcendence) and smartphone app use pattern (use of serious apps) could predict elite students. In addition, the usage time of serious apps was correlated with novelty seeking, reward dependence, and self-transcendence scores in all participants. In the elite group, the usage time of serious apps was correlated with novelty seeking, reward dependence, and self-transcendence scores.
Elite sports majors and elite athletes shared high levels of novelty seeking.78106 These results were in line with those of previous studies of athletes and students. Elite sports majors and medical students with high academic performance shared smartphone usage habits.38107 It can be predicted that they show the dispositions of both excellent players and elite students. In addition, most students with high academic performance display high reward dependence.85108 High reward dependence in elite students may be associated with frequent use of serious apps to receive feedback on their abilities.97109110111112 Personality self-transcendence is correlated with serious app usage time in both elite and general students,113 emphasizing the importance of digital content in helping people with personality traits that seek self-transcendence. In addition, self-transcendence is related to well-being, self-management, and quality of life.114 The positive effects of serious apps on self-management and quality of life have been demonstrated.115 Both students and athletes report that sleep management apps lead to personal performance and physical health, as well as personal psychological improvements.116117 Additionally, continued use of serious apps improved behavior, lifestyle, and health.62 Self-transcendence is related to the fulfillment of an individual’s mental health needs.118
Similar results were also found in path analysis. High novelty seeking, reward dependence, and self-transcendence of elite physical education students were found to lead to a serious app use pattern. In the performance process, the academic performance of elite physical education students was divided into theoretical performance and sports performance and set as a dependent variable. TCI factors affecting theoretical performance were found to be reward dependence and persistence. It was confirmed that students with a high reward dependence had a tendency to desire for social recognition as a factor that could increase the academic performance of students majoring in physical education.6481 In addition, high persistence was found to be associated with the behavior of continuing steady and stable effort to achieve a high theoretical performance.8384 On the other hand, factors affecting sports performance were novelty seeking and persistence. Novelty seeking mainly seen in elite athletes has also been found to have an effect on sports performance score of elite athletes.69 Persistence also affected sports performance of elite physical education students. The high persistence possessed by talented people in various fields proved that elite physical education students could achieve both academic and sports performances effectively.75828384 Characteristic and temperamental factors that mediated academic performance of elite students with physical education major needed to be explained separately from sports performance and academic performance. Results suggest that it is necessary to have both opposite personality and temperamental factors to achieve sports performance and academic performance at the same time.
The current study has several limitations. First, the number of elite sports students was relatively small, which prevented generalization of the results. Further studies with a larger sample size are needed to identify the characteristics of elite athletes in the future. Second, few studies have investigated the relationship between TCI and smartphone apps. Therefore, additional research is needed to investigate the relationship between academic performance, TCI, and smartphone usage behavior by considering various academic backgrounds and age groups, including college students and athletes. Third, the academic performance criteria used in this study were the previous year’s grade point average. Since the time of receiving grade preceded the time of using the app, it was difficult to conclude that the use of app had a direct effect on grades. Readers should consider it when interpreting results of this study. The classification of smartphone apps was arbitrary. Follow-up research must use academic performance standards and smartphone app classification standards that are more suitable for students majoring in sports and studying both practical and theoretical aspects.
In conclusion, elite sports students with high academic performance showed higher novelty seeking, reward dependence, persistence, self-directedness, and self-transcendence compared to general students. Therefore, the temperament and personality characteristics of students represented by the TCI can predict their efforts and attitudes toward academic performance. In addition, temperament and characteristics were associated with smartphone app use pattern which could predict elite students. We can cautiously speculate that this personality trait is a prerequisite for becoming elite sports majors with the characteristics of both athletes and students.
 XML Download