Introduction
Materials and methods
1. Patient selection
2. The sample size calculation
3. Statistical analysis
Results
Table 1
| Total | Well nourishment | Malnurishedment | P-valueb) | |
|---|---|---|---|---|
| Age (yr) | 54.59+10.59 | 54.11+10.47 | 54.11+11.11 | 0.783 |
| BMI (kg/m2) | 22.50+4.38 | 23.33+4.20 | 20.24+4.14 | 0.001 |
| Underlying diseasea) | 50 (49.5) | 37 (36.6) | 13 (12.9) | 0.524 |
| Cancer site | 0.839 | |||
| Ovary | 34 (33.7) | 26 (25.7) | 8 (7.9) | |
| Cervix | 34 (33.7) | 24 (23.8) | 10 (9.9) | |
| Endometrium | 14 (13.9) | 10 (9.9) | 4 (4.0) | |
| Fallopian tube | 13 (12.9) | 10 (9.9) | 3 (3.0) | |
| Gestational trophoblastic neoplasia | 3 (3.0) | 1 (1.0) | 2 (2.0) | |
| Leiomyosarcoma of uterus | 1 (1.0) | 1 (1.0) | - | |
| Peritoneum | 1 (1.0) | 1 (1.0) | - | |
| Ovary and endometrium | 1 (1.0) | 1 (1.0) | - | |
| Recurrence setting | 48 (47.5) | 32 (31.7) | 16 (15.8) | 0.181 |
| Initial stage | 0.396 | |||
| I | 15 (14.9) | 9 (8.9) | 6 (5.9) | |
| II | 13 (12.9) | 10 (9.9) | 3 (3.0) | |
| III | 48 (47.5) | 34 (33.7) | 14 (13.9) | |
| IV | 25 (24.8) | 21 (20.8) | 4 (4.0) | |
| Surgery | 70 (69.3) | 54 (53.5) | 16 (15.8) | 0.225 |
| ECOG | 0.001 | |||
| 0 | 41 (40.6) | 38 (37.6) | 3 (3.0) | |
| 1 | 48 (47.5) | 31 (30.7) | 17 (16.8) | |
| 2 | 8 (7.9) | 3 (3.0) | 5 (5.0) | |
| 3 | 4 (4.0) | 2 (2.0) | 2 (2.0) | |
| Line of chemotherapy | 0.584 | |||
| 1 | 64 (63.4) | 49 (48.5) | 15 (14.9) | |
| 2 | 19 (18.8) | 12 (11.9) | 7 (6.9) | |
| 3 | 8 (7.9) | 5 (5.0) | 3 (3.0) | |
| 4 | 6 (5.9) | 5 (5.0) | 1 (1.0) | |
| 5 | 2 (2.0) | 2 (2.0) | - | |
| 6 | 2 (2.0) | 1 (1.0) | 1 (1.0) | |
| Chemotherapy cycle at interviewed time | 0.169 | |||
| 1 | 9 (8.9) | 5 (5.0) | 4 (4.0) | |
| 2 | 8 (7.9) | 5 (5.0) | 3 (3.0) | |
| 3 | 40 (39.6) | 25 (24.8) | 15 (14.9) | |
| 4 | 15 (14.9) | 14 (13.9) | 1 (1.0) | |
| 5 | 11 (10.9) | 10 (9.9) | 1 (1.0) | |
| 6 | 12 (11.9) | 10 (9.9) | 2 (2.0) | |
| >6 | 6 (5.9) | 5 (4.9) | 1 (1.0) | |
| Total cycles of chemotherapy | 0.729 | |||
| 1–6 | 54 (53.5) | 41 (40.6) | 13 (12.9) | |
| 7–12 | 21 (20.8) | 16 (15.8) | 5 (5.0) | |
| 13–20 | 16 (15.8) | 9 (8.9) | 7 (6.9) | |
| >20 | 10 (9.9) | 7 (6.9) | 3 (3.0) | |
| Nausea | <0.001 | |||
| Grade 1 | 74 (73.3) | 71 (70.3) | 3 (3.0) | |
| Grade 2 | 24 (23.8) | 3 (3.0) | 21 (20.8) | |
| Grade 3 | 3 (3.0) | - | 3 (3.0) | |
| Vomiting | 0.018 | |||
| Grade 1 | 98 (97.0) | 74 (73.3) | 24 (23.8) | |
| Grade 2 | 3 (3.0) | - | 3 (3.0) | |
| Mucositis | 0.004 | |||
| Grade 1 | 97 (96.0) | 74 (73.3) | 23 (22.8) | |
| Grade 2 | 2 (2.0) | - | 2 (2.0) | |
| Grade 3 | 2 (2.0) | - | 2 (2.0) | |
| Diarrhea | 0.267 | |||
| Grade 1 | 100 (99.0) | 74 (73.3) | 26 (25.7) | |
| Grade 2 | 1 (1.0) | - | 1 (1.0) |
a) Breast cancer 4 cases, diabetes mellitus (DM) 1 case, DM & single kidney 1 case, human immunodeficiency viral infection (HIV) 2 cases, hypertension (HT) 10 cases, HT and heart disease 5 cases, HT & dyslipidemia (DLP) 7 cases, HT & DM 2 cases, HT & DM & DLP 1 case, HT & HIV 1 case, HT & thyrotoxicosis 1 case, HT & venous thromboembolism (VTE) 5 cases, HT & VTE & hypothyroidism 1 case, hypothyroidism 1 case, thyrotoxicosis 1 case, VTE 4 cases, lymphoma 1 case, psoriasis 1 case, previous left ureteric injury 1 case;
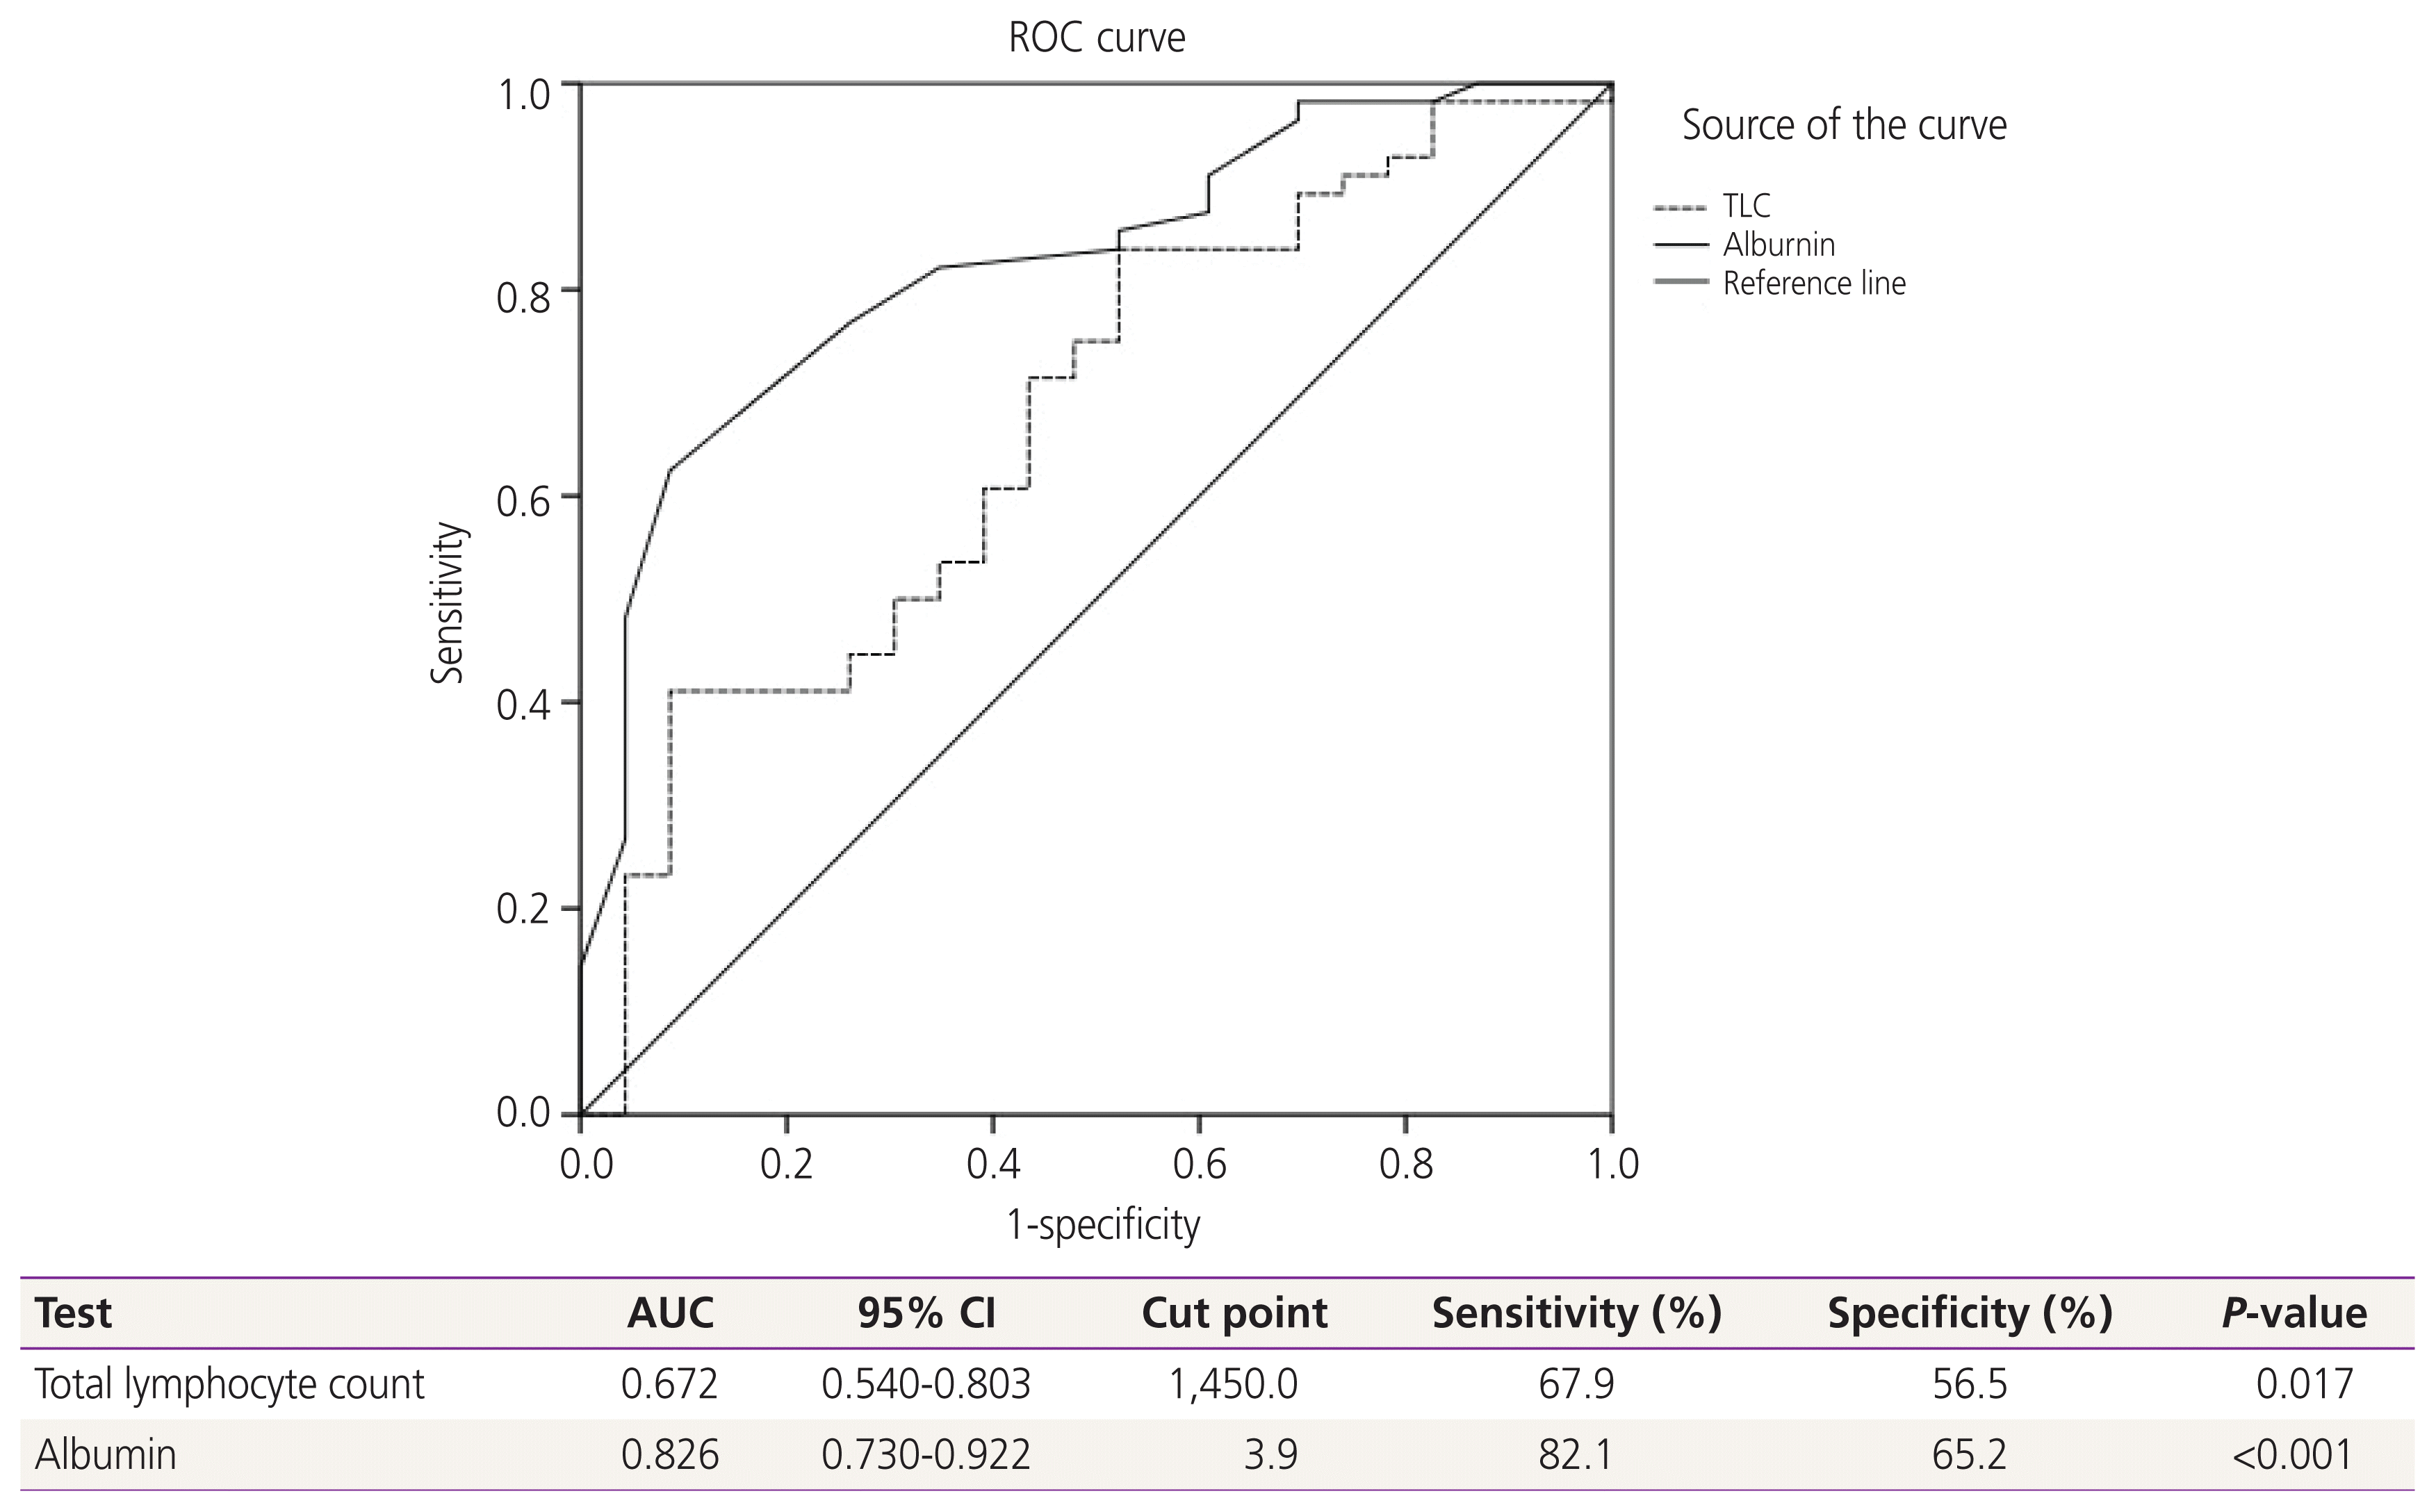
 | Fig. 2Receiver-operating-characteristics (ROC) and area under the curve (AUC) for relationship of clinicopathologic parameters to malnourishment. A receiver operating characteristic curve (ROC) analysis of the total lymphocyte count (TLC) and albumin level for the prediction of nutritional status revealed a significant area under the curve=0.672 for TLC and 0.826 for albumin level. Therefore, the most effective cut-off point of TLC was 1,450 cells/μL, and for albumin was 3.9 g/dL. Diagonal segments are produced by ties. CI, confidence interval. |
Table 2
| Value | |
|---|---|
| PG-SGA score | |
| 0–1 | 22 (21.8) |
| 2–3 | 24 (23.8) |
| 4–8 | 31 (30.7) |
| 9–27 | 24 (23.8) |
| PG-SGA classification | |
| Well nourished | 74 (73.3) |
| Moderately malnourished | 19 (18.8) |
| Severely malnourished | 8 (7.9) |
Table 3
| Well nourished (n=74) | Not well nourished (n=27) | P-valuea) (95% CI) | |
|---|---|---|---|
| TLC (cells/μL) | 1,754.770±629.030 | 1,360.000±712.370 | 0.017 (74.550–714.830) |
| Albumin (g/dL) | 4.200±0.383 | 3.650±0.530 | <0.001 (0.303–0.802) |
Table 4
| Factor | Total | Number of patients divided by nutritional status | Univariate analysisa) | Multivariate analysisb) | |||
|---|---|---|---|---|---|---|---|
|
|
|
|
|||||
| Well-nourished | Malnourished | OR (95% CI) | P-value | Adjusted OR (95% CI) | P-value | ||
| First diagnosis of recurrence | 53 | 42 (79.2) | 11 (20.8) | 1.909 (0.780–4.672) | 0.181 | - | - |
|
|
|||||||
| 48 | 32 (66.7) | 16 (31.3) | |||||
|
|
|||||||
| First line CMT | 64 | 49 (76.5) | 15 (23.5) | 1.568 (0.638–3.853) | 0.357 | - | - |
|
|
|||||||
| 2nd to 6th line CMT | 37 | 25 (67.5) | 12 (32.5) | ||||
|
|
|||||||
| Number CMT cycles | |||||||
|
|
|||||||
| >3 | 44 | 39 (88.6) | 5 (11.4) | 4.903 (1.677–14.335) | 0.003 | 3.293 (0.868–12.491) | 0.080 |
|
|
|||||||
| ≤3 | 57 | 35 (61.4) | 22 (38.6) | ||||
|
|
|||||||
| Age (yr) | |||||||
|
|
|||||||
| ≤60 | 64 | 47 (73.4) | 17 (26.6) | 1.024 (1.006–0.983) | 1.000 | - | - |
|
|
|||||||
| >60 | 37 | 27 (73.0) | 10 (27.0) | ||||
|
|
|||||||
| Stage | |||||||
|
|
|||||||
| I & II | 28 | 19 (67.8) | 9 (32.2) | 0.691 (0.266–1.796) | 0.460 | - | - |
|
|
|||||||
| III & IV | 73 | 55 (75.3) | 18 (24.7) | ||||
|
|
|||||||
| Albumin (g/dL)c) | |||||||
|
|
|||||||
| >3.95 | 54 | 46 (85.2) | 8 (14.8) | 8.625 (2.879–25.840) | <0.001 | 6.709 (2.113–21.304) | 0.001 |
|
|
|||||||
| ≤3.95 | 25 | 10 (40.0) | 15 (60.0) | ||||
|
|
|||||||
| BMI (kg/m2) | |||||||
|
|
|||||||
| ≤25 | 74 | 50 (67.5) | 24 (32.5) | 3.840 (1.052–14.022) | 0.042 | 2.389 (0.531–10.735) | 0.256 |
|
|
|||||||
| >25 | 27 | 24 (88.9) | 3 (11.1) | ||||
|
|
|||||||
| TLC (cells/μL) | |||||||
|
|
|||||||
| ≥1,450 | 60 | 49 (81.7) | 11 (18.3) | 2.851 (1.152–7.056) | 0.024 | 1.875 (0.538–6.532) | 0.324 |
|
|
|||||||
| <1,450 | 41 | 25 (61.0) | 16 (39.0) | ||||
|
|
|||||||
| Anemia | |||||||
|
|
|||||||
| No | 52 | 43 (82.7) | 9 (17.3) | 2.774 (1.101–6.988) | 0.027 | 2.067 (0.591–6.769) | 0.265 |
|
|
|||||||
| Yes | 49 | 31 (63.3) | 18 (36.7) | ||||
|
|
|||||||
| Leukopenia | |||||||
|
|
|||||||
| No | 65 | 46 (70.8) | 19 (29.2) | 0.692 (0.267–1.789) | 0.446 | - | - |
|
|
|||||||
| Yes | 36 | 28 (77.8) | 8 (22.2) | ||||
|
|
|||||||
| Neutropenia | |||||||
|
|
|||||||
| No | 48 | 30 (62.5) | 18 (37.5) | 0.341 (0.135–0.860) | 0.020 | 0.343 (0.103–1.142) | 0.076 |
|
|
|||||||
| Yes | 53 | 44 (83.0) | 9 (17.0) | ||||
|
|
|||||||
| Thrombocytopenia | |||||||
|
|
|||||||
| No | 89 | 66 (74.1) | 23 (25.9) | 1.435 (0.395–5.216) | 0.582 | - | - |
|
|
|||||||
| Yes | 12 | 8 (66.7) | 4 (33.3) | ||||
|
|
|||||||
| Surgery | 70 | 54 (77.1) | 16 (22.9) | 0.539 (0.214–1.356) | 0.225 | - | - |
|
|
|||||||
| No surgery | 31 | 20 (64.5) | 11 (35.5) | ||||
|
|
|||||||
| No UD | 52 | 38 (73.1) | 14 (26.9) | 0.980 (0.406–2.367) | 1.000 | - | - |
|
|
|||||||
| Present UD | 49 | 36 (73.5) | 13 (26.5) | ||||
|
|
|||||||
| PT regimen | 58 | 45 (77.6) | 13 (22.4) | 1.671 (0.688–4.059) | 0.266 | - | - |
|
|
|||||||
| Non PT regimen | 43 | 29 (67.4) | 14 (32.6) | ||||
Values are presented as number (%). Anemia, hemoglobin less than 10 gm%; leukopenia, total white blood cell count less than 3,000 cell/mm3; neutropenia, absolute neutrophil count less than 1,500 cell/mm3; thrombocytopeniaplatelet count less than 100,000 cell/mm3.


 PDF
PDF Citation
 Print
Print


 XML Download