

 PDF
PDF Citation
 Print
Print


INTRODUCTION
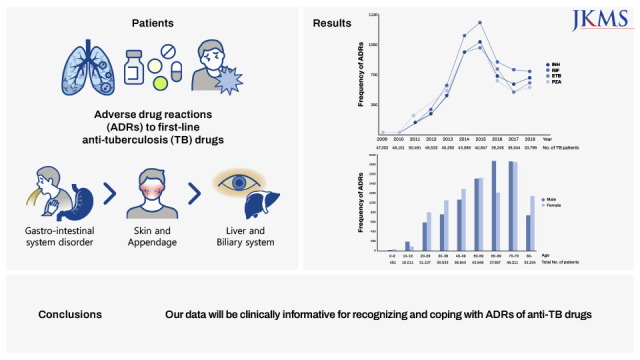
Tuberculosis (TB) is one of the main public health issues worldwide. According to the World Health Organization (WHO) in 2020, 10 million people became ill with TB and 1.5 million died in 2020.1 Although the treatment of choice for TB is taking anti-TB drugs, adverse drug reactions (ADRs) to first-line TB drugs are associated with substantial morbidity. Moreover, these ADRs result in interruption or revision of the anti-TB treatment that could cause treatment failure and mortality in TB patients.2 The prevalence of ADRs to anti-TB drugs, especially first-line, has been reported from 8% to 83.5% in global studies,3 and 2.5% to 50% in Korean cohort studies.45 There have been few reports of large-scale epidemiologic studies on ADRs to anti-TB drugs especially in Korea.
The Korea Adverse Event Reporting System (KAERS) is a spontaneous adverse event (AE) reporting system in Korea. KAERS is a system developed by Korea Institute of Drug Safety and Risk Management (KIDS) to facilitate reporting and management of AE reports. Anyone who experiences potential ADRs can report spontaneously using KAERS to the Ministry of Food and Drug Safety directly or via the Regional Pharmacovigilance Centers. The report rate has gradually increased, and since 2016, it has been showing more than 200,000 cases per year.67 KAERS database has been utilized to detect ADR signals and produce evidence for making effective policies on the safe use of drugs.89
In this background, this study aimed to investigate the clinical characteristics of ADRs to first-line anti-TB drugs including frequencies, common clinical manifestations, time-to-onset and clinical characteristics of ADRs in elderly TB patients using a nationwide KAERS database from 2009 to 2018.
METHODS
Database
This retrospective study used raw data from KAERS database. The KIDS collects, manages, and provides information on ADRs by KAERS database. After screening and removing data errors, the collected data is coded into eight standardized tables; which are 1) basic information, 2) drug information, 3) side effect information, 4) serious cases information, 5) reporter information, 6) causality evaluation information, 7) medical history information, and 8) group information. Then it is provided as raw data on drug side effects (KIDS KAERS database, KIDS-KD). The basic information table contains the basic information of the report, as well as patient gender and age information. The drug information table includes the WHO Anatomical Therapeutic Chemical code of the administered drug, the start date of administration, and the action taken after the side effect. In the side effect information table, information on AEs such as the WHO Adverse Reaction Terminology (WHO-ART) code of the side effect and the date of symptom onset is shown. If the AE was a serious AE, detailed information such as death, life threatening, congenital anomaly, hospitalization or extension of hospitalization period was checked in the serious case information table. In the causality evaluation information table, causality information was confirmed by drug and AE combination. In the medical history information table, the patient's medical history information was confirmed by using the Korean Standard Classification of Diseases (KCD) code.
Case selection
The subjects of this study were from January 1, 2009 to December 31, 2018 as of the completion date of reporting to KIDS. During the study period, only the cases of having KCD code related "Pulmonary TB (A15-16)" or "Extrapulmonary TB (A17-A19)" (except for cases involving R 76.80 related to latent TB) AND having ATC code of first-line anti TB drugs (Isoniazid [INH], Rifampin [RIF], Ethambutol [ETB], Pyrazinamide [PZA]) (J04AB02, J04AC01, J04AK01, J04AK02, J04AM02, J04AM05, J04AM06) were extracted. The causality assessments were done according to the WHO-Uppsala Monitoring Center System, categorized as “certain,” “probable,” “possible,” “unlikely,” and “unclassified.”10 Cases were selected which were “possible,” “probable,” or “certain” in this study. Serious ADRs were defined as “disability,” “deformity,” “threat,” “death,” “hospitalizations,” and “others.” Adverse cases are described in WHO-ART (ver. 092) which uses a hierarchical information classified in the order of System Organ Class, High Level Term, and Preferred Term levels.1112 Hepatic function abnormality included eleven WHO-ART terms such as hepatic enzyme increased, hepatic function abnormal, SGOT increased, SGPT increased, jaundice, hepatitis, gamma-GT increased, bilirubinemia, hepatocellular damage, and cholecystitis. Rash included three WHO-ART terms such as rash, rash maculopapular, and rash erythematous.
Statistical analysis
Firstly, annual frequencies of ADRs by four anti-TB drug groups (INH, RIF, ETB, and PZA) from 2009 to 2018 were investigated. Then, we stratified total ADRs frequencies by age. Additionally, we investigated common clinical manifestation of ADRs to first-line anti-TB drugs, total frequencies of ADRs and severe hypersensitivity reactions by four anti-TB drug groups (INH, RIF, ETB, and PZA) were analyzed. Finally, time-to-onset of ADR occurrence, and clinical characteristics of ADRs in elderly TB patients (≥ 60 years old) were investigated. The clinical characteristics of ADRs according to the culprit anti-TB medication and their frequencies were analyzed using R, version 4.0.2 (R Foundation for Statistical Computing, Vienna, Austria).
RESULTS
Frequency of ADRs to first-line anti-TB drugs from 2009 to 2018
A total of 1,562,024 ADRs were reported in the KIDS-KAERS database from 2009 to 2018, where ADRs to first-line anti-TB drugs were 17,843 cases (1.14%). RIF (5,115, 28.7%) had the most frequent ADRs, followed by INH (4,289, 24.0%), PZA (4,260, 23.9%), and ETB (4,179, 23.4%). The annual frequency of ADRs for each drug and the registry number of new TB patients are shown in Fig. 1.13 While the registry number of new TB patients is decreasing year by year, all four drugs showed a steady increase in the number of ADRs from 2009, the highest in 2015 (INH 977 cases; RIF 1,181; ETB 920; and PZA 976), and a plateau until 2018.
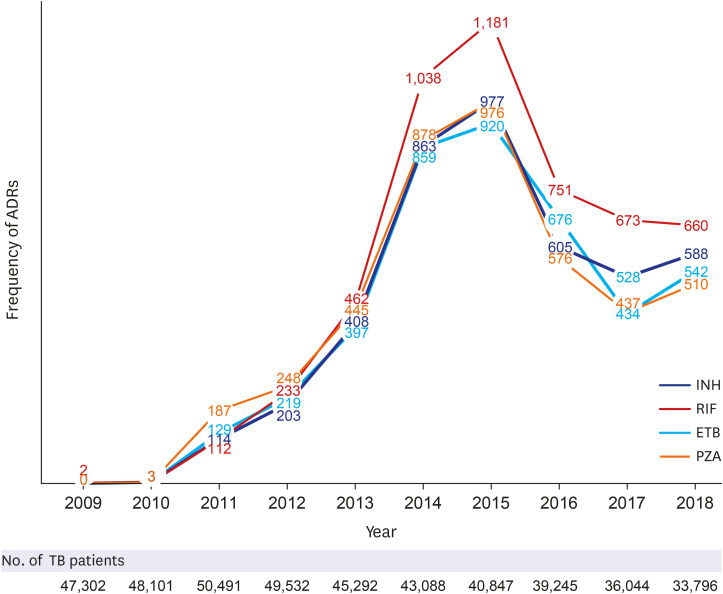
Fig. 1
Frequencies of ADRs to first-line anti-TB drugs from 2009 to 2018. To estimate the changes in the number of adverse drug reactions reported by year, the total number of patients newly diagnosed with tuberculosis from the Annual Report on the Notified Tuberculosis in Korea was summarized using a figure.
ADR = adverse drug reaction, TB = tuberculosis, INH = isoniazid, RIF = rifampicin, ETB = ethambutol, PZA = pyrazinamide.
![]()
Demographics of the ADRs to anti-TB drugs
Frequencies of ADRs of first-line anti-TB drugs according to age and sex and the registry number of new TB patients by age are described in Fig. 2.12 There were 8,737 cases in male patients (49.0%), and 8,660 cases (48.5%) were reported in older patients (≥ 60 years). When we compared the causality assessment of ADRs for each drug, the frequency of “certain” is most frequent in RIF than other drugs (162 vs.211) (Supplementary Table 1). The frequency of serious ADRs was 1,210 cases (6.78%), and the most common causative drug of serious ADRs was RIF (401/1210 cases, 33.1%). Even death was reported for each drug: ETB (2), INH (1), RIF (1), and PZA (1) (Supplementary Table 2).
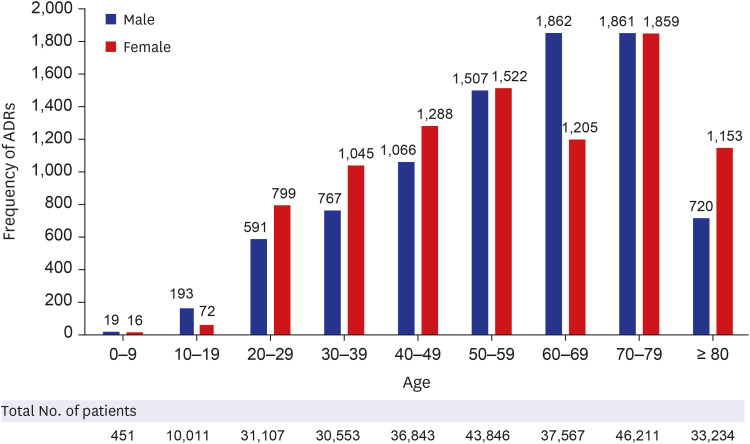
Fig. 2
Frequencies of ADRs of first-line anti-tuberculosis drugs according to age and sex. To estimate the difference in the number adverse drug reactions reported by age group, the total number of patients newly diagnosed with tuberculosis in Korea, by age group, during the study period, was summarized in a figure. Data were compiled from the Annual Report on the Notified Tuberculosis in Korea from 2011 to 2018. The data from the years 2009 to 2010 were not obtained due to differences in the counting method of the Annual Report.
ADR = adverse drug reaction.
![]()
Common clinical manifestations of the ADRs to anti-TB drugs
When we classified ADRs according to organ system involvement, cases of gastrointestinal (GI) system disorders were the most common (5,713, 32.0%), followed by skin and appendage (4,615, 25.9%), liver and biliary system (2,531, 14.2%), central and peripheral nervous system (1,267, 7.1%), and generalized symptoms (850, 4.8%) (Fig. 3). The 27 most common ADRs are listed in Table 1. Nausea was the most common ADR (2,611, 14.6%), followed by hepatic enzyme abnormality (2,531, 14.2%), rash (2,089, 11.7%), pruritus (1,617, 9.1%), vomiting (1,587, 8.9%), urticaria (740, 4.2%), anorexia (692, 3.9%), dyspepsia (623, 3.5%), dizziness (587, 3.3%), and arthralgia (553, 3.1%). Similar to the classification according to organ system involvement, ADRs in the GI system, liver, and biliary system were common. However, ADRs of other systems such as hyperuricemia (343, most frequently caused by PZA, 261) and eosinophilia (136, most frequently caused by RIF, 45) were also found. When the common symptoms were classified by culprit drug, RIF for leucopenia and thrombocytopenia; ETB for vision abnormalities; PZA for arthralgia and hyperuricemia were common.
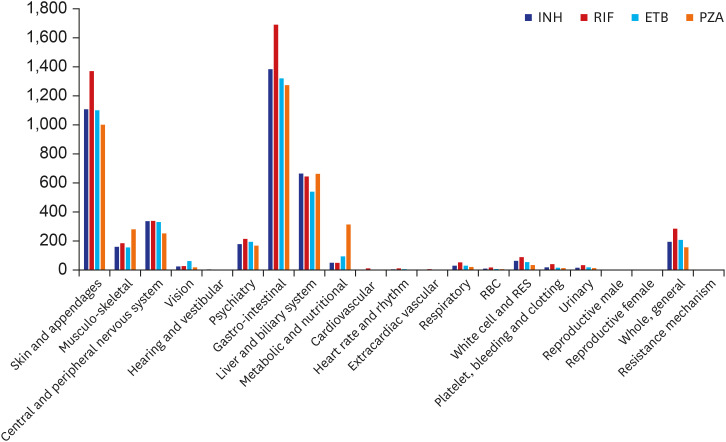
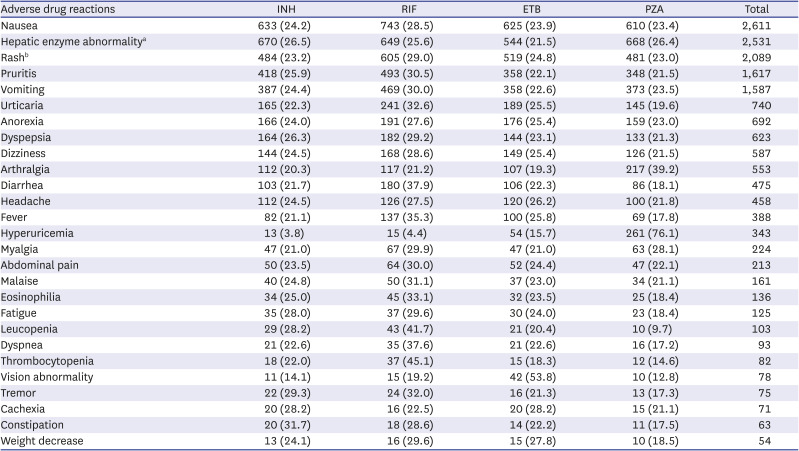
Fig. 3
Frequencies of adverse drug reactions to first-line anti-tuberculosis drugs according to organ systems.
INH = isoniazid, RIF = rifampicin, ETB = ethambutol, PZA = pyrazinamide, RBC = red blood cell, RES = reticulo-endothelial system.
![]()
Table 1
Frequencies of adverse drug reactions to first-line anti-tuberculosis drugs
Data are shown as numbers (row %).
INH = isoniazid, RIF = rifampicin, ETB = ethambutol, PZA = pyrazinamide.
aHepatic enzyme abnormality includes hepatic enzyme increased, hepatic function abnormal, SGOT increased, SGPT increased ‘jaundice, hepatitis, gamma-GT increased, bilirubinemia, hepatocellular damage, and cholecystitis’; bRash includes ‘rash, rash maculopapular and rash erythematous’.
![]()
A total of 56 cases of severe hypersensitivity reactions, including severe cutaneous adverse reactions (SCARs), hypotension, and anaphylaxis have been reported, most commonly caused by RIF (25, 44.6%), followed by INH (12, 21.4%), ETB (12, 21.4%), and PZA (7, 12.5%) (Table 2).
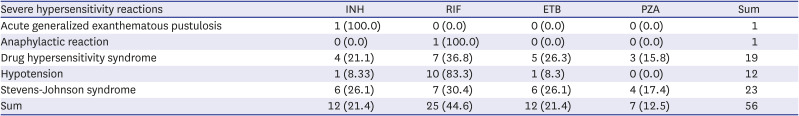
Table 2
Frequencies of severe hypersensitivity reactions to first-line anti-tuberculosis drugs
![]()
Time-to-onset of ADRs to first-line anti-TB drugs
We analyzed the frequency of each ADR according to the time-to-onset. Most ADRs occurred within 1 month except acne, most of which (76.5%) occurred after 2 months. Most GI and skin manifestations, including nausea, vomiting, and anorexia manifested within 1 month after initiation of the anti-TB medications, while hepatic dysfunction, renal dysfunction, neuropathy, paresthesia and hematologic changes such as leukopenia, thrombocytopenia, or eosinophilia also often occurred more than 1 month and even after 2 months initiation of the anti-TB medications (Table 3). When limited to serious ADRs, severe allergic reactions such as urticaria, angioedema, or pruritus mainly occurred within 1 month, while hypersensitivity reactions including Stevens-Johnson syndrome appeared 1 months after anti-TB treatment (Supplementary Table 3).
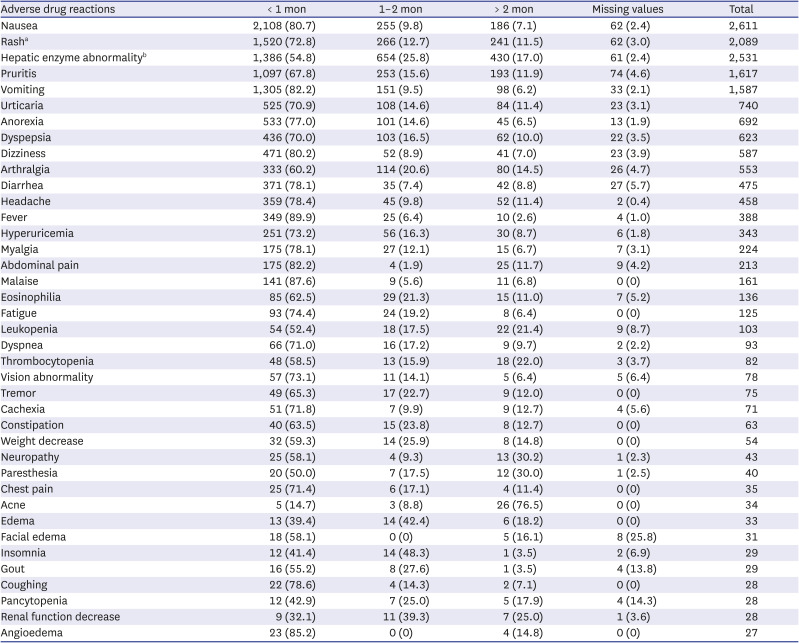
Table 3
Adverse drug reactions to first-line anti-tuberculosis drugs according to time-to-onset
Data are shown as numbers (row %).
aRash includes ‘rash, rash maculopapular and rash erythematous’; bHepatic enzyme abnormality includes hepatic enzyme increased, hepatic function abnormal, SGOT increased, SGPT increased ‘jaundice, hepatitis, gamma-GT increased, bilirubinemia, hepatocellular damage, and cholecystitis’.
![]()
Clinical characteristics of ADRs to anti-TB drugs in older patients
The proportion of each organ system involvement of ADRs in older patients was 36.4%, 24.8%, and 11.4% in the GI, skin, and hepatobiliary systems, respectively, which was 48.0%, 46.2%, 29.1% in patients < 60 years old. The proportion of elderly was higher than that of younger people in vomiting (925, 58.3% vs. 650, 41.0%), anorexia (522, 75,4% vs. 159, 23.0%), malaise (105, 65,2% vs. 56, 34,8%), constipation (47, 74.6% vs. 15, 23.8%), weight loss (38, 70.4% vs. 16, 29.6%), hematologic abnormalities such as eosinophilia (90, 67.6% vs. 44, 32.4%), thrombocytopenia (68, 83.0% vs. 13, 15.9%) and renal function abnormalities (22, 78.6% vs. 6, 21.4%) (Table 4).
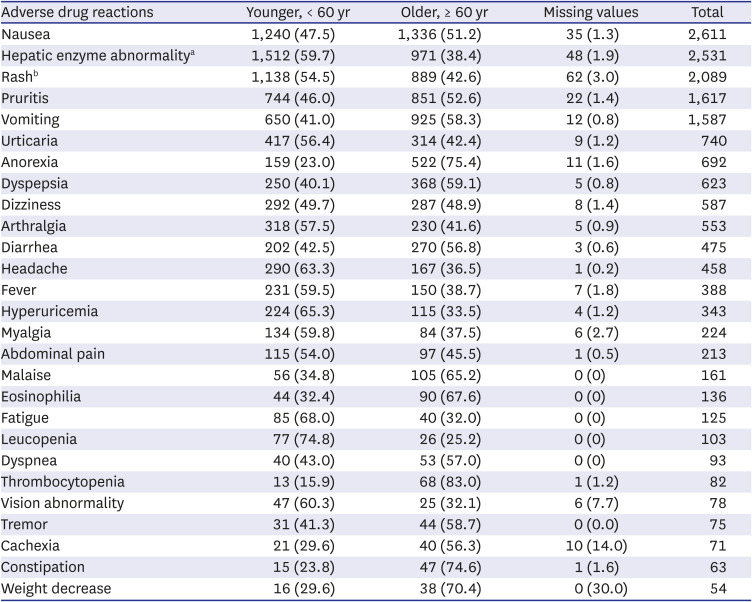
Table 4
Adverse drug reactions to first-line anti-TB drugs according to age group
Data are shown as numbers (row %).
aHepatic enzyme abnormality includes hepatic enzyme increased, hepatic function abnormal, SGOT increased, SGPT increased ‘jaundice, hepatitis, gamma-GT increased, bilirubinemia, hepatocellular damage, and cholecystitis’; bRash includes ‘rash, rash maculopapular and rash erythematous’.
![]()
DISCUSSION
In this study, we analyzed the frequencies and clinical manifestations of ADRs of first-line anti-TB drugs using the KIDS-KAERS database for 10 years (2009–2018). The steady increase in ADRs at the beginning is due to the build-up phase of KAERS in Korea. RIF is the most common culprit anti-TB drug for ADRs, and the GI, skin, and hepatic organs are the most commonly involved organ systems. GI symptoms and mild allergic reactions occurred within 1 month of anti-TB treatment, while hepatic dysfunction, renal dysfunction, hematologic, and severe hypersensitivity reactions could appear 2 months after anti-TB treatment.
The incidence of ADRs to anti-TB drugs, particularly first-line anti-TB drugs, has been reported to vary widely. Dhingra et al.14 reported that 8.4% of patients had ADRs in a prospective study in India and Lv et al.15 reported that the incidence of ADRs was 15.1% in a prospective study in China. An Iranian prospective study showed an incidence of 53.5%, which was higher than that in the previous two studies.16 The prevalence of TB ADRs in Western countries has also been reported to varying degrees. Yee et al.17 reported that the incidence of serious ADRs was 10.7% in a Canadian prospective study, but the overall incidence of ADRs was 83.5% in a Brazilian prospective study.18 The variability in prevalence is presumed to be due to several differences, such as differences in race; the cognitive difference of ADRs according to the study design, that is, the difference between subjective reporting and findings by the researcher; differences according to whether the subject has an underlying disease; differences between HIV coinfection itself and drug-to-drug interaction with anti-viral drugs, among others.3
One study in Korea reported that the prevalence of ADRs to anti-TB drugs was 52.6%, where medical staff directly tracked ADRs and collected information in a prospective study, while the other study reported a prevalence of 2.5% where ADRs were collected in a retrospective study.45 Studies in which researchers closely identified ADRs are thought to directly detect them better and measure their prevalence higher than studies in which they did not. Although the prevalence could not be determined because the number of TB patients could not be obtained in this study, the frequency of ADRs with anti-TB drugs was 17,843 cases over 10 years, 1.14% of the total ADRs. Given the considerable prevalence and frequency, ADRs of first-line anti-TB drugs are of clinical importance; therefore, clinicians should pay attention to ADRs to anti-TB drugs while managing TB patients.
Old age is one of the important factors involved in the development of ADRs of anti-TB drugs in several previous studies.192021 This study also showed more ADRs in patients over 60 years old, even though we could not compare the exact prevalence. The pattern of frequently involved organs in older patients was similar to that in patients < 60 years old. However, in some symptoms of ADRs, including eosinophilia, thrombocytopenia, and renal dysfunction, the proportion of these ADRs in the elderly was higher than that in the younger TB patients. These ADRs require more attention, especially in older patients, because these ADRs can be more fatal than other ADRs.
In this study, the frequency of each ADR was in the following order: nausea (14.6%), rash (11.5%), hepatic enzyme increase (10.78%), pruritus (9.06%), vomiting (8.89%), etc. While the liver and biliary system abnormalities accounted for a higher proportion in previous studies in many countries, including China, Iran, Canada, and Germany (26.1–45.3%), the frequency was relatively low in this study (10.78%).4141517 Meanwhile, in one Korean study, like this study, the frequency of GI symptoms (19.3%) and cutaneous symptoms (17.7%) was higher than the frequency of hepatic function abnormality (13.8%).4 It might be due to biological and ethnic differences, along with socio-cultural differences. This study also identified the time-to-onset of ADRs. Skin and GI symptoms occurred within a relatively short time within 1 months, but hepatotoxicity, hematological abnormalities, and nephrotoxicity were reported even after 2 months. This time-to-onset was similar to that reported in previous studies.1516 Therefore, it is important to recognize that some ADRs may occur even after 2–3 months of administration of anti-TB drugs. In addition, although rare, allergic reactions such as anaphylaxis and SCARs were also identified in this study. Looking at the time-to-onset, urticaria, itchiness, angioedema, and anaphylaxis appeared within 1 month, while SCAR appeared after 2 months. It is plausible that the former is an acute type I reaction, and the latter is a delayed type IV reaction. Recently, SCAR caused by anti-TB drugs has been reported in the SCAR registry in Korea. Drug reaction with eosinophilia and systemic symptoms (DRESS) was the most common among Stevens-Johnson syndrome/toxic epidermal necrolysis and DRESS. RIF was the most common causative drug of SCAR, which may be in line with the high frequency of cutaneous ADRs caused by RIF in our study.2223
There are several limitations to the present study. First, as the KIDS-KAERS database was a voluntary ADR reporting system, and most cases were reported by medical professionals such as doctors, pharmacists, and nurses. However, their participation was not mandatory. In addition, ADRs of interest to medical staffs or related objective data such as blood test abnormality may be reported more easily and frequently, whereas subjective complaints of patients may be less likely to be reported by the patients. Second, it is possible that the report was delayed or that some cases had several missing values. Third, the cases were obtained as spontaneous ADR reports without control, so only frequency of ADRs could be suggested. Fourth, additional information, such as the subject's underlying diseases, co-administered medication, and hospitalization could not be obtained. Nevertheless, the strength of this study is that the ADRs of the first-line anti-TB drugs were examined in various ways in a large and long-term database for the first time in Korea.
In conclusion, ADRs of first-line anti-TB drugs were investigated through the KAERS database (2009–2018) for the first time in Korea. RIF (28.7%) was the most common causative agent. Gastro-intestinal system disorder (32.0%), skin and appendage (25.9%), liver and biliary system (14.2%) were frequently reported. Nausea (14.6%), rash (11.7%), hepatic enzyme abnormality (14.2%), and pruritus (9.1%) were common ADRs. GI and cutaneous symptoms manifested within 1 month, but hepatic and renal dysfunction, and hematologic abnormality also occurred after 2 months. The proportion of elderly was higher than that of younger people in vomiting, anorexia, malaise, eosinophilia, thrombocytopenia, constipation, and weight loss.
Key messages: 1) ADRs are relatively common in older patients and are frequently associated with GI, skin, and liver function abnormalities. 2) Nausea was the most common ADR, followed by hepatic enzyme elevation, rash, pruritus, vomiting, and urticaria. 3) Most ADRs appeared within 1 month, however, ADRs such as neuropathy, paresthesia, hematologic abnormalities, renal function abnormalities, liver enzyme abnormality, etc. were also often reported after 2 months. 4) Regular long-term monitoring for ADR during anti-TB medication is necessary, especially among the older TB patients.
 XML Download