Abstract
Objective
To identify and investigate differences in spinal fusion between the normal and osteopenic spine in a rat model.
Methods
Female Sprague Dawley rats underwent either an ovariectomy (OVX) or sham operation and were randomized into two groups: non-OVX group and OVX group. Eight weeks after OVX, unilateral lumbar spinal fusion was performed using autologous iliac bone. Bone density (BD) was measured 2 days and 8 weeks after fusion surgery. Microcomputed tomography was used to evaluate the process of bone fusion every two weeks for 8 weeks after fusion surgery. The fusion rate, fusion process, and bone volume parameters of fusion bed were compared between the two groups.
Results
BD was significantly higher in the non-OVX group than in the OVX group 2 days and 8 weeks after fusion surgery. The fusion rate in the non-OVX group was higher than that in the OVX group 8 weeks after surgery (p=0.044). The bony connection of bone fragments with transverse processes and bone formation between transverse processes in non-OVX group were significantly superior to those of OVX group from 6 weeks after fusion surgery. The compactness and bone maturation of fusion bed in non-OVX were prominent compared with the non-OVX group.
Conclusion
The fusion rate in OVX group was inferior to non-OVX group at late stage after fusion surgery. Bone maturation of fusion bed in the OVX group was inferior compared with the non-OVX group. Fusion enhancement strategies at early stage may be needed to patients with osteoporosis who need spine fusion surgery.
Although instrumentation and techniques for spinal fusion surgery have improved in recent years, a nonunion rate of 10–40% limits its success and may negatively affect clinical outcomes3,7,14). Therefore, an understanding of the biology of spinal fusion is essential for spine surgeons. Clinically relevant animal models of lumbar fusion provide important biological, histological, and radiological information about the fusion bed between the transverse processes (TPs)2,9). Endochondral bone formation via a cartilage intermediate occurs centrally in the fusion bed between the upper and lower halves of the bridging bone, and intramembranous bone formation occurs near the decorticated TPs14,21).
Osteoporosis induces negative bone remodeling, which delays bone fusion1,8). Because osteoporosis is related to poor fusion and bone stability, it is crucial to identify differences in the bone fusion process between the osteoporotic and nonosteoporotic spine. The processes of fracture repair and spinal fusion have been described in nonosteoporotic animal models5,16). Fracture repair and spinal fusion progress through similar stages at the fracture site or fusion bed: an inflammatory response, fibrocartilage formation, hard callus formation and bone remodeling16). An animal study found that if fusion had not occurred by 4 weeks after surgery, the fusion rate did not increase after 10 weeks4). Therefore, to overcome fusion failure in patients with osteoporosis, it is important to understand whether there are differences between patients with and without osteoporosis during the early period of bone fusion. Few studies have investigated the negative influence of osteoporosis on the early period of fracture healing12,20). The bone formation in spine fusion is de no bone formation in disc space or inter-transverse processes that are not the area of bony structure. Because of that, we think the basic study related with the bone formation in osteoporotic spine fusion should be needed. Many studies showed the effect of anti-osteoporosis on spine fusion in animal study14,15,17). These studies just described the difference of the fusion rate between non-osteopenic and osteopenic animals. There is no study has compared the spinal fusion process in living osteopenic and nonosteopenic animal models. The aim of this study was to use microcomputed tomography (micro-CT) to identify and evaluate radiological differences in the spinal fusion process in living osteopenic and nonosteopenic rats.
Ten-week-old female Sprague Dawley rats (n=36) were purchased from Orient Bio (Seongnam, Korea) and housed singly in pathogen-free ventilated cages with a 12-h light/dark cycle. The rats were allowed free access to tap water and standard rodent chow (Cargill, Seongnam, Korea) that contained 1.35% (w/w) calcium, 0.44% (w/w) phosphate, and no vitamin D. Although a low-calcium diet (<0.3% w/w) can lower bone mineral density (BMD), the chow used here does not affect BMD13).
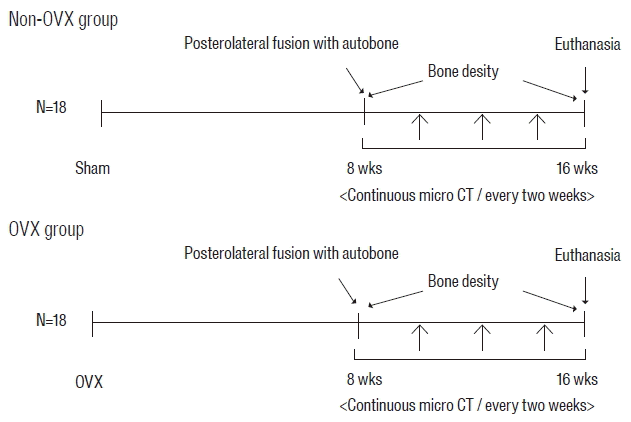
After 2 weeks of acclimatization, 18 rats underwent ovariectomy (OVX) to induce osteopenia, and the other 18 underwent a sham operation. There was a significant decrease in BMD six weeks after OVX in the rat14). Therefore, after 8 weeks, all rats underwent unilateral posterolateral intertransverse fusion with autologous iliac bone (AIB). Anesthesia was induced with 5% isoflurane and maintained with 2.5% isoflurane; during maintenance, oxygen was supplied through a coaxial nose cone. A posterior midline incision was made over the spinous process on L4–5. After the right-side dorsal incision, the L4 and L5 TPs were exposed by muscle splitting between the multifidus and erector spinae muscles4,19). The cortical bone of the L4 and L5 TPs was decorticated with an electric burr under microscopy, and about 0.25 g of AIB was harvested from the ipsilateral iliac bone. The AIB was inserted between the decorticated L4 and L5 TPs.
The 36 rats were divided into two groups: the OVX group (bilateral OVX+fusion using AIB) and the non-OVX group (sham operated+fusion using AIB). Micro-computed tomograpry (CT) images were taken every 2 weeks for 8 weeks in all rats (Fig. 1). Bone fusion rates and bone density (BD) were obtained from the serial micro-CT images. This experimental protocol was approved by the Institutional Animal Care and Use Committee.
To assess fusion and measure BD, three-dimensional (3D) micro-CT was performed (NFR-Polaris-G90; NanoFocusRay, Jeonju, Korea) on postoperative day 2 and every 2 weeks for 8 weeks after the fusion surgery. Scans were taken from the lower endplate of the S2 vertebral body and proceeded cranially; the scans included 720° views and were acquired at 70 kVp, 80 μA, and 100 ms per frame. The reconstructed image size was 1024×1024 pixels; the voxel size was 56.179 μm×56.179 μm×123.594 μm, and 512 slices were acquired. Successful fusion results in the presence of a bony continuity from the upper TP to the lower TP in the grafted bed. Therefore, we defined fusion as the simultaneous presence of a connection of bridging bone to the TPs and bridging bone between the TPs (Fig. 2B). After fusion, the grafted bone fragments are united with new bone material and the TPs. In osteoporosis, the union of bone fragments may be weaker compared with healthy bone because of an imbalance of osteoblast and osteoclast activities during bone remodeling. Therefore, if there was bridging bone between the TPs, but the bridging bone had no bony connection with the TPs, this was defined as nonfusion (Fig. 2A). To assess the degree of union of bone fragments in the fusion bed, bone morphometric indices, including bone volume (BV) fraction (BV/tissue volume [TV]; BV/TV), bone surface (BS) and specific BS ratio (BS/BV; BS/BV) of the fusion bed, were calculated using a 3D reconstructed image6). BV fraction was defined as the ratio of segmented BV to the total volume of the region of interest, and specific BS was defined as the ratio of the segmented BS to the segmented BV6). Therefore, a high bone fraction and a low BS in the fusion bed indicated new bone formation and a close connection between bone fragments, which we termed compactness. To evaluate the bone fusion process, including the compactness at the graft site, the axial image was converted to a 3D image using Digital Imaging and Communications in Medicine software (Lucion, Infinite, Seoul, Korea)15). To identify BD at 2 days and 8 weeks after fusion surgery, we measured the area between the upper endplate of L4 and the lower endplate of L5 with a threshold of >700 Hounsfield units15). The fusion rate, presence of a fusion mass connected to the TP and bridging bone between TPs, and bone compactness as an indication of bone remodeling, were assessed every 2 weeks after fusion surgery and compared between the groups.
The results are presented as mean±standard deviation. The Pearson chi-square test was used to identify significant differences in fusion status between the groups. The difference in fusion rate over time in each group was analyzed using the McNemar test. A two-sample t-test was used to identify significant differences in BD and bone morphometric indices between the groups. A p-value <0.05 was considered significant.
As expected, there was a significant difference in BD between the non-OVX group and the OVX group at 2 days and 8 weeks after fusion surgery (1.32±0.134 g/cm3 and 1.30±0.117 g/cm3, respectively; p<0.0001, and 1.32±0.191 g/cm3 and 1.29±0.006 g/cm3, respectively; p=0.000). Therefore, the OVX group was osteopenic relative to the non-OVX group.
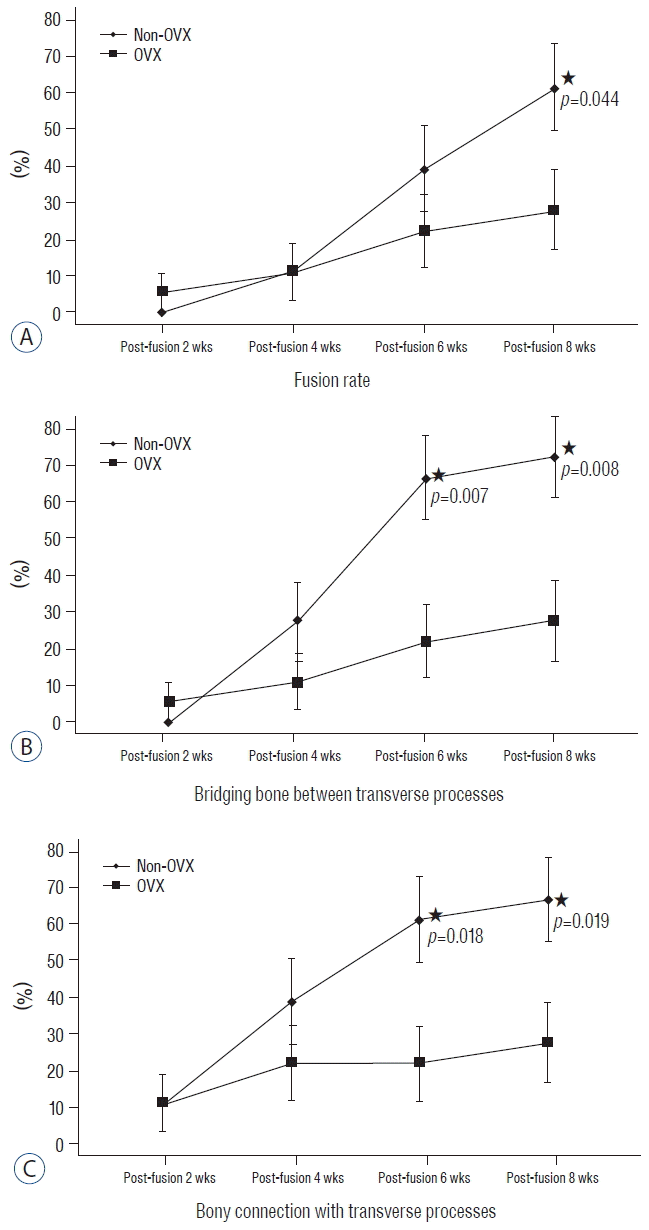
The fusion rates of non-OVX vs. OVX groups at 2, 4, 6 and 8 weeks were 0% (0/18) vs. 5.6% (1/18) (p=0.310), 11.1% (2/18) vs. 11.1% (2/18) (p=1.000), 38.9% (7/18) vs. 22.8% (4/18) (p=0.278) and 61.1% (11/18) vs. 27.8% (5/18) (p=0.044), respectively. In the non-OVX group, the fusion rate at 6 and 8 weeks postfusion surgery increased significantly compared with that at 4 weeks postfusion surgery (p=0.096 and p=0.022, respectively). However, in the OVX group, there was no significant difference in the fusion rates at 4, 6, or 8 weeks postsurgery.
The bony connection of bone fragments with TPs occurs around decorticated TPs and may be produced mainly by intramembranous ossification2). Until 4 weeks after fusion surgery, there was no significant difference between the groups in the rate of bony connection. However, the rate of bony connection in the non-OVX group was higher than that in the OVX group at 6 and 8 weeks postfusion surgery (66.7% vs. 22.2%, p=0.007 and 72.2% vs. 27.8%, p=0.008, respectively). However, endochondral bone formation is involved in the formation of the fusion mass as bridging bone between TPs14). The rate of presence of bridging bone between TPs in the non-OVX and OVX groups did not differ significantly at 4 weeks (38.7% vs. 22.2%, p=0.278). However, the rates of bridging bone in the non-OVX group at 6 and 8 weeks were superior to those in the OVX group (61.1% vs. 22.2%, p=0.018 and 66.7% vs. 27.8%, p=0.019, respectively) (Fig. 3).
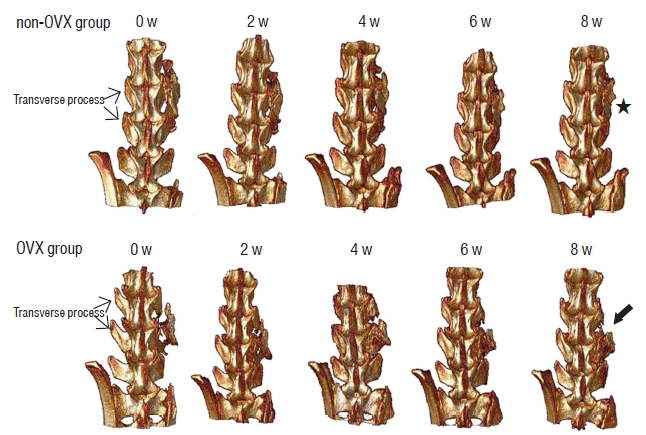
There was no significant difference between the two groups in the bone morphometric indices immediately after fusion surgery. However, the mean value of BV/TV in the non-OVX group was significantly higher than that of the OVX group 4 weeks after fusion surgery (p=0.000), and the mean values of BS and BS/BV in the non-OVX group were lower than those in the OVX group (Table 1). In other words, the volume of bone mass in the fusion bed in the non-OVX group increased, and the amount of the surface of the bone mass that consisted of bone fragments decreased compared with those in the OVX group. These results demonstrated that the union of bone fragments in the fusion bed was superior in the non-OVX group compared with the OVX group. The compactness of the fusion bed is shown in the 3D reconstructed image (Fig. 4). The bone materials in the fusion bed in the OVX group were not fused and became scattered. Therefore, the shape of the bridging bone did not appear as compact as that in the non-OVX group. In addition, if the OVX group did not exhibit a bony continuity of the fusion bed to the TP by the middle of the fusion period (4 weeks postsurgery), the fusion of bridging bone to TP did not occur before the end of the study.
The present study showed radiological differences between living osteopenic and nonosteopenic rats in the spinal fusion process measured longitudinally using micro-CT. Intramembranous bone formation occurs in the area near the TPs, and endochondral bone formation, which involves bone formation through a cartilage intermediate, occurs centrally at the interface between the upper and lower halves of the bridging bone21). From the mid- to late stages of bone formation, bone formation extends toward the central zone and cartilage disappears simultaneously with bone formation in the central area3,5,18). The present study showed the rates of union of bone fragments between the TPs and the connection of bone fragments to the TP were superior in the non-OVX group compared with the OVX group at 6 and 8 weeks after fusion surgery. These results suggest that the OVX group had less prominent endochondral bone formation and less bone maturation than the non-OVX group.
Osteoporosis can reduce osteoblast ability, vascularity, and bone marrow quality in the fusion bed14). As shown in the present study, this can adversely affect the fusion bed. In our study, the intramembranous bone that formed around the decorticated TPs in the OVX group was weaker than that in the non-OVX group. In addition, the formation of bone through endochondral ossification in the fusion bed center was poorer in the OVX group than in the non-OVX group. From immediately after fusion surgery to 8 weeks postsurgery, the BV ratio in the non-OVX group increased significantly compared with that in the OVX group. However, the BS ratio of the non-OVX group decreased significantly. In other words, in the later stages, the process of compaction of the bridging bone through bone remodeling was less complete, suggesting that after spinal fusion, osteoporosis negatively affected endochondral bone formation and bone maturation by bone remodeling. Because the cellular changes after the loss of estrogen include reduced osteoblastogenesis and osteoblast lifespan and increased osteoclastogenesis and osteoclast lifespan, the activity of bone formation in the OVX group may decrease at later stages14). Therefore, the ratio of bone formation may be equal in the OVX and non-OVX groups during the early period of bone formation; however, in the later stages, bone formation in the OVX group may decrease compared with that in the non-OVX group. Because of these differences, spine surgeons should consider the type of graft, the amount of graft material, and the contact surface of the graft material with the fusion bed to increase the fusion rate in osteoporosis patients who need spine fusion surgery.
The present study used micro-CT to evaluate the bone fusion process in a living rat model. The rats did not need to be euthanized, and the spine fusion process could be studied longitudinally using micro-CT in transiently anesthetized living rats. Most previous studies have described changes in the fusion segments obtained from euthanized animals10,11,17). Although the number of rats in the present study was small, the analysis of serial images of living rats may be more meaningful than the analysis of spinal specimens obtained from different rats at different time points.
This study did have some limitations. Although we analyzed serial images of living rats, the number of rats was too small to allow a strong conclusion that would be clinically meaningful. Future studies with a larger number of rats with osteopenic and nonosteopenic spines are needed. To clarify the difference of endochondral and intramembranous ossification between osteopenic and nonosteopenic rats, histological analysis should be shown. There was no histological result in the present study. Although we could not show the endochondral and intramembranous ossifications due to the absence of histologic evaluation, we got the meaningful result with the difference of fusion rate using micro-CT. In the present study, we used only micro-CT to identify and evaluate radiological differences, and we did not collect quantitative data about newly formed bone in the fusion bed. Histological analysis and estimation of bone turnover markers are needed to evaluate the differences in the fusion process between the nonosteopenic and osteopenic spine.
The estrogen-deficient OVX rat group had less endochondral and intramembranous bone formation and bone remodeling compared with the non-OVX group. To increase the fusion rate in the osteopenic spine, strategies are needed to increase bone formation in the early and middle stages after fusion surgery.
Acknowledgements
This research was supported by Basic Science Research Program through the National Research Foundation of Korea (NRF) funded by the Ministry of Science, ICT and future planning (2014R1A2A1A11049662).
References
1. Aldini NN, Fini M, Giavaresi G, Giardino R, Greggi T, Parisini P. Pedicular fixation in the osteoporotic spine: a pilot in vivo study on long-term ovariectomized sheep. J Orthop Res. 20:1217–1224. 2002.
2. Bae HW, Zhao L, Kanim LE, Wong P, Marshall D, Delamarter RB. Bone marrow enhances the performance of rhBMP-2 in spinal fusion: a rodent model. J Bone Joint Surg Am. 95:338–347. 2013.
3. Boden SD. Biology of lumbar spine fusion and use of bone graft substitutes: present, future, and next generation. Tissue Eng. 6:383–399. 2000.
4. Boden SD, Schimandle JH, Hutton WC. An experimental lumbar intertransverse process spinal fusion model. Radiographic, histologic, and biomechanical healing characteristics. Spine (Phila Pa 1976). 20:412–420. 1995.
5. Boden SD, Schimandle JH, Hutton WC, Chen MI. 1995 Volvo Award in basic sciences. The use of an osteoinductive growth factor for lumbar spinal fusion Part I: Biology of spinal fusion. Spine (Phila Pa 1976). 20:2626–2632. 1995.
6. Bouxsein ML, Boyd SK, Christiansen BA, Guldberg RE, Jepsen KJ, Müller R. Guidelines for assessment of bone microstructure in rodents using micro-computed tomography. J Bone Miner Res. 25:1468–1486. 2010.
7. Bridwell KH, Sedgewick TA, O’Brien MF, Lenke LG, Baldus C. The role of fusion and instrumentation in the treatment of degenerative spondylolisthesis with spinal stenosis. J Spinal Disord. 6:461–472. 1993.
8. Coe JD, Warden KE, Herzig MA, McAfee PC. Influence of bone mineral density on the fixation of thoracolumbar implants. A comparative study of transpedicular screws, laminar hooks, and spinous process wires. Spine (Phila Pa 1976). 15:902–907. 1990.
9. Kamoda H, Ohtori S, Ishikawa T, Miyagi M, Arai G, Suzuki M, et al. The effect of platelet-rich plasma on posterolateral lumbar fusion in a rat model. J Bone Joint Surg Am. 95:1109–1116. 2013.
10. Moazzaz P, Gupta MC, Gilotra MM, Gilotra MN, Maitra S, Theerajunyaporn T, et al. Estrogen-dependent actions of bone morphogenetic protein-7 on spine fusion in rats. Spine (Phila Pa 1976). 30:1706–1711. 2005.
11. Nakao S, Minamide A, Kawakami M, Boden SD, Yoshida M. The influence of alendronate on spine fusion in an osteoporotic animal model. Spine (Phila Pa 1976). 36:1446–1452. 2011.
12. Namkung-Matthai H, Appleyard R, Jansen J, Hao Lin J, Maastricht S, Swain M, et al. Osteoporosis influences the early period of fracture healing in a rat osteoporotic model. Bone. 28:80–86. 2001.
13. Omi N, Ezawa I. Animal models for bone and joint disease. Low calcium diet-induced rat model of osteoporosis. Clin Calcium. 21:173–180. 2011.
14. Park SB, Chung CK. Strategies of spinal fusion on osteoporotic spine. J Korean Neurosurg Soc. 49:317–322. 2011.
15. Park SB, Kim CH, Hong M, Yang HJ, Chung CK. Effect of a selective estrogen receptor modulator on bone formation in osteoporotic spine fusion using an ovariectomized rat model. Spine J. 16:72–81. 2016.
16. Schindeler A, McDonald MM, Bokko P, Little DG. Bone remodeling during fracture repair: the cellular picture. Semin Cell Dev Biol. 19:459–466. 2008.
17. Takahata M, Ito M, Abe Y, Abumi K, Minami A. The effect of anti-resorptive therapies on bone graft healing in an ovariectomized rat spinal arthrodesis model. Bone. 43:1057–1066. 2008.
18. Toribatake Y, Hutton WC, Tomita K, Boden SD. Vascularization of the fusion mass in a posterolateral intertransverse process fusion. Spine (Phila Pa 1976). 23:1149–1154. 1998.
19. Wiltse LL, Spencer CW. New uses and refinements of the paraspinal approach to the lumbar spine. Spine (Phila Pa 1976). 13:696–706. 1988.
20. Xu SW, Yu R, Zhao GF, Wang JW. Early period of fracture healing in ovariectomized rats. Chin J Traumatol. 6:160–166. 2003.