

 PDF
PDF ePub
ePub Citation
 Print
Print


INTRODUCTION
MATERIALS AND METHODS
Grade 1 (score 0-25) : no or minimal visual impairment
Grade 2 (score 26-50) : moderate visual impairment
Grade 3 (score 51-75) : severe visual impairment
Grade 4 (score 76-100) : subtotal or complete visual impairment
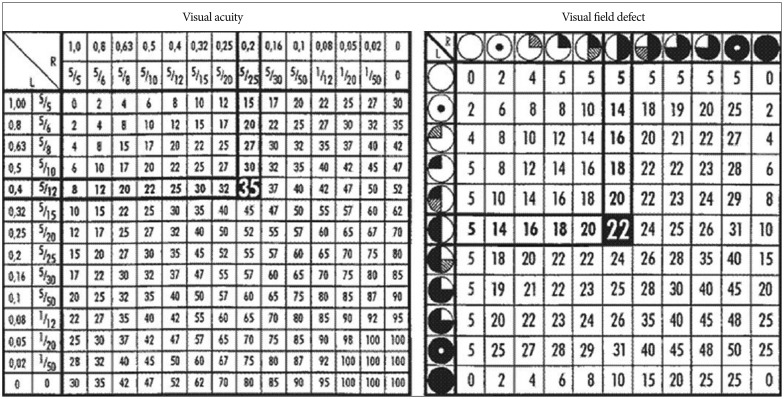 | Fig. 1Tables for calculation of the visual impairment score (VIS) using results of visual acuity and visual field deficit. Sample VIS calculation for a patient with visual acuity of 0.4 (4/10) in the left eye and 0.2 (2/10) in the right eye (visual acuity impairment score of 35), combined with bitemporal visual field deficit (visual field impairment score of 22) for a VIS of 57 is shown.14)
|
Statistical analysis
RESULTS
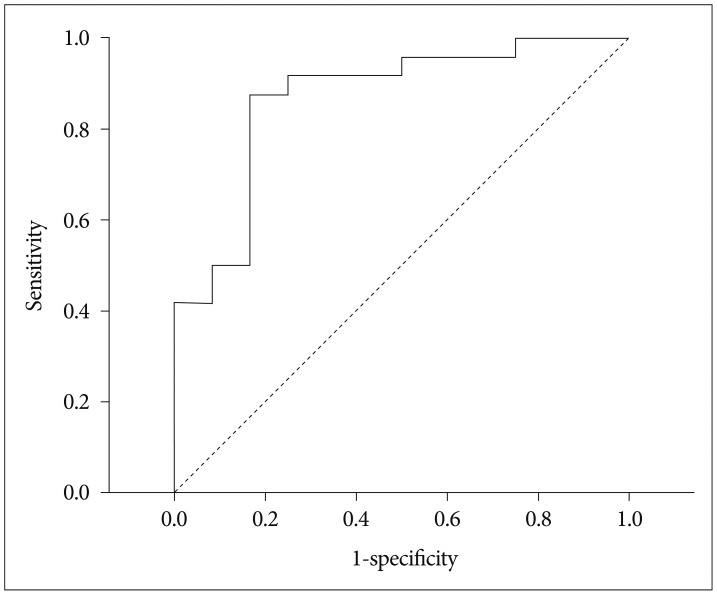 | Fig. 2Receiver operating characteristic (ROC) curve for identifying poor preoperative vision (visual impairment score grade=2, 3, 4) with tumor size. The estimated area under the ROC curve was derived as 0.868 (95% CI=0.739 to 0.997, p-value <0.001). The best cut-off of tumor size was=2.2 cm based on the maximization of Youden index with a sensitivity=87.5% and specificity=83.3%. This cut-off was rounded to 2 for use in subsequent analyses. CI: confidence interval.
|
Table 1
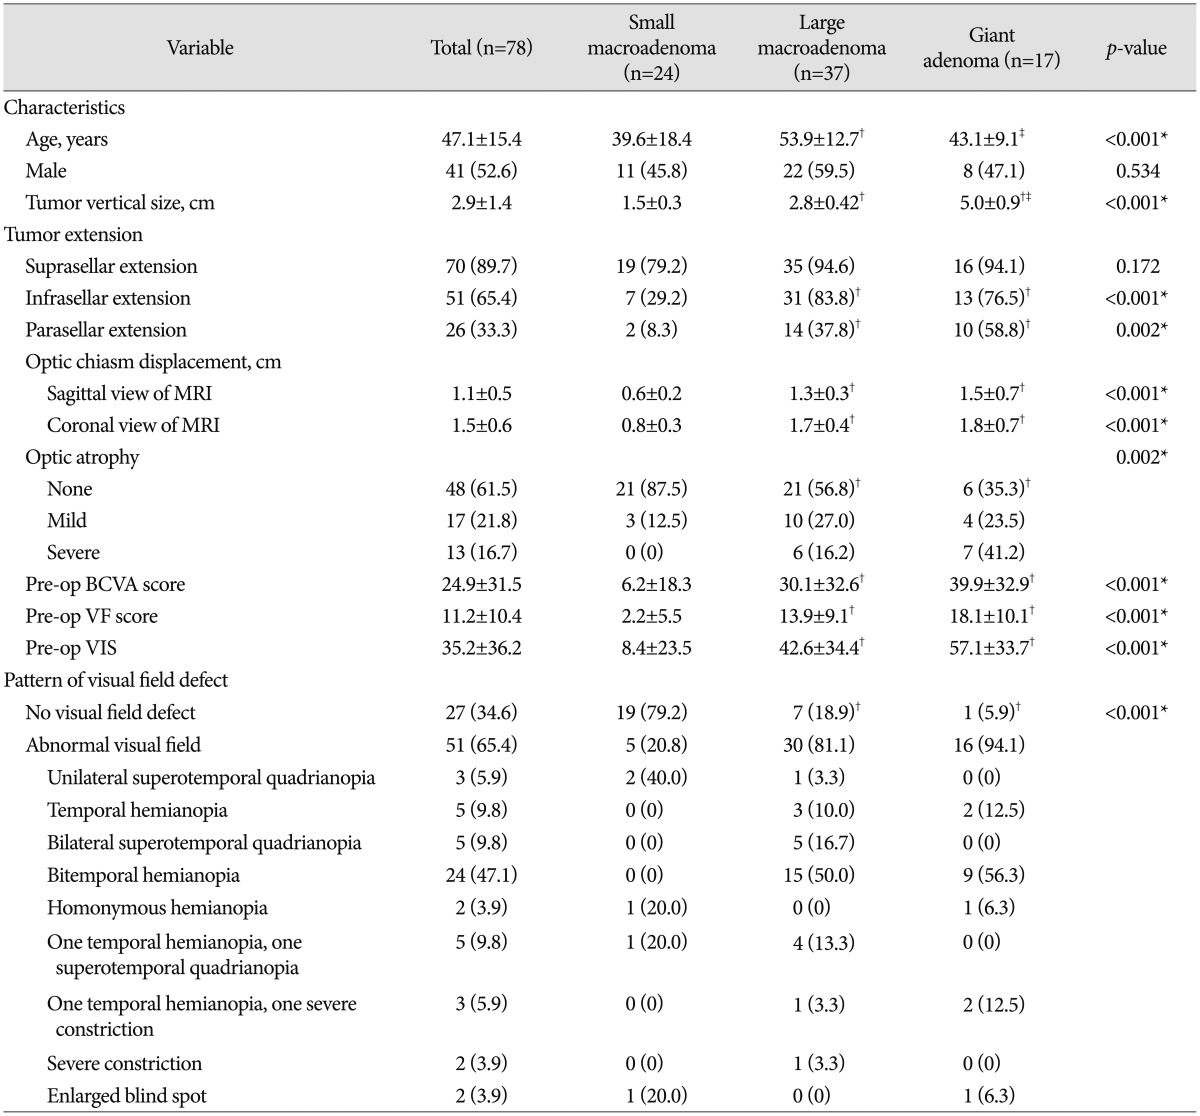
Small macroadenoma includes patients with pituitary adenoma size >1 to ≤2 cm, large macroadenoma includes adenoma size >2 to ≤4 cm, and giant adenoma includes adenoma <4 cm. Data were summarized as mean±SD for continuous variables and n (%) for categorical ones. Difference in continuous variables among pituitary adenoma types were compared using Kruskal-Wallis test and Mann-Whitney U test for pair-wise comparisons. Difference in categorical variables among pituitary adenoma sizes was compared using Fisher's exact test. *p<0.05, indicates significant difference among pituitary adenoma sizes, †‡p<0.0167 (0.05/3), indicates significant difference as compared with †small macroadenoma and ‡large macroadenoma, respectively. BCVA: best-corrected visual acuity, Pre-op: preoperative, VF: visual field, VIS: visual impairment score, SD: standard deviation
![]()
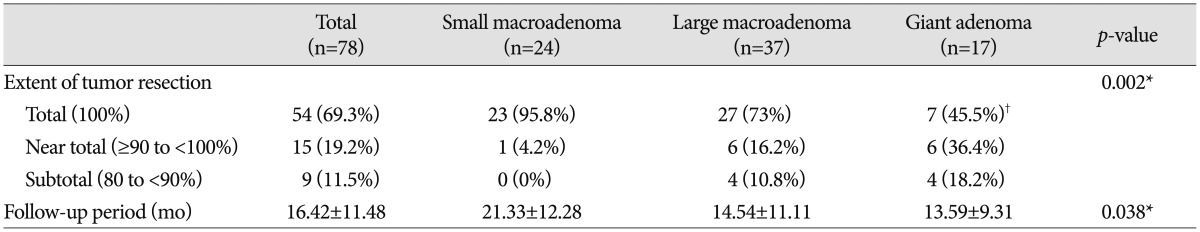
Table 3
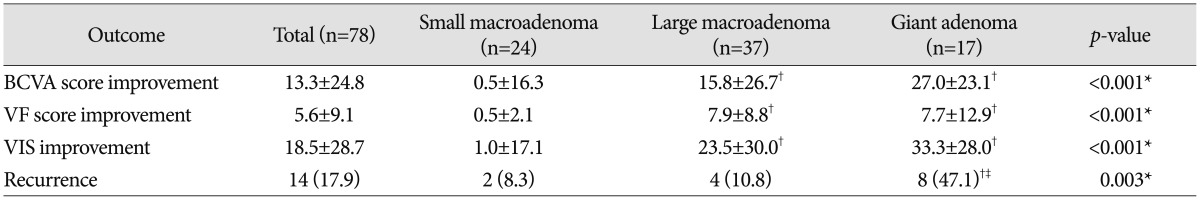
Data were summarized as mean±SD for VIS improvement and n (%) for recurrence. Difference in VIS improvement among pituitary adenoma types were compared using Kruskal-Wallis test and Mann-Whitney U test for pair-wise comparisons. Difference in recurrence rate among pituitary adenoma sizes was compared using Fisher's exact test. *p<0.05, indicates significantly different among pituitary adenoma sizes, †‡p<0.0167 (0.05/3), indicates significantly different as comparing with †small macroadenoma and ‡large macroadenoma, respectively. BCVA: best-corrected visual acuity, VF: visual field, VIS: visual impairment score, SD: standard deviation
![]()
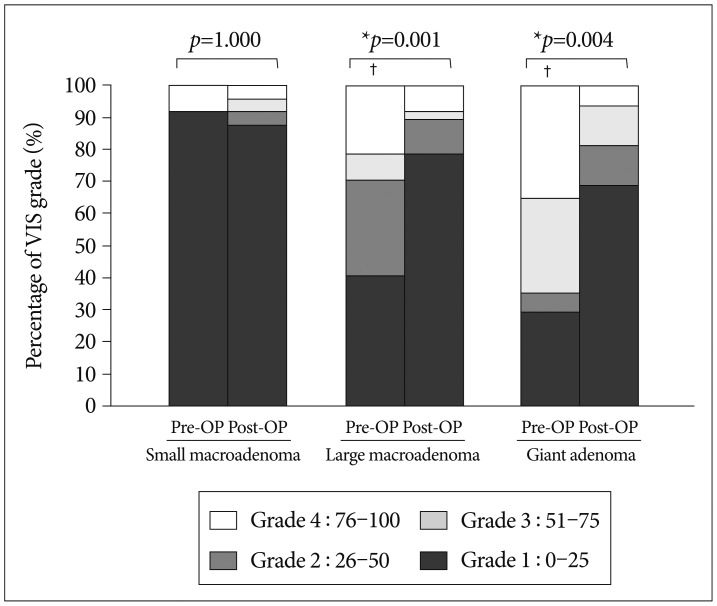 | Fig. 4Dispersion of pre-operative (Pre-OP) and post-operative (Post-OP) visual impairment score (VIS) grade by pituitary adenoma size. Data were graphed as a bar as percentage of VIS. Difference between Pre-OP and Post-OP for a given size of pituitary adenoma was compared using Wilcoxon signed ranks test. Difference for pair-wise comparison among pituitary adenoma sizes was performed using Mann-Whitney U test for Pre-OP and Post-OP, respectively. *p<0.05, indicates significant difference between Pre-OP and Post-OP. †Significant difference compared with small macroadenoma for pair-wise comparison among pituitary adenoma sizes considering an adjusted significance level of 0.0167 (0.05/3). There was no significant difference compared with large macroadenoma.
|
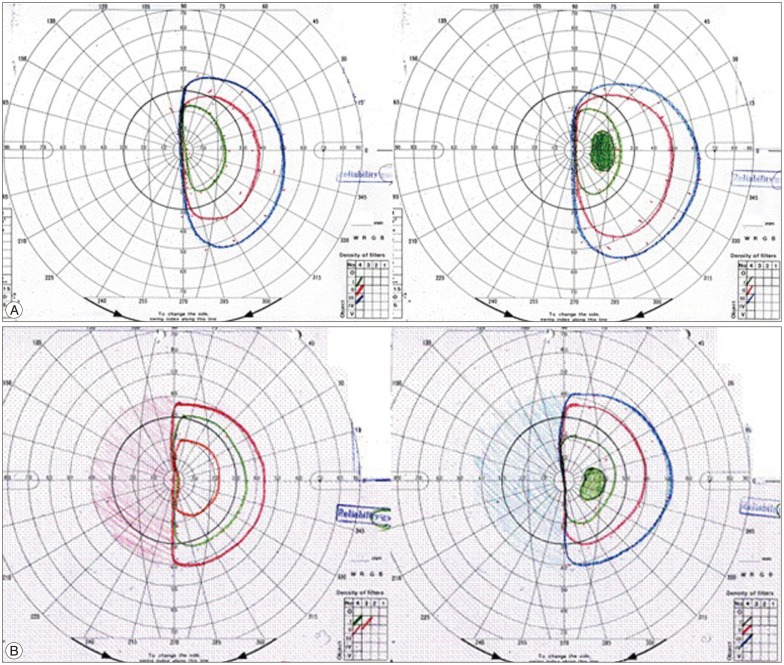 | Fig. 5Shows pre-op and post-op VF of a 43-year-old female with a tumor 7.05 cm in size. Optic disc displacement in the sagittal view was 1.45 cm and in the coronal view 1.40 cm. A: The preoperative BCVA score was 57 (right eye: 0.05, left eye: 0.32) and the pre-op VF score was 22 (left homonymous hemianopsia). Therefore the total pre-op VIS was 79. B: The post-op BCVA score was 15 (right eye: 0.2, left eye: 1.0) and the post-op VF score was 22 (left homonymous hemianopsia). Therefore, the total post-op VIS was 37. VF: visual field, BCVA: best-corrected visual acuity, VIS: visual impairment score.
|
Table 4
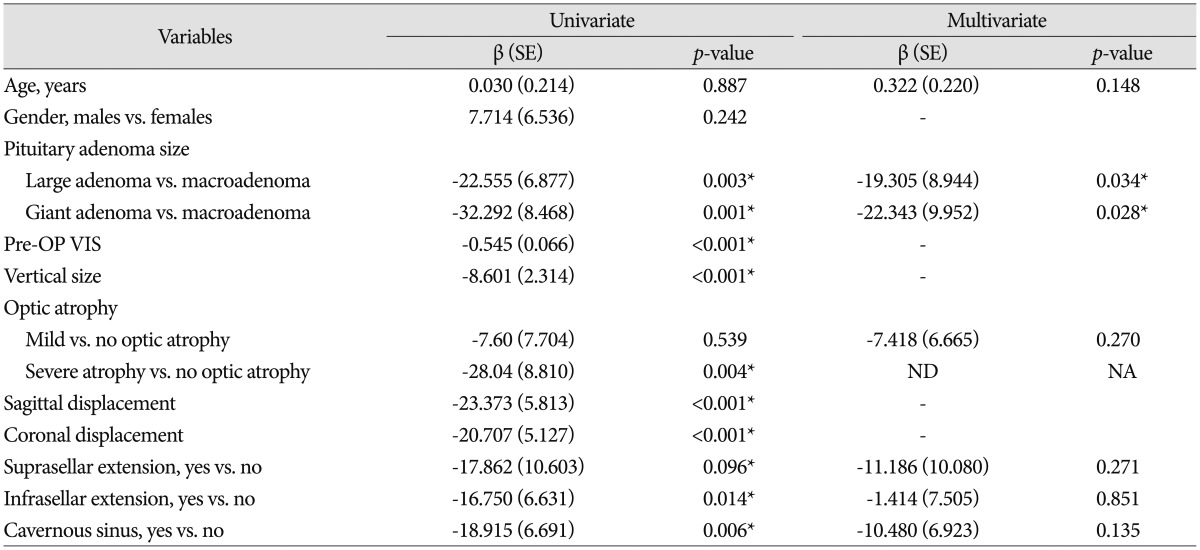
Results were represented as estimated beta (β) with corresponding standard error (SE) and p-value. Variables with significance level p<0.2 in univariate analysis were selected and put into multivariate analysis. Age was adjusted in multivariate analysis; Pre-OP VIS, vertical size, sagittal displacement, and coronal displacement were not selected into multivariate analysis due to the co-linearity. *Significant association (p<0.05). ND: not derived, NA: not assessed (please refer to Table 1; no cases were observed of patient with macroadenoma and severe atrophy)
![]()
 XML Download