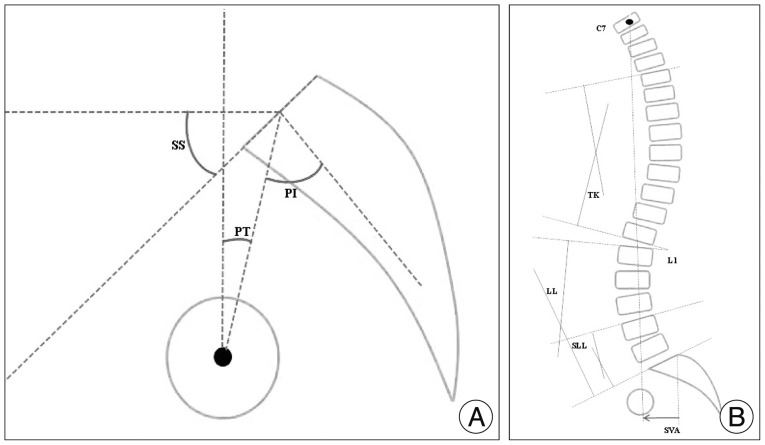
The sagittal balance of the spine is determined by the pelvic shape which is set by the PI. The PI was initially described by Duval-Beaupère et al.
5) and has been recently studied by many investigators
4,
7). It is an invariable morphologic parameter in an individual person and an important anatomic parameter that reflects the anatomic configuration of the pelvis and greatly influences the sagittal configuration of the spine
5,
12,
13). PI is strongly correlated with the SS and PT, and represents the algebraic sum of the SS and the PT : PI=SS+PT. Therefore, large-PI patients have also large PT and SS. Also, the morphology of the pelvis as quantified by PI is a strong determinant of the spatial position of the pelvis in a standing position : as the PI increases, so do SS, PT, or both. Values of spinopelvic parameters and correlations between them in the normal population have been well-established. Oh et al.
16) reported the spinopelvic parameters of Korean normal population as followings, the PI was 49°; the SS was 38°; the PT was 11°, the LL was 48°
16). Legaye et al.
13) and Vaz et al.
20) have demonstrated a correlation between PI and LL in the general population; a low PI is usually associated with a low lumbar lordosis, whereas a high PI is usually associated with a high lumbar lordosis. Also, the correlation between LL and SS has been reported in normal populations; LL increases linearly with SS. In the present study, for the precise analysis of variable parameters by individual constant PI variations, spinopelvic parameters/PI ratios were assessed, and compared between the two groups.
Degenerative spondylolisthesis vs. degenerative spinal stenosis
DSPL has traditionally been considered as a subcategory within the broader diagnosis of DSS because both patients may present with similar clinical symptoms and signs
1). However, current studies suggest that they have different demographic characteristics and radiographic findings. Epidemiologically, Rosenberg
18) reported that women were more likely to present with DSPL than men. In the present study, the proportion of women in the DSPL population was higher than that in the DSS population. In the current study, the DSPL population tended to have single-level, severe stenosis at L4-5, while the DSS population more frequently had moderate, multi-level involvement. The most common lesion of DSPL was at L4-5 (72.9%), while DSS tended to have multi-level involvement (
Table 1).
Oh et al.
16) reported that PI of normal Korean population is 49°. In present study, mean PI of DSS group was 49° and that of DSPL was 56°. Seven degrees difference between both groups seems not significantly large, but there was different statistically between groups. Also, there was a significant difference in SS between the two groups (DSPL : 33°; DSS : 29°). PT was larger in both groups (DSPL 22° and DSS 20°), but it was not significantly different between the two groups (
Table 2). Legaye et al.
13) reported that a large PI indicated a large SS and large sagittal curves. Barrey et al.
2,
3) reported that patients with DSPL demonstrated significantly greater PI (60°) than the normal population (52°). Schuller et al.
19) also reported a significant increase in PI (66° vs. 54°) and SS (42° vs. 33°) in the DSPL group than in the degenerative disc disease group. They suggested the anatomic orientation of the pelvis with a high PI and SS seems to represent a predisposing factor for DSPL. These current reports were concordant with the results of our study. Funao et al.
6) reported that global sagittal balance was well-maintained in the DSPL and non-DSPL groups, and there was no significant difference in PT (23° vs. 22°) between the DSPL and non-DSPL patients. Schuller et al.
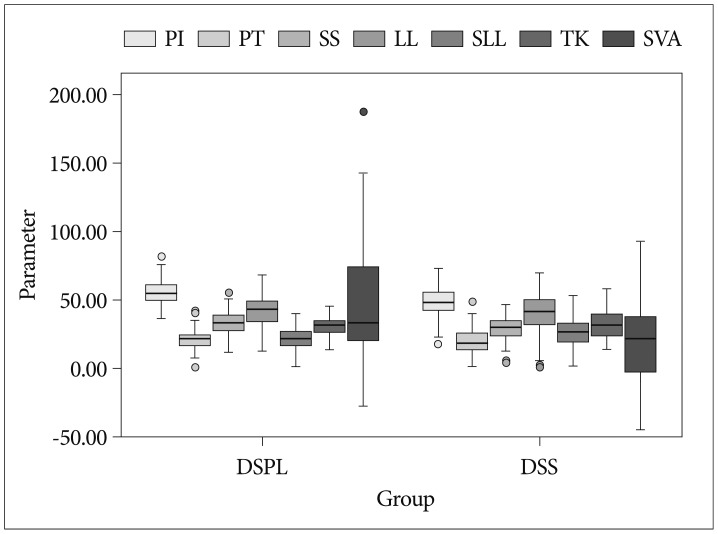
19) reported a significant increase in PT (25° vs. 21°) in the DSPL group compared to that of the reference group. In the present study, global sagittal balance was also maintained in both groups, as the mean SVA of DSPL and DSS groups was also within normal range when SVA <50 mm, but that of DSPL (48 mm) was significantly greater than that of DSS (24 mm), statistically. The proportion of those with positive SVA in the DSPL group (34%) was higher compared with that of the DSS group (12%). In analysis of parameters, the variation of SVA was large in both groups. It seems that there were many patients with parameter similar with the counter group. I presented plotted graph of parameters including SVA. According to plotted graph, all values were within 2-standard deviation in both groups (
Fig. 2) and there were statistically differences in SVA between two groups. There was no significant difference in PT (22° vs. 20°). In addition, there were significant differences in L4-S1 SLL between the two groups. The SLL of DSPL (21°) was significant less than that of DSS (27°) (
Table 2). The L4-S1 segment is a hypermobile segment, the most common segmental instability, especially DSPL and/or stenosis lesion in DSPL and DSS pathology, and comprises most of the lumbar lordosis in the lumbar spine. And, in correlation analysis for assessing correlation between spinopelvic parameters and SVA, the LL (r=-0.396;
p=0.001) and SLL (r=-0.317;
p=0.007) of DSPL and LL (r=-0.367;
p=0.002) of DSS had a weak negative correlation with SVA. The SLL (r=0.216;
p=0.068) of DSS had no correlation with SVA.
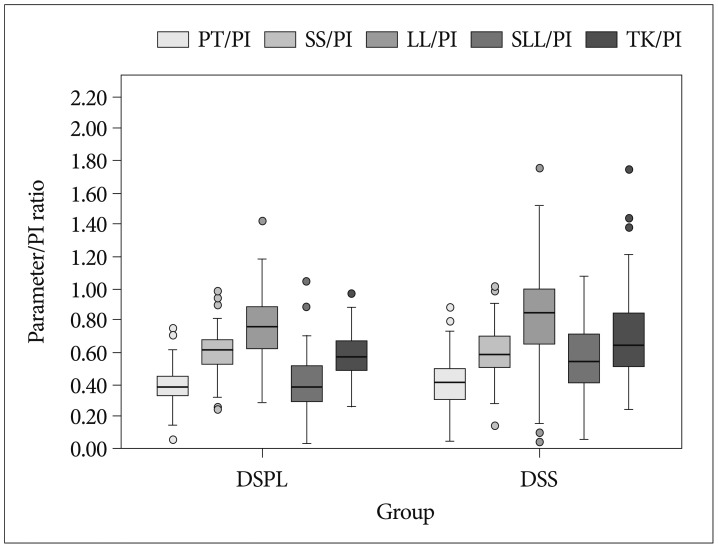
In the present study, unlike other studies, spinopelvic parameters/PI ratios were assessed (
Table 2) because while PI is a fixed constant parameter in an individual person, other variable parameters are defined by PI and thus become larger or smaller based on the PI, and plotted graph of parameters/PI ratios were also presented (
Fig. 3). In analysis of spinopelvic parameters/PI ratios between the two groups, there was a significant difference in the SLL/PI ratio (DSPL, 0.40; DSS, 0.56). In a simple comparison of parameters between the two groups, the LL of the DSPL group was larger than that of the DSS group, but the LL/PI ratio of the DSPL group was smaller than that of the DSS group in comparison of parameter/PI ratios (
Table 2). It means that the LL of DSPL is also larger than that of DSS because the PI of the DSPL group is larger than that of the DSS group, but the LL of the DSPL group considering the PI value is actually smaller than that of the DSS group. Also, it seems that loss of LL in DSPL contributed to the significant loss of SLL compared with DSS. The loss of SLL in DSPL is larger and caused by anterior slippage as well as degenerative disc space narrowing, whereas the loss of SLL in DSS is caused by degenerative disc space narrowing. According to present study, the loss of lumbar lordosis contributed to significantly loss of segmental lumbar lordosis and larger SVA may be a driving force for DSPL.
In analysis between positive and normal SVA subgroups in DSPL group, the LL and SLL of the positive SVA subgroup were significantly lower than that of the normal SVA subgroup in the DSPL group. And, the LL/PI and SLL/PI ratio of positive SVA group were also significantly lower. It seems that the significant loss of lumbar lordosis and segmental lumbar lordosis induce sagittal imbalance of DSPL. But, in analysis between positive and normal SVA subgroups in DSS group, there were significant differences in PT, LL and SLL, and all parameters/PI ratios between DSS subgroups. It means that sagittal imbalance of DSS is diffusely correlated with PT, SS, LL, and SLL (
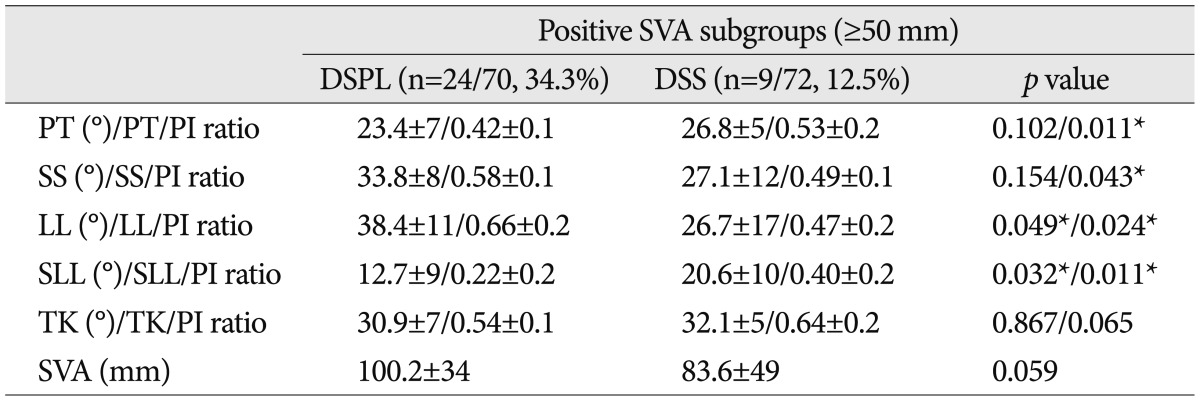
Table 3). In analysis of parameters/PI ratios between the positive SVA subgroups of each group, all values of parameters/PI ratios were significantly different; the PT/PI ratio was larger in DSS than in DSPL, the SS/PI ratio was smaller in DSS than in DSPL, the LL/PI ratio was larger in DSPL than in DSS, and the SLL/PI ratio was smaller in DSPL than in DSS (
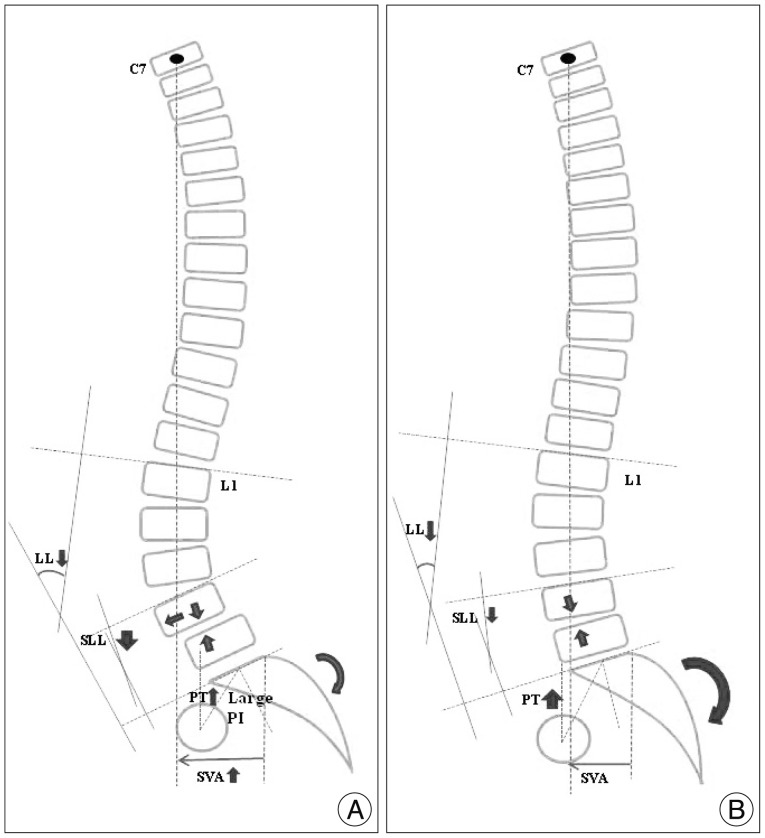
Table 4). It seems that the sagittal imbalance of DSPL is caused by the loss of LL (LL/PI ratio, 0.66) and significant loss of SLL (SLL/PI ratio, 0.22), and mild pelvic retroversion (PT/PI ratio, 0.40) acted as a compensatory mechanism. However, sagittal imbalance of the DSS population is caused by overall loss of LL, and significant pelvic retroversion (PT/PI ratio, 0.53) operated as a compensation mechanism. The mean SVA of the positive SVA DSPL subgroup (100 mm) was larger than that of the positive DSS subgroup (83 mm) despite the relatively large LL and LL/PI ratios in the DSPL subgroup. It may be caused by a significant loss of lower lumbar (SLL) and anterior slippage in DSPL, and less generation of compensatory mechanisms (
Fig. 4).
Limitations of the present study include the lack of an age- and sex-matched analysis, a small sample size, and the retrospective nature of the study. Nonetheless, the results of this study are meaningful because the differences in sagittal spinopelvic alignments between DSPL and DSS were investigated. These results will be helpful and must be considered in the surgical treatment of DSPL and DSS. However, we recognize that a prospective, larger and longitudinal study is necessary to clearly establish the spinopelvic alignments of DSPL and DSS.



 PDF
PDF ePub
ePub Citation
 Print
Print


 XML Download