

 PDF
PDF ePub
ePub Citation
 Print
Print


INTRODUCTION
MATERIALS AND METHODS
Study design and patients
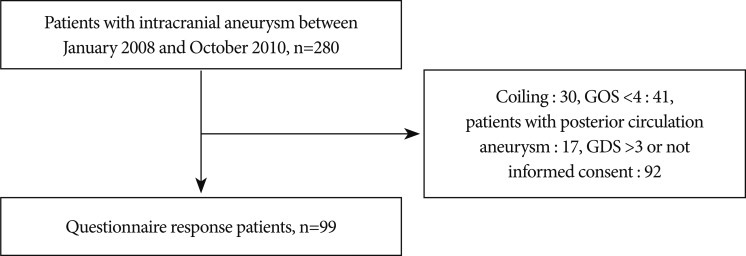 | Fig. 1Schematic diagram of the screening of patients surgically treated with anterior circulation aneurysms and who completed WHOQOL questionnaire. WHOQOL : World Health Organization Quality of Life, GOS : Glasgow Outcome Scale, GDS : global deterioration scale.
|
Table 2
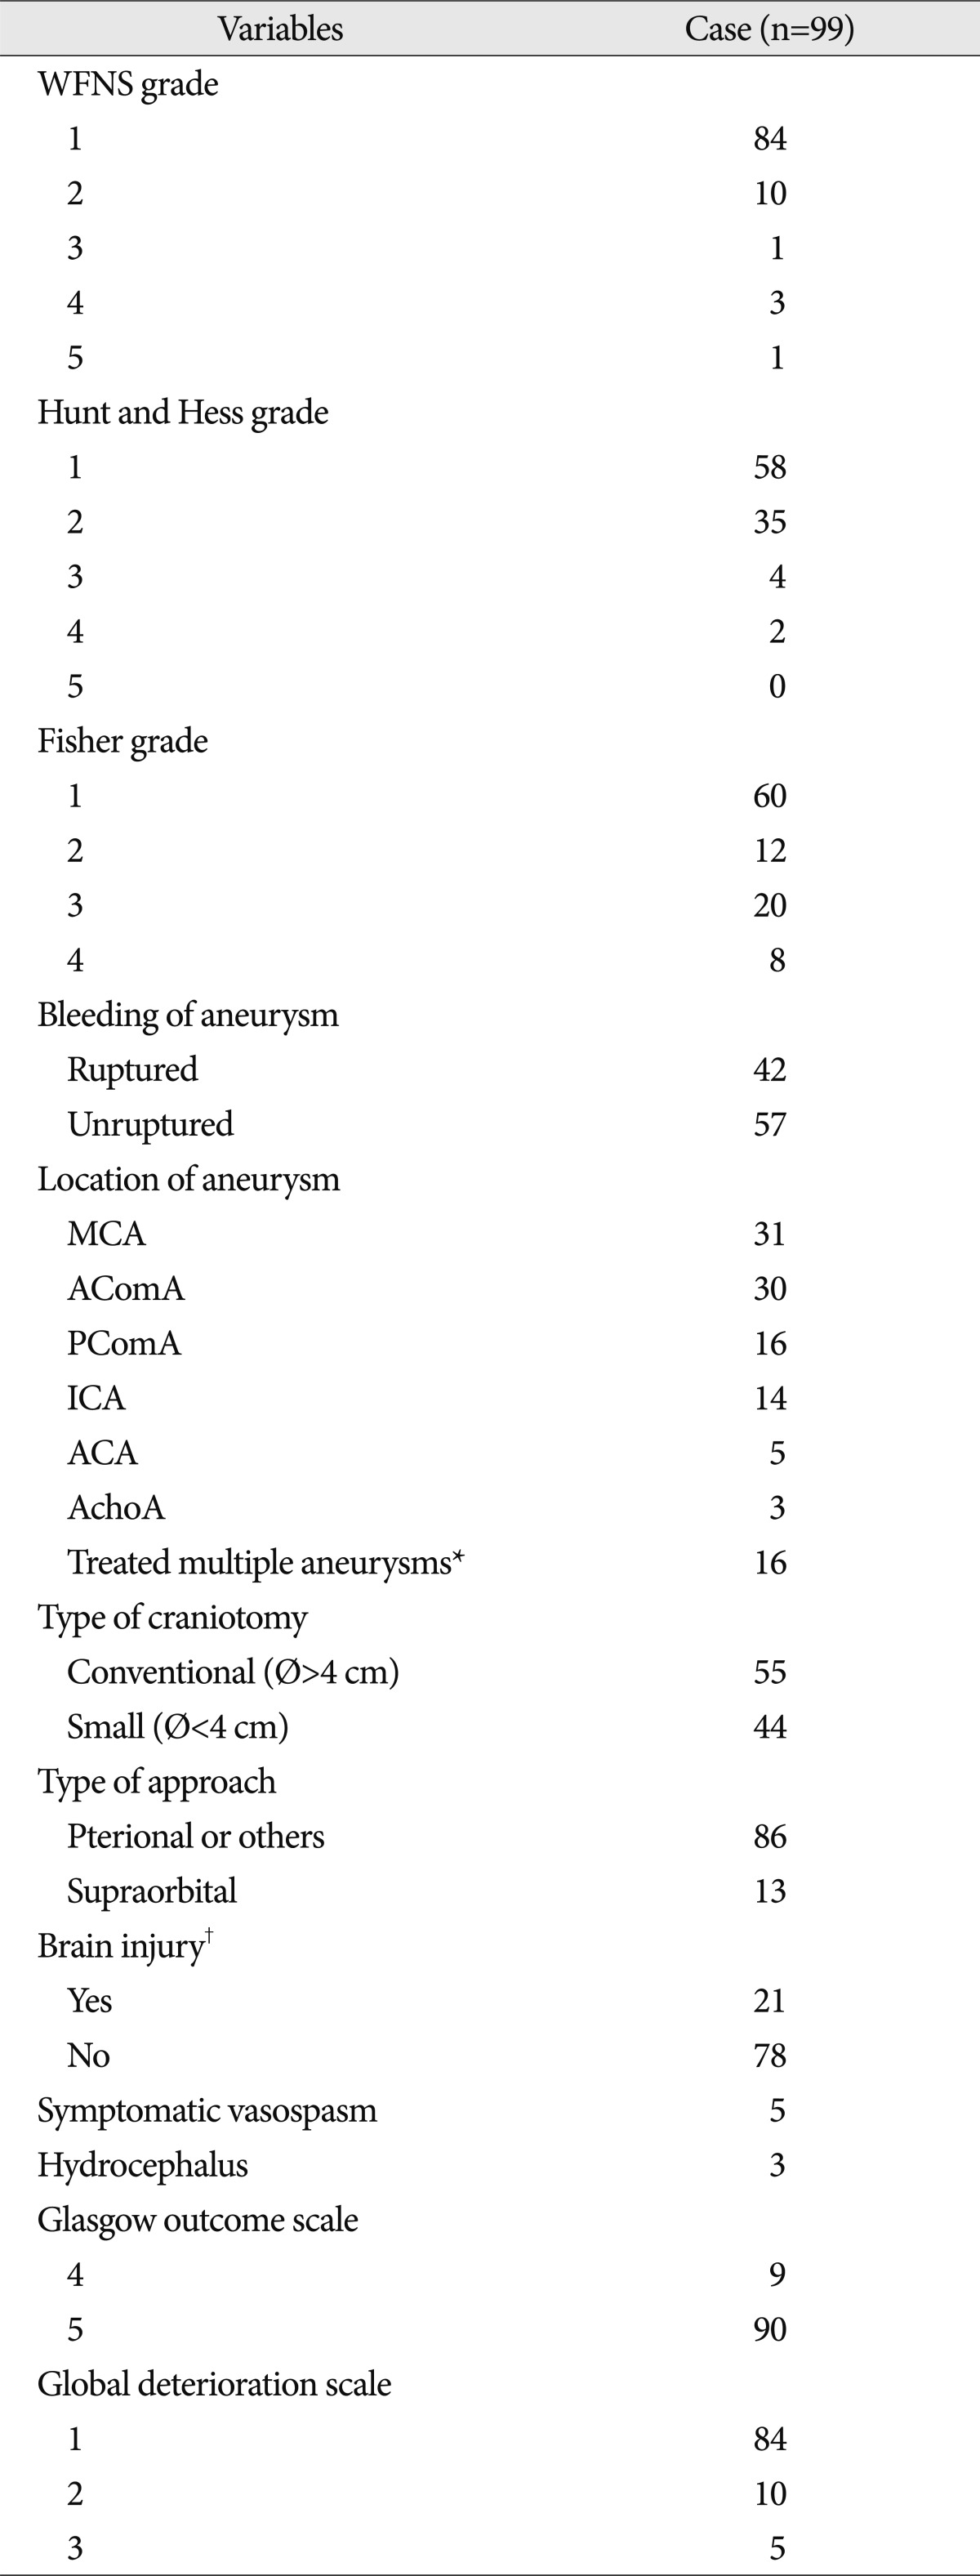
*Multiple aneurysms were identified and were all clipped successfully, †Brain injury was defined as a low density of more than 1 cm according to the immediate postoperative brain CT scan. MCA : middle cerebral artery, AComA : anterior communicating artery, PComA : posterior communicating artery, ICA : internal cerebral artery, ACA : anterior cerebral artery, AchoA : anterior chroidal artery
![]()
Surgical methods and outcome evaluation
Instruments and calculation of scores
Statistical analysis
RESULTS
General characteristics
Reliability and validity of the WHOQOL Korean version
Table 3

*Except for these facets, all of the facets showed good internal consistency, †All of the Pearson correlation coefficient values were significant at p<0.0001. WHOQOL : World Health Organization Quality of Life, QOL : quality of life, PHY : physical, PSY : psychological, IND : level of independence, SOC : social, ENV : environmental, SPI : spiritual domain
![]()
Comparison of QOL values in the case and control groups
Table 4
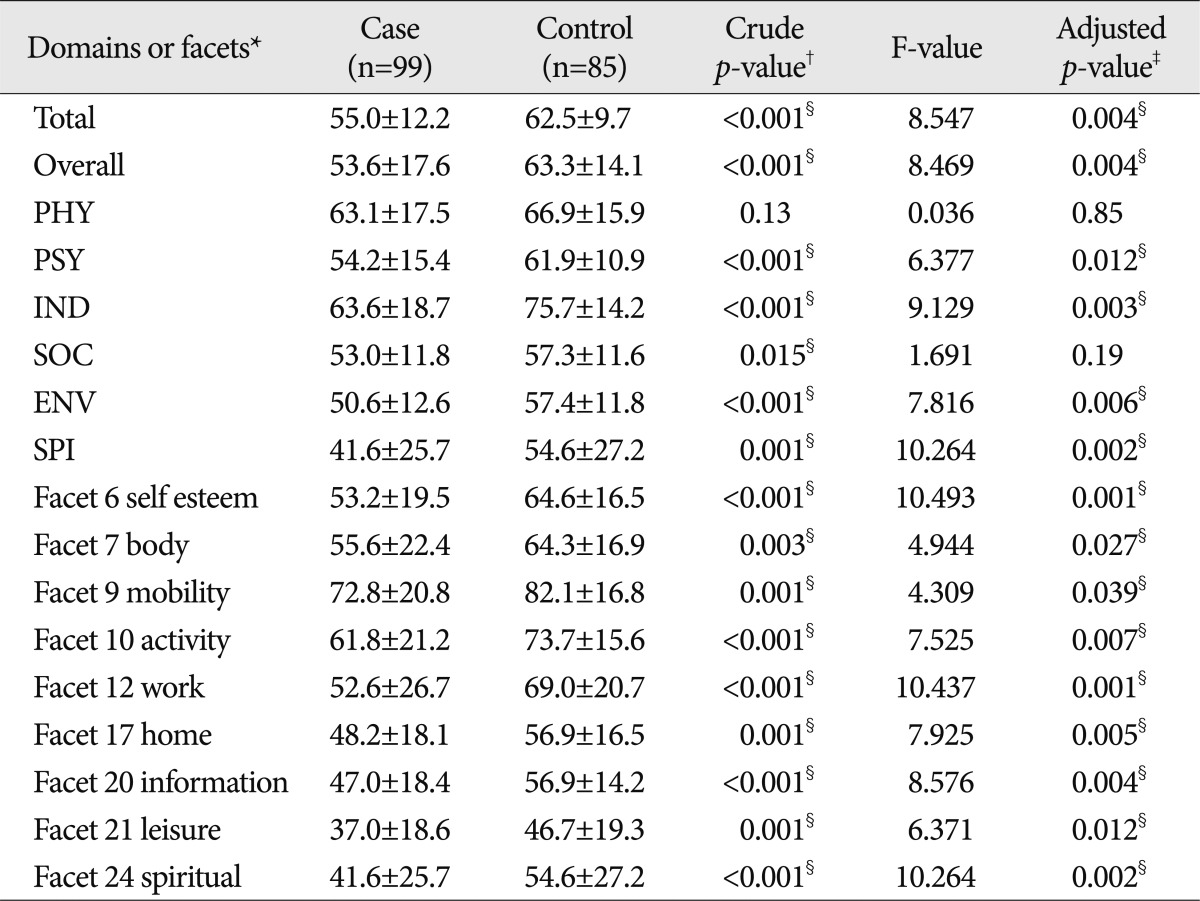
*The facets that were not shown here were not significantly different between the two groups, †t-test was used. ‡Multivariate analysis was used, §There was a statistical significance between the two groups. WHOQOL : World Health Organization Quality of Life, PHY : physical, PSY : psychological, IND : level of independence, SOC : social, ENV : environmental, SPI : spiritual domain
![]()
Subgroup analysis of the QOL values and hospital expenses in the case group
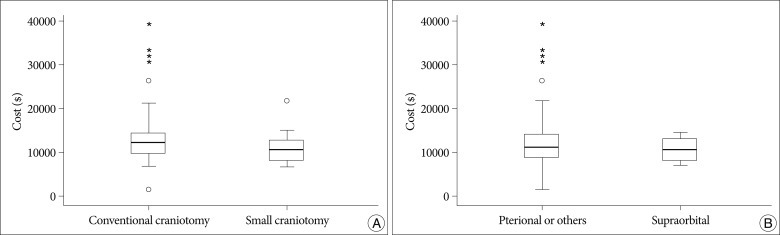 | Fig. 3Comparison of hospital charges between the type of craniotomy and approach. There is a significant difference between conventional and small craniotomy (p=0.006, A). On the contrary, there was no difference between the supraorbital and pterional approaches (p=0.25, B).
|
Table 5
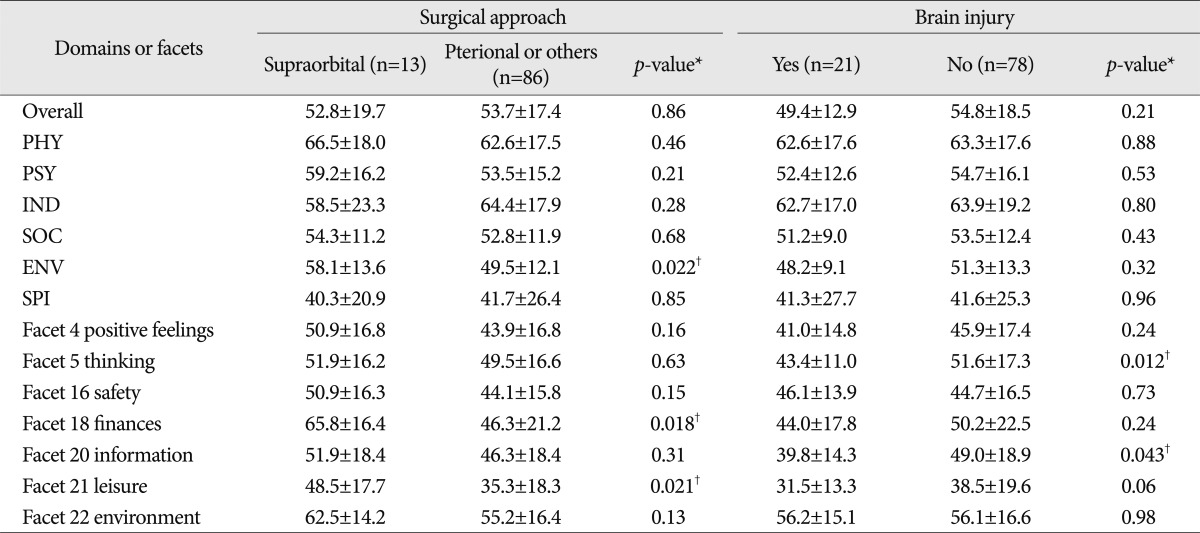
The facets that were not shown here were not significantly different between the two groups. *p-value was calculated with t-test, †There was a statistical significance between the two groups. QOL : quality of life, PHY : physical, PSY : psychological, IND : level of independence, SOC : social, ENV : environmental, SPI : spiritual domain
![]()
Table 6

The facets that were not shown here were not significantly different between the two groups. *p-value was calculated with t-test, †There was a statistical significance between the two groups. QOL : quality of life, PHY : physical, PSY : psychological, IND : level of independence, SOC : social, ENV : environmental, SPI : spiritual domain
![]()
 XML Download