Journal List > J Korean Neurosurg Soc > v.64(5) > 1160992

Kim, Park, Lee, Kwon, Song, and Chang: Propranolol Inhibits the Proliferation of Human Glioblastoma Cell Lines through Notch1 and Hes1 Signaling System

Abstract

Objective

The anti-tumor effect of the beta-adrenergic receptor antagonist propranolol in breast cancer is well known; however, its activity in glioblastoma is not well-evaluated. The Notch-Hes pathway is known to regulate cell differentiation, proliferation, and apoptosis. We investigated the effect of propranolol to human glioblastoma cell lines, and the role of Notch and Hes signaling in this process.

Methods

We performed immunohistochemical staining on 31 surgically resected primary human glioblastoma tissues. We also used glioblastoma cell lines of U87-MG, LN229, and neuroblastoma cell line of SH-SY5Y in this study. The effect of propranolol and isoproterenol on cell proliferation was evaluated using the MTT assay (absorbance 570 nm). The impact of propranolol on gene expression (Notch and Hes) was evaluated using real-time polymerase chain reaction (RT-PCR, whereas protein levels of Notch1 and Hes1 were measured using Western blotting (WB), simultaneously. Small interfering RNA (siRNA) was used to suppress the Notch gene to investigate its role in the proliferation of glioblastoma.

Results

Propranolol and isoproterenol caused a dose-dependent decrease in cell proliferation (MTT assay). RT-PCR showed an increase in Notch1 and Hes1 expression by propranolol, whereas WB demonstrated increase in Notch1 protein, but a decrease in Hes1 by propranolol. The proliferation of U87-MG and LN229 was not significantly suppressed after transfection with Notch siRNA.

Conclusion

These results demonstrated that propranolol suppressed the proliferation of glioblastoma cell lines and neuroblastoma cell line, and Hes1 was more closely involved than Notch1 was in glioblastoma proliferation.

INTRODUCTION

Gliomas include neoplasm that originate from glial cells of the central nervous system (CNS). According to the World Health Organization Classification of Tumors of the CNS (CNS WHO) [25], glioblastoma is the most common malignant neoplasm, with over 10000 new diagnoses made every year in the USA [2,31], being the most advanced and malignant grade IV glioma subtype. The current standard treatment for glioma is maximal surgical resection plus concurrent chemoradiation therapy followed by adjuvant chemotherapy, called Stupp regimen [40]. Despite aggressive multimodal treatment, the reported overall survival period is less than 15 months after diagnosis [19]. Significant efforts are required to understand the molecular mechanism of glioblastoma, which led to modification of the CNS WHO in 2016 [26,27], grading gliomas according to their pathological evaluation based on molecular features.
Notch signaling pathway plays an important role in cell differentiation and proliferation [6]. Notch exists on the cell surface as a heterodimer; its extracellular domain is tethered to the transmembrane and intracellular domain by noncovalent, calcium-dependent interactions [18]. Ligand binding activates Notch signaling and induces conformational change in the Notch receptor, leading to serial signal transductions. Four types of Notch receptors (Notch1, Notch2, Notch3, and Notch4) and five classic ligands (Delta-like1, Delta-like3, Delta-like4, Jagged1, and Jagged2) exist in mammals [3]. Notch pathway is dysregulated in brain tumors and many other tumors, including lung cancer, pancreatic cancer, breast cancer, cervical cancer, hematologic malignancies, and ovarian cancer [4,7,21,29,33]. Notch expression differs between tumors, and these differences are not fully understood. Notch1 is known to be oncogenic and is associated with glioma progression [22,41]. However, its role as a tumor suppression is also reported [8,36]. The Notch system interacts with the Hes1 protein [12]. Hes1 is a transcription factor encoded by the Hes1 gene which suppresses transcription. Notch signaling activates Hes1 expression, and Hes1 influences stem and progenitor cell maintenance in the nervous and digestive systems.
Propranolol is nonselective beta blocker that acts on both β1 and β2 receptors. Beta-adrenergic antagonists have tumor-suppressive effects on various cancers [1]. Nonselective beta adrenergic antagonists are effective at reducing breast cancer proliferative rates [37]. However, little is known about their effects on glioblastoma.
We investigated the effect of different propranolol concentration on the proliferation of glioblastoma cell lines and on the expression of Notch1 and Hes1.

MATERIALS AND METHODS

This study was approved by the Hallym University Institutional Review Board (2019-03-007-001).

Tissue samples

Two commercially available human glioblastoma cell lines (U87-MG and LN229) and one neuroblastoma cell line (SH-SY5Y) were de-identified and used in this study. Surgically resected, fixed a paraffin-embedded human glioblastoma tissues were obtained from our hospital.

Immunohistochemical staining

Paraffin-embedded tissue sections of 31 primary human glioblastomas were used, and each tissue section was resected into six pieces (a total of 186 fields were evaluated). Immunostaining with rabbit polyclonal anti-Notch1 antibodies (ab27526; Abcam, Cambridge, UK) was performed at 1 : 50 dilution. The antibody was diluted in phosphate-buffered saline with 5% normal blocking serum. Biotinylated rabbit immunoglobulin G antibody (PK-6101; Vector Laboratories, Burlingame, CA, USA) was selected as the secondary antibody. Streptavidin-biotin-peroxidase complex was used to detect antibody-antigen reactions. Color development was performed with 3,3’-diaminobenzidine (SK-4100; Vector Laboratories) for one minute. Slides were counterstained with hematoxylin (H-3401; Vector Laboratories) and observed under the microscope. Normal brain tissues were used as negative controls. Notch1 signal was quantified by scoring 10 different tumor fields to determine the mean percentage of tumor cells with positive staining. The staining was divided as positive and negative for the qualitative verification of immunohistochemical staining.
For quantitative assessment, the staining was scored as follows : 1) negative, less than 10% area of positive cells; 2) weak positive, 10% to 20% area of positive cells; 3) moderate positive, 20% to 50% area of positive cells; and 4) strong positive, more than 50% area of positive cells. We did not calculate the percentage of positive cells but estimated the ratio in areas of the cancer cells.

Cell culture and cell proliferation assay

The glioblastoma (U87-MG and LN229) and neuroblastoma (SH-SY5Y) cell lines were cultured in minimum essential medium containing 10% fetal bovine serum, an antibiotic combination (100 unit/mL penicillin and 0.1 mg/mL streptomycin; Gibco, Grand Island, NY, USA), and L-glutamine (2 mM). The cells were incubated at 37°C in an incubator containing 5% CO2. Cells were placed in a 96-well culture plate at a density of 1×10⁴ cells/well in 200 µL culture media. After 24 hours incubation at 37°C, cells were treated for 48 hours with propranolol, isoproterenol and Notch1 small interfering RNA (siRNA) (HSS107248; Invitrogen, Carlsbad, CA, USA). The culture medium was thereafter replaced with 200 µL culture medium containing 0.5 mg/mL 3-(4,5-dimethylthiazol-2-yl)-2,5-diphenyltetrazolium bromide (MTT) (M5655; Sigma-Aldrich, St. Louis, MO, USA). After incubation for 2 hours, the supernatant was removed and 200 µL dimethyl sulfoxide was added and the plates were incubated at 37°C for 30 minutes to dissolve the formazan precipitate, following which absorbance was measured at 570 nm using an automated microplate reader (Multiskan GO; Thermo Fisher Scientific, Vantaa, Finland). All experiments were repeated at least seven times.

Western blotting (WB) of Notch1 and Hes1

The cell lines were dissolved in radioimmunoprecipitation assay (RIPA) buffer (150 mM NaCl, 1.0% Nonidet P-40, 0.5% sodium desoxycholate, 0.1% sodium dodecyl sulfate, 0.5 mM Tris, pH 8.0) on ice for 30 minutes and lysed for 30 minutes, followed by centrifugation for 20 minutes at 4°C. Protein quantification was performed using the Bradford assay (Bio-Rad, Glattbrugg, Switzerland). For all WBs, 50 µg total cellular protein was resolved per lane on a 7% Tris-acetate gel (Invitrogen) for Notch1 detection and transferred to nitrocellulose membranes (Schleicher and Schuell, Kassel, Germany). The transfer efficiency and loading accuracy was visually checked by Ponceau-S staining. Membranes were blocked overnight at 4°C with 5% weight/volume (w/v) nonfat dry milk/Tris-buffered saline and Tween-20 (0.05% w/v) and were treated thereafter with rabbit polyclonal anti-Notch1 antibodies (H-131; Santa Cruz Biotechnology, Inc., Santa Cruz, CA, USA) for the detection of the extracellular domain of Notch1. All procedures were repeated more than three times. The densities of the bands were quantified using the ImageJ (1.47v; NIH, Bethesda, MD, USA), and the values were statistically analyzed.

Real-time polymerase chain reaction (RT-PCR)

Total RNA was isolated using TRIzol reagent (Invitrogen) and converted to cDNA using amfiRivert cDNA synthesis Platinum Master Mix (R5600; GenDEPOT, Barker, TX, USA) according to the manufacturer’s instructions. The primers (mentioned below) were used to amplify cDNA (PCR), and the products were separated on a 1% agarose gel containing ethidium bromide. All procedures were repeated more than five times. The band densities on the gel were quantified by the ImageJ. The density values were analyzed statistically. The following primers were used : 1) the Notch1 primer; sense : 5’-AGATCAACCTGGATGACTGTGCCA-3’, antisense : 5’-ACACGTAGCCACTGGTCATGTCTT-3’; 2) the Hes1 primer; sense : 5’-AGATCAACCTGGATGACTGTGCCA-3’, antisense : 5’-ACACGTAGCCACTGGTCATGTCTT-3’; 3) the β-actin primer; sense : 5’-GCACCACACCTTCTACAATA-3’, antisense : 5’-TGCTTGCTGATCCACATCTG-3’.

Statistical analysis

Statistical package for the Social Science software version 26 (SPSS Inc., Chicago, IL, USA) was used for statistical analysis. Cell proliferation and Notch1 and Hes1 expression were analyzed by paired t-test and cross-tabulation. p-value <0.05 was considered statistically significant.

RESULTS

Notch1 expression in primary human glioblastoma

Immunohistochemical staining was performed using the streptavidin-biotin-peroxidase complex technique to investigate Notch1 expression level in glioblastoma (Fig. 1). Among 186 fields of glioblastoma tissues, Notch1 staining was negative in 27 fields, weak positive in 34 fields, moderate positive in 41 fields, and strong positive in 84 fields; demonstrating strong immunoreactivity in glioblastoma.

Propranolol and cell lines proliferation

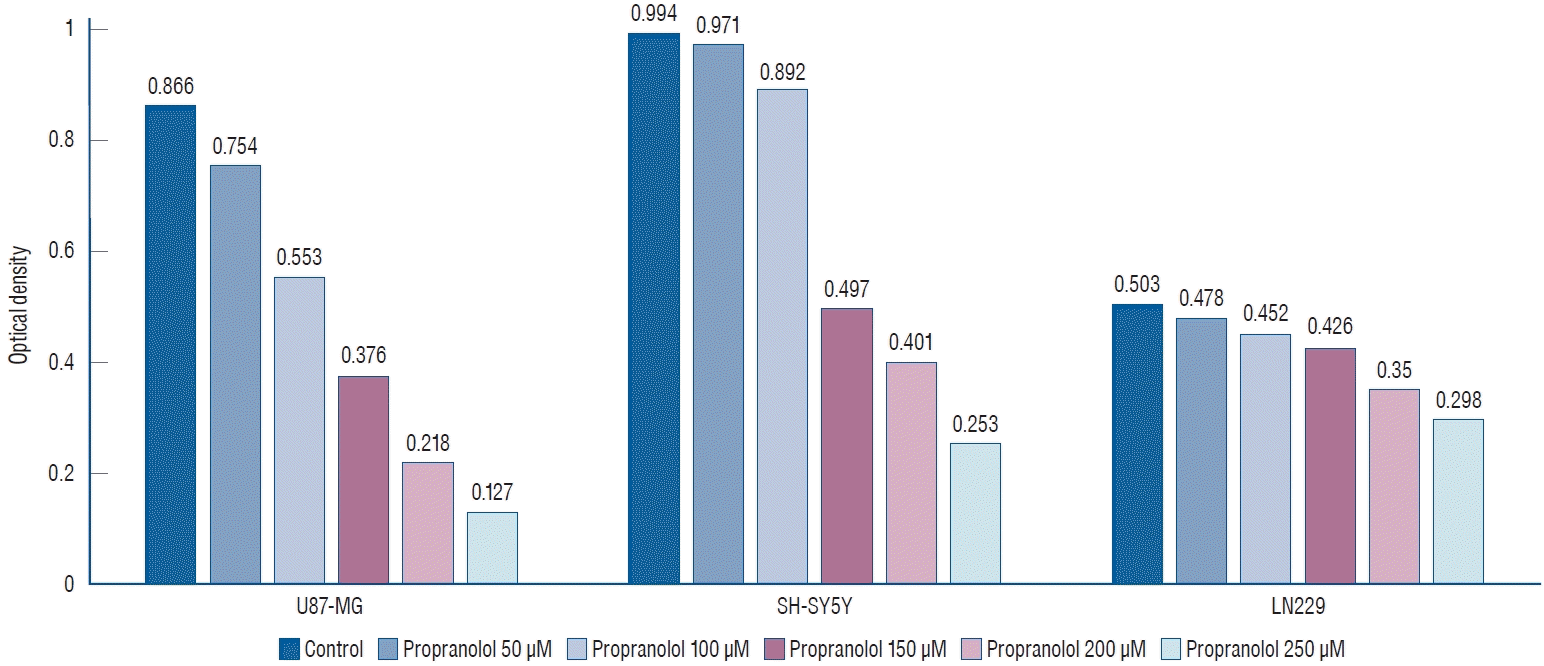
We investigated the effect of propranolol and isoproterenol on U87-MG, LN229, and SH-SY5Y cell lines. After treatment of cell lines with 50, 100, 150, 200, and 250 µM propranolol, cell proliferation was measured by MTT assay (Fig. 2). A dosedependent decreases in optical density (OD) values were observed in U87-MG cells treated with propranolol, 0.754±0.075, 0.553±0.064, 0.376±0.053, 0.218±0.031, and 0.127±0.017, respectively, when compared to untreated controls (0.866±0.057).
Similarly, mean OD values for propranolol-treated SH-SY5Y cells declined to 0.971±0.089, 0.892±0.077, 0.497±0.052, 0.401±0.033, and 0.253±0.023, respectively, when compared to untreated controls (0.994±0.071). The mean OD values showed a dose-dependent decrease after propranolol treatment of LN229 cells to 0.478±0.054, 0.452±0.042, 0.426±0.027, 0.350±0.031, and 0.298±0.019, respectively, compared to untreated controls (0.503±0.037).
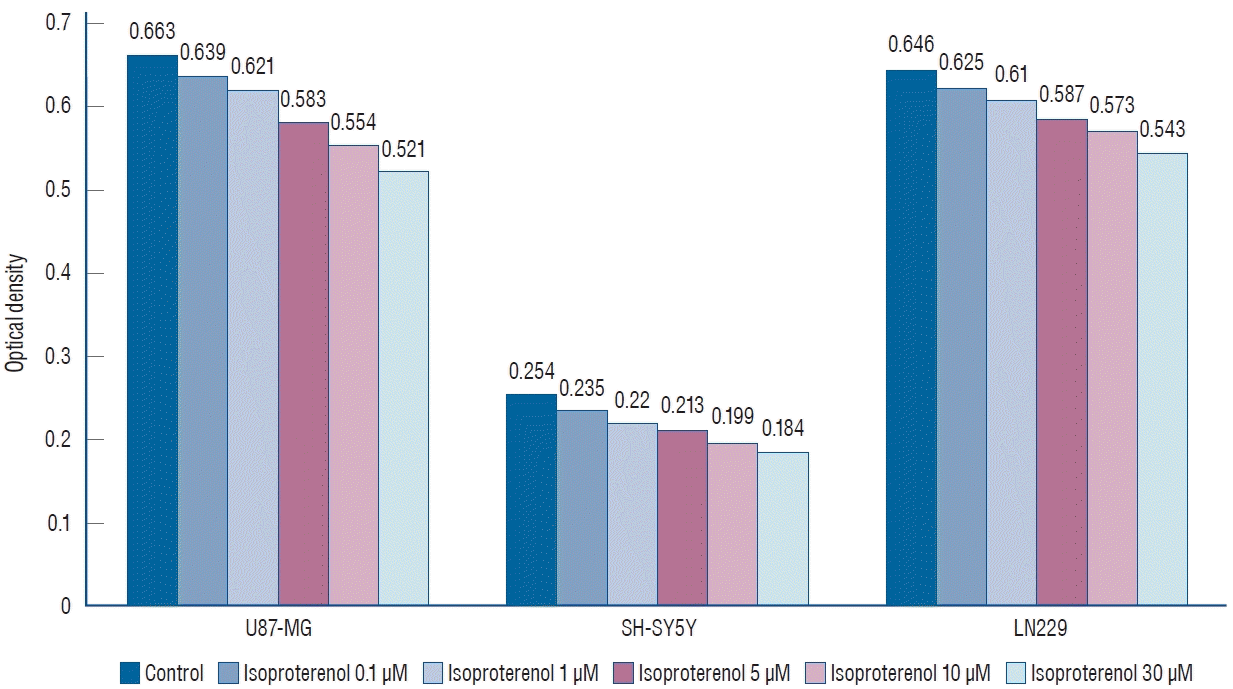
In the case of isoproterenol treatment (0.1, 1, 5, 10, and 30 µM), the mean OD values of U87-MG cells declined to 0.639±0.057, 0.621±0.052, 0.583±0.048, 0.554±0.037, and 0.521±0.020, respectively, compared to untreated controls (0.663±0.054, Fig. 3). Similarly, the mean OD values showed a dose-dependent decline to 0.235±0.021, 0.220±0.019, 0.213±0.018, 0.199±0.012, and 0.184±0.013, respectively, in SH-SY5Y cells, compared to untreated controls (0.254±0.017). The mean OD values of LN229 cells also showed a dose-dependent decline to 0.625±0.061, 0.610±0.058, 0.587±0.032, 0.573±0.041, and 0.543±0.037, respectively, compared to untreated controls (0.646±0.039).
These results demonstrated that propranolol and isoproterenol suppressed U87-MG, SH-SY5Y, and LN229 cell lines in a dose-dependent manner (p=0.013).

Propranolol and Notch1/Hes1 expression

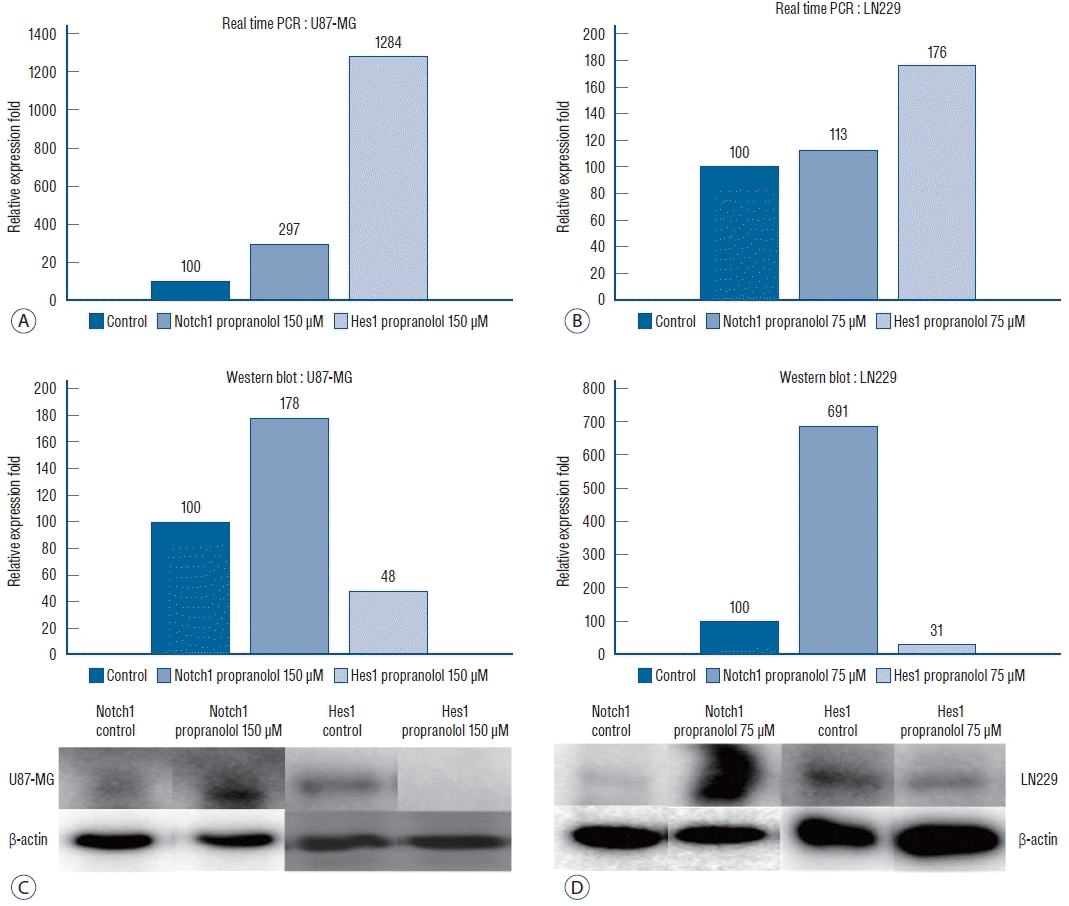
After observing that propranolol suppressed proliferation of all the cell lines, Notch1 and Hes1 expression was evaluated in U87-MG and LN229 cell lines by RT-PCR and WB analysis to evaluate the effect of propranolol on Notch1 and Hes1 signaling (Fig. 4). In controls (0 µM propranolol), the mean densities of Notch1 and Hes1 were 100 in both cell lines. U87-MG cells were treated with 150 µM propranolol, and LN229 cells were treated with 75 µM propranolol. The mean density of Notch1 in RT-PCR was 296±36 in U87-MG and 113±27 in LN229, whereas the mean of Hes1 was 1284±137 in U87-MG and 176±23 in LN229 cells.
The mean density of Notch1 in the WB analysis was 178±21 in U87-MG and 691±72 in LN229 cells, whereas the mean density of Hes1 was 48.35±6.73 in U87-MG and 31.33±5.54 in LN229 cells.
These results demonstrated that propranolol increased Notch1 and Hes1 gene expression (p=0.035) but suppressed Hes1 expression at the translational or post-translational modification step (p=0.021).

Notch1 gene suppression by siRNA and cell lines proliferation

To verify the effects of propranolol on cell line proliferation, siRNA targeting Notch1 was used. The efficacy of siRNA for reducing the target was quantified using quantitative PCR (Fig. 5). The mean valus was 0.650 in the untreated cells (lipofectamine-only), and 0.154 in 150 µM propranolol-treated cells. In negative controls with Notch1 siRNA, the mean value was 0.619 in control cell, and 0.149 in 150 µM propranolol-treated cells. After transfection with Notch1 siRNA, the mean value reduced to 0.622 in control and 0.099 in 150 µM propranolol-treated cells. In lipofectamine-only, the mean value was 1.236 in the control group and 0.847 in 75 µM propranolol. In the negative control with Notch1 siRNA, the mean value was 0.861 in control and 0.637 in 75 µM propranolol. After transfection with Notch1 siRNA, the mean value was 0.857 in the control and 0.440 in 75 µM propranolol. These results demonstrated that there were no statistically significant differences between lipofentamine with negative control siRNA and lipofectamine with active siRNA groups in the control of both cell lines (p=0.157).

DISCUSSION

Rundle-Thiele et al. [38] reviewed articles about some older drugs which have potential anticancer activity. Some studies have suggested that beta-blockers might inhibit angiogenesis, cellular proliferation, and invasion, as well as increasing apoptosis in several cancer cell lines [34,35,42]. Another study investigated the usage of propranolol in several cell lines including breast cancer, neuroblastoma, and glioblastoma cell lines [34]. He et al. [13] reported that isoproterenol, an agonist of beta-adrenergic receptors, stimulated the proliferation of U251 glioblastoma cells, but not U87-MG cells. This effect was prevented by the beta-adrenergic receptor antagonist propranolol. According to their study, isoproterenol had different effects on different glioblastoma cell lines, and it could not be said that isoproterenol stimulates all types of glioblastomas. In our study, both propranolol and isoproterenol suppressed glioblastoma and neuroblastoma cell lines. Although many studies have been conducted, the exact mechanism by which betablockers inhibit angiogenesis and promote apoptosis is not yet fully understood.
One study reported that propranolol downregulated primary tumor expression of mesenchymal genes [14]. They showed that downregulation of Snail/Slug, NF-kB/Rel, and AP-1 transcription factors and patients with clinical drug response demonstrated elevated tumor infiltration of CD68+ macrophages and CD8+ T cells. Haihong et al reported that proliferating infantile hemangiomas contained higher levels of protein of Notch receptors and ligands as well as downstream coactivator MAML1 [43]. Expression of Notch1 receptor ligands protein and downstream gene of Notch activation MYC was significantly lower in propranolol-treated infantile hemangiomas compared with untreated tumors in their study. In our study, we showed that propranolol suppresses tumor cell proliferation and Hes1 expression. However, we did not show the molecular targets of propranolol controlling Notch1 and Hes1 expression. Further study about transcription factors or downstream regulator of Notch1 and Hes1 should be done to clear the elusive mechanism of propranolol.
As mentioned above, Notch signaling is involved in cell differentiation, proliferation, migration, self-renewal and apoptosis [5]. It plays a key role in promoting neural stem cell differentiation into glial cells [23]. Contrastingly, it is related to various cancers, including breast cancer, cervical cancer, lymphomas, pancreatic cancer, renal cell cancer, skin tumor, and lung cancer [21]. Some studies report Notch1 acts as oncogene [15,16,24], while others report it as a tumor suppressor [30,39].
Protein and mRNA levels of Notch1 and Hes1 are higher in brain tumor cells than normal brain cells [5]. In this study, immunohistochemical staining of primary human glioblastoma tissues showed strong immunoreactivity of Notch1. In contrast, several studies reported a weak expression of Notch1 in glioblastoma [9,11,28]. In this study, propranolol suppressed glioblastoma cell proliferation (MTT assay), and induced Notch1 expression in both U87-MG and LN229 cells (RT-PCR and WB). There were no remarkable differences in glioblastoma cell proliferation between the cases treated with negative controlled-Notch1 siRNA and active Notch1 siRNA (p=0.157). These results demonstrate that pathways other than Notch1 exist and play a key role in the proliferation and survival of glioblastoma. In case of Hes1, copy number was increased in real time PCR, but expression was decreased in WB analysis after treatment with propranolol. Propranolol may block Hes1 expression at the translation step or post-translational modification step, and these results were compatible with decreased glioblastoma cell proliferation. The Hes1 signaling pathway is thought to play an important role in the proliferation and survival of glioblastoma. A previous study demonstrated that nerve growth stimulated glioblastoma proliferation through the Notch1 pathway [32]. They treated U87-MG with nerve growth factor and stimulated cell proliferation. Expression levels of Notch1 and Hes1 were increased simultaneously. These findings are consistent with the results of our study in that Hes1 plays an important role in glioblastoma proliferation.
Several reports using the same type of cell lines as in this paper have been studied regarding glioblastoma proliferation. Kusaczuk et al. [20] reported that phenylbutyrate has a suppressive effect on the proliferation of glioblastoma LN229 cells. Phenylbutyrate is a histone deacetylase inhibitor known to induce differentiation, cell cycle arrest, and apoptosis in various cancer cells. They added phenylbutyrate to LN229 and cell viability showed dose-dependent reduction in the MTT assay. The density of LN229 cells was reduced and morphology was changed as phenylbutyrate was treated. Another reports demonstrated that CKD-602, a camptothecin derivative, inhibited proliferation and induced apoptosis in U87-MG and LN229 glioma cell lines [17]. CKD-602 is a synthetic water-soluble camptothecin derivative and topoisomerase inhibitor that has been shown to have clinical anticancer effect against ovarian and lung cancer. It stabilizes DNA preventing the religation of DNA breaks, which leads to an inhibition of DNA replication and triggers apoptotic cell death [10]. They treated U87-MG and LN229 with 10 mM stock solutions of CKD-602 and dose-dependent cytotoxicity and proliferation inhibition was observed.
This study has some limitations. First, commercialized glioblastoma cell lines were used with in vitro experiments in this study, and there could be some differences with in vivo reactions in the human brain. Second, only three kinds of glioblastoma and neuroblastoma cell lines were used in this study. Different results could be obtained according to different types of cell lines. More diverse types of glioblastoma cell lines should be evaluated in future study. And we did not take into account glioblastoma and neuroblastoma are different tumors. Although there would be a clear difference in mechanism between the two types of tumors, our experiment was conducted without paying attention to the difference. Third, the impact of propranolol on Hes1 was not clearly revealed. The molecular targets controlling Hes1 expression should be investigated with transcriptome study, but it was not conducted in this paper. Additional mechanisms of the reaction between propranolol and Hes1 should be evaluated at the molecular level in a future study.

CONCLUSION

This study suggests that propranolol suppresses glioblastoma proliferation in a dose-dependent manner. Propranolol could be a new therapeutic option for glioblastoma patients. While various efforts and treatment modalities are being made to treat glioblastoma, survival is still very poor in the majority of patients. As discussed in this study, further exploration for understanding the molecular-level mechanisms should be made to design new effective strategies to cure glioblastoma in the future.

Notes

CONFLICTS OF INTEREST

No potential conflict of interest relevant to this article was reported.

INFORMED CONSENT

This type of study does not require informed consent.

AUTHOR CONTRIBUTIONS

Conceptualization : IBC, HSK

Data curation : IBC, HSK, YHP, MJK, JHS, HSL

Formal analysis : IBC, HSK

Methodology : HSK, YHP, MJK, JHS

Project administration : HSK, IBC

Visualization : HSK, HSL

Writing - original draft : HSK

Writing - review & editing : IBC

References

1. Algazi M, Plu-Bureau G, Flahault A, Dondon MG, Lê MG. Could treatments with beta-blockers be associated with a reduction in cancer risk? Rev Epidemiol Sante Publique. 52:53–65. 2004.
2. Anjum K, Shagufta BI, Abbas SQ, Patel S, Khan I, Shah SAA, et al. Current status and future therapeutic perspectives of glioblastoma multiforme (GBM) therapy: a review. Biomed Pharmacother. 92:681–689. 2017.
crossref
3. Artavanis-Tsakonas S, Rand MD, Lake RJ. Notch signaling: cell fate control and signal integration in development. Science. 284:770–776. 1999.
crossref
4. Aster JC, Pear WS. Notch signaling in leukemia. Curr Opin Hematol. 8:237–244. 2001.
crossref
5. Bazzoni R, Bentivegna A. Role of notch signaling pathway in glioblastoma pathogenesis. Cancers (Basel). 11:292. 2019.
6. Bigas A, Martin DI, Milner LA. Notch1 and Notch2 inhibit myeloid differentiation in response to different cytokines. Mol Cell Biol. 18:2324–2333. 1998.
crossref
7. Bolós V, Grego-Bessa J, de la Pompa JL. Notch signaling in development and cancer. Endocr Rev. 28:339–363. 2007.
crossref
8. Cheung HC, Corley LJ, Fuller GN, McCutcheon IE, Cote GJ. Polypyrimidine tract binding protein and Notch1 are independently re-expressed in glioma. Mod Pathol. 19:1034–1041. 2006.
crossref
9. Dell’albani P, Rodolico M, Pellitteri R, Tricarichi E, Torrisi SA, D’Antoni S, et al. Differential patterns of NOTCH1-4 receptor expression are markers of glioma cell differentiation. Neuro Oncol. 16:204–216. 2014.
crossref
10. Fassberg J, Stella VJ. A kinetic and mechanistic study of the hydrolysis of camptothecin and some analogues. J Pharm Sci. 81:676–684. 1992.
crossref
11. Hai L, Zhang C, Li T, Zhou X, Liu B, Li S, et al. Notch1 is a prognostic factor that is distinctly activated in the classical and proneural subtype of glioblastoma and that promotes glioma cell survival via the NFκB(p65) pathway. Cell Death Dis. 9:158. 2018.
crossref
12. Harada K, Sato Y, Ikeda H, Hsu M, Igarashi S, Nakanuma Y. Notch1- Hes1 signalling axis in the tumourigenesis of biliary neuroendocrine tumours. J Clin Pathol. 66:386–391. 2013.
crossref
13. He JJ, Zhang WH, Liu SL, Chen YF, Liao CX, Shen QQ, et al. Activation of β-adrenergic receptor promotes cellular proliferation in human glioblastoma. Oncol Lett. 14:3846–3852. 2017.
crossref
14. Hiller JG, Cole SW, Crone EM, Byrne DJ, Shackleford DM, Pang JB, et al. Preoperative β-blockade with propranolol reduces biomarkers of metastasis in breast cancer: a phase II randomized trial. Clin Cancer Res. 26:1803–1811. 2020.
crossref
15. Jang MS, Zlobin A, Kast WM, Miele L. Notch signaling as a target in multimodality cancer therapy. Curr Opin Mol Ther. 2:55–65. 2000.
16. Jundt F, Anagnostopoulos I, Förster R, Mathas S, Stein H, Dörken B. Activated Notch1 signaling promotes tumor cell proliferation and survival in Hodgkin and anaplastic large cell lymphoma. Blood. 99:3398–3433. 2002.
crossref
17. Kim YY, Park CK, Kim SK, Phi JH, Kim JH, Kim CY, et al. CKD-602, a camptothecin derivative, inhibits proliferation and induces apoptosis in glioma cell lines. Oncol Rep. 21:1419–1419. 2009.
crossref
18. Kopan R, Ilagan MX. The canonical Notch signaling pathway: unfolding the activation mechanism. Cell. 137:216–233. 2009.
crossref
19. Krex D, Klink B, Hartmann C, von Deimling A, Pietsch T, Simon M, et al. Long-term survival with glioblastoma multiforme. Brain. 130(Pt 10):2596–2606. 2007.
crossref
20. Kusaczuk M, Krętowski R, Bartoszewicz M, Cechowska-Pasko M. Phenylbutyrate-a pan-HDAC inhibitor-suppresses proliferation of glioblastoma LN-229 cell line. Tumour Biol. 37:931–942. 2016.
crossref
21. Leong KG, Karsan A. Recent insights into the role of Notch signaling in tumorigenesis. Blood. 107:2223–2233. 2006.
crossref
22. Li J, Cui Y, Gao G, Zhao Z, Zhang H, Wang X. Notch1 is an independent prognostic factor for patients with glioma. J Surg Oncol. 103:813–817. 2011.
crossref
23. Lino MM, Merlo A, Boulay JL. Notch signaling in glioblastoma: a developmental drug target? BMC Med. 8:72. 2010.
crossref
24. Liu Y, Su C, Shan Y, Yang S, Ma G. Targeting Notch1 inhibits invasion and angiogenesis of human breast cancer cells via inhibition nuclear factor-κB signaling. Am J Transl Res. 8:2681–3692. 2016.
25. Louis DN, Ohgaki H, Wiestler OD, Cavenee WK, Fuller C. World Health Organization classification of tumours of the central nervous system, fourth edition. J Neuropathol Exp Neurol. 67:260. 2008.
crossref
26. Louis DN, Perry A, Burger P, Ellison DW, Reifenberger G, von Deimling A, et al. International Society of Neuropathology--haarlem consensus guidelines for nervous system tumor classification and grading. Brain Pathol. 24:429–435. 2014.
crossref
27. Louis DN, Perry A, Reifenberger G, von Deimling A, Figarella-Branger D, Cavenee WK, et al. The 2016 World Health Organization classification of tumors of the central nervous system: a summary. Acta Neuropathol. 131:803–820. 2016.
crossref
28. Margareto J, Leis O, Larrarte E, Idoate MA, Carrasco A, Lafuente JV. Gene expression profiling of human gliomas reveals differences between GBM and LGA related to energy metabolism and notch signaling pathways. J Mol Neurosci. 32:53–63. 2007.
crossref
29. Miele L, Golde T, Osborne B. Notch signaling in cancer. Curr Mol Med. 6:905–918. 2006.
crossref
30. Nicolas M, Wolfer A, Raj K, Kummer JA, Mill P, van Noort M, et al. Notch1 functions as a tumor suppressor in mouse skin. Nat Genet. 33:416–421. 2003.
crossref
31. Ostrom QT, Gittleman H, Truitt G, Boscia A, Kruchko C, Barnholtz-Sloan JS. CBTRUS statistical report: primary brain and other central nervous system tumors diagnosed in the united states in 2011-2015. Neuro Oncol. 20(suppl_4):iv1–iv86. 2018.
crossref
32. Park JC, Chang IB, Ahn JH, Kim JH, Song JH, Moon SM, et al. Nerve growth factor stimulates glioblastoma proliferation through Notch1 receptor signaling. J Korean Neurosurg Soc. 61:441–449. 2018.
crossref
33. Park YH, Kim SJ, Jeong BH, Herzog TJ, Wright J, Kitajewski J, et al. Follicular stimulating hormone enhances Notch 1 expression in SK-OV-3 ovarian cancer cells. J Gynecol Oncol. 21:119–124. 2010.
crossref
34. Pasquier E, Ciccolini J, Carre M, Giacometti S, Fanciullino R, Pouchy C, et al. Propranolol potentiates the anti-angiogenic effects and anti-tumor efficacy of chemotherapy agents: implication in breast cancer treatment. Oncotarget. 2:797–809. 2011.
crossref
35. Pasquier E, Street J, Pouchy C, Carre M, Gifford AJ, Murray J, et al. β-blockers increase response to chemotherapy via direct antitumour and anti-angiogenic mechanisms in neuroblastoma. Br J Cancer. 108:2485–2494. 2013.
crossref
36. Phillips HS, Kharbanda S, Chen R, Forrest WF, Soriano RH, Wu TD, et al. Molecular subclasses of high-grade glioma predict prognosis, delineate a pattern of disease progression, and resemble stages in neurogenesis. Cancer Cell. 9:157–173. 2006.
crossref
37. Powe DG, Voss MJ, Zänker KS, Habashy HO, Green AR, Ellis IO, et al. Beta-blocker drug therapy reduces secondary cancer formation in breast cancer and improves cancer specific survival. Oncotarget. 1:628–638. 2010.
crossref
38. Rundle-Thiele D, Head R, Cosgrove L, Martin JH. Repurposing some older drugs that cross the blood-brain barrier and have potential anticancer activity to provide new treatment options for glioblastoma. Br J Clin Pharmacol. 81:199–209. 2016.
crossref
39. Sriuranpong V, Borges MW, Ravi RK, Arnold DR, Nelkin BD, Baylin SB, et al. Notch signaling induces cell cycle arrest in small cell lung cancer cells. Cancer Res. 61:3200–3205. 2001.
40. Stupp R, Mason WP, van den Bent MJ, Weller M, Fisher B, Taphoorn MJ, et al. Radiotherapy plus concomitant and adjuvant temozolomide for glioblastoma. N Engl J Med. 352:987–996. 2005.
crossref
41. Xu P, Yu S, Jiang R, Kang C, Wang G, Jiang H, et al. Differential expression of Notch family members in astrocytomas and medulloblastomas. Pathol Oncol Res. 15:703–710. 2009.
crossref
42. Zhang D, Ma Q, Shen S, Hu H. Inhibition of pancreatic cancer cell proliferation by propranolol occurs through apoptosis induction: the study of beta-adrenoceptor antagonist’s anticancer effect in pancreatic cancer cell. Pancreas. 38:94–100. 2009.
crossref
43. Zhang H, Wei T, Johnson A, Sun R, Richter G, Strub GM. NOTCH pathway activation in infantile hemangiomas. J Vasc Surg Venous Lymphat Disord. 9:489–496. 2021.
crossref

Fig. 1.
Immunohistochemical staining of primary human glioblastoma tissues for Notch1 by the streptavidin-biotin-peroxidase complex technique. Glioblastoma tissue shows negative staining with less than 10% of staining area (A), weak positive staining with 10–20% of staining area (b), moderate positive staining with 20–50% of staining area (c), and strong positive staining with more than 50% of staining area (d). Scale bar, 200 μm.
jkns-2021-0068f1.tif
Fig. 2.
3-(4,5-dimethylthiazol-2-yl)-2,5-diphenyltetrazolium bromide (MTT) assay shows that propranolol suppresses U87-MG, SH-SY5Y, and LN229 cell lines in a dose-dependent manner (p=0.013).
jkns-2021-0068f2.tif
Fig. 3.
3-(4,5-dimethylthiazol-2-yl)-2,5-diphenyltetrazolium bromide (MTT) assay shows that isoproterenol suppresses U87-MG, SH-SY5Y, and LN229 cell lines in a dose-dependent manner (p=0.013).
jkns-2021-0068f3.tif
Fig. 4.
Relative expression fold of Notch1 and Hes1 genes of U87-MG (A) and LN229 (b) in real time polymerase chain reaction (PcR) shows propranolol increases copy number of Notch1 and Hes1 genes (p=0.035). Expression of Notch1 and Hes1 protein of U87-MG (c) and LN229 (d) in Western blot demonstrates that propranolol stimulates Notch1 expression but suppresses Hes1 expression (p=0.021).
jkns-2021-0068f4.tif
Fig. 5.
Proliferation of glioblastoma cell lines in 3-(4,5-dimethylthiazol-2-yl)-2,5-diphenyltetrazolium bromide (MTT) assay. There are no significant differences between lipofectamine with negative control small interfering RNA (siRNA) and lipofectamine with active siRNA groups in control of both cell lines (p=0.157).
jkns-2021-0068f5.tif
TOOLS
Similar articles