INTRODUCTION
MATERIALS AND METHODS
Cloning and lentivirus production
Genetically modified MSC
Experimental animals
SCI and experimental groups
Cell transplantation
Behavioral test
Real-time quantitative polymerase chain reaction
Western blotting
Immunofluorescence staining
Cytokine analysis
RESULTS
Development of enhanced Wnt3a-MSC
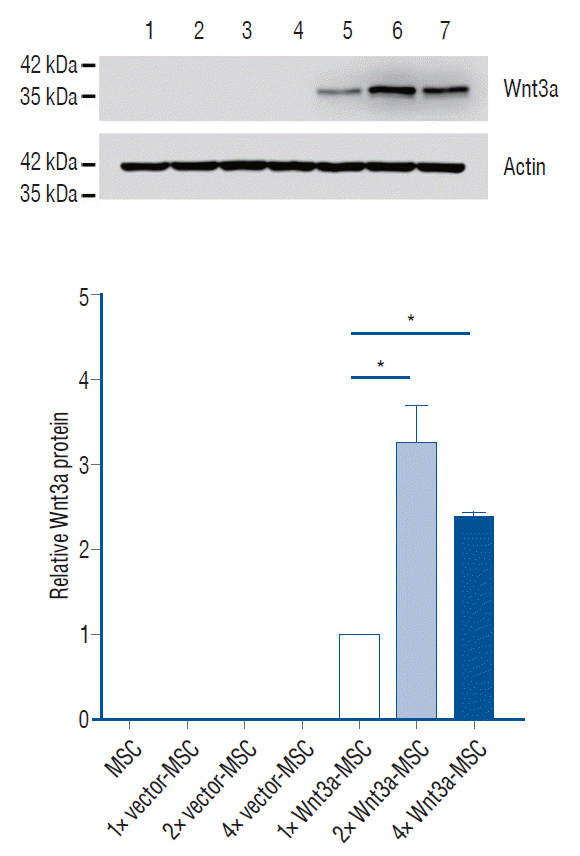
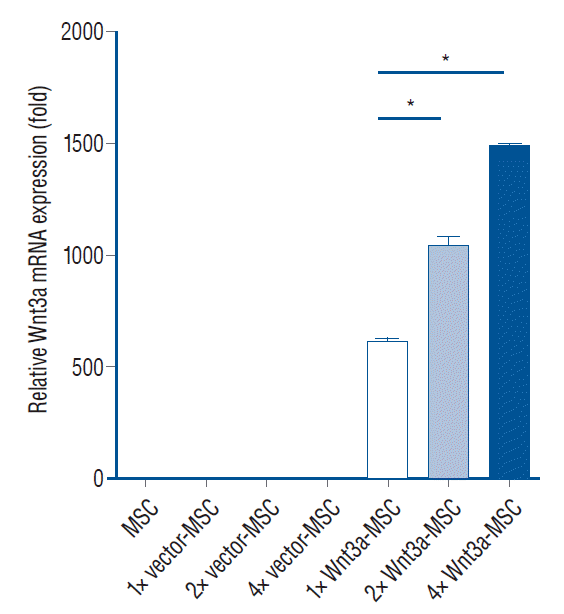 | Fig. 1.Wnt3a mRNA expression in each transfection condition. 2× Wnt3a-MSc showed 1.7 fold Wnt3a mRNA expression level, and 4× Wnt3a-MSc showed 2.4 fold Wnt3a mRNA expression level as compared to 1× Wnt3a-MSc. *p<0.001. MSc : mesenchymal stem cells. |
Enhanced Wnt3a gene expression in hMSC promotes behavioral recovery
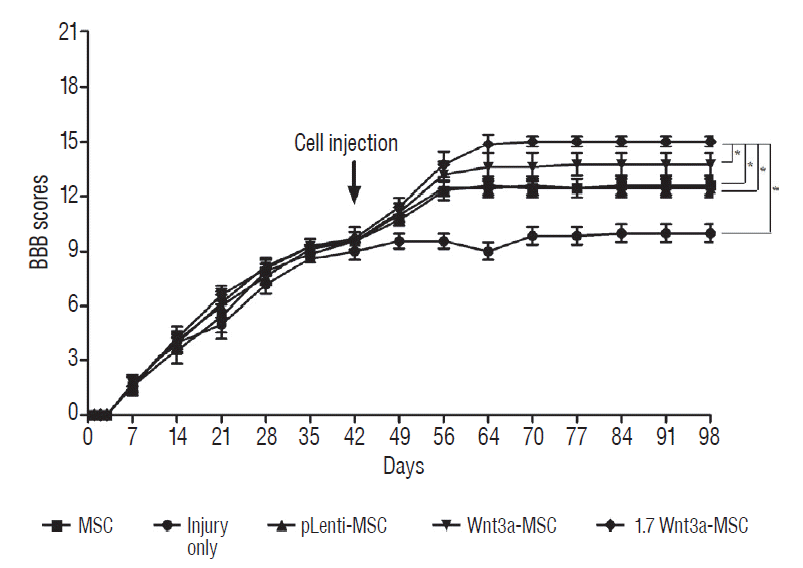 | Fig. 4.basso-beattie-bresnahan (bbb) locomotor scale test. We transplanted phosphate-buffered saline (injury only group), hMSc (MSc group), hMSc transfected with pLenti vector (pLenti-MSc group), hMSc transfected with Wnt3a gene (Wnt3a-MSc group), and hMSc transfected with enhanced Wnt3a gene (1.7 Wnt3a-MSc group) in each group of rat at 6 weeks after spinal cord injury (new chronic spinal cord injury model). The 1.7 Wnt3a-MSc group showed significant behavioral recovery as compared to all other groups at 8 weeks after transplantation. Data were presented as mean±standard deviation. *p<0.05. MSc : mesenchymal stem cells, hMSc : human mesenchymal stem cells. |
Immunofluorescence for axonal regeneration markers
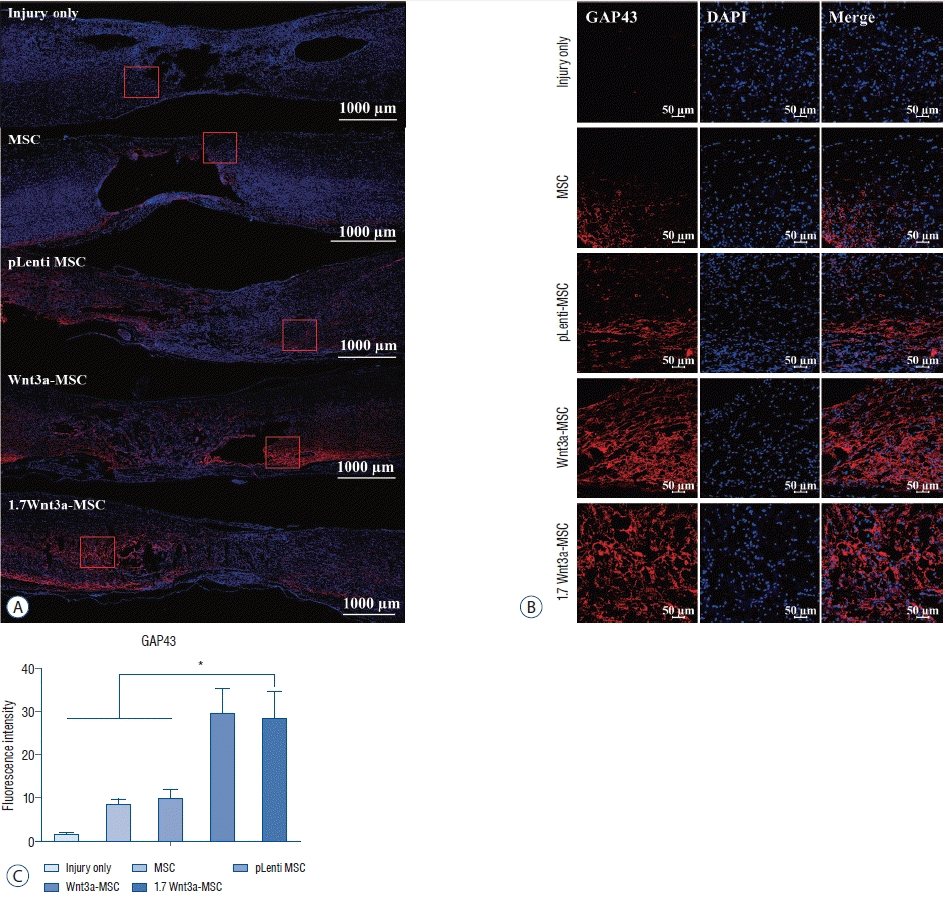 | Fig. 5.Immunofluorescent staining of axonal regeneration marker growth-associated protein 43 (GAP43). confocal microscopic images revealed that anti-GAP43 antibody staining in the spinal cord was greater in the Wnt3a-MSc and 1.7 Wnt3a-MSc groups than in other groups. A : Tile scan image; scale bar : 1000 μm. b : Scale bar : 50 μm (magnification, ×100). c : Quantification of fluorescence intensity. *p<0.05. MSc : mesenchymal stem cells, DAPI : 4',6-diamidino-2-phenylindole. |
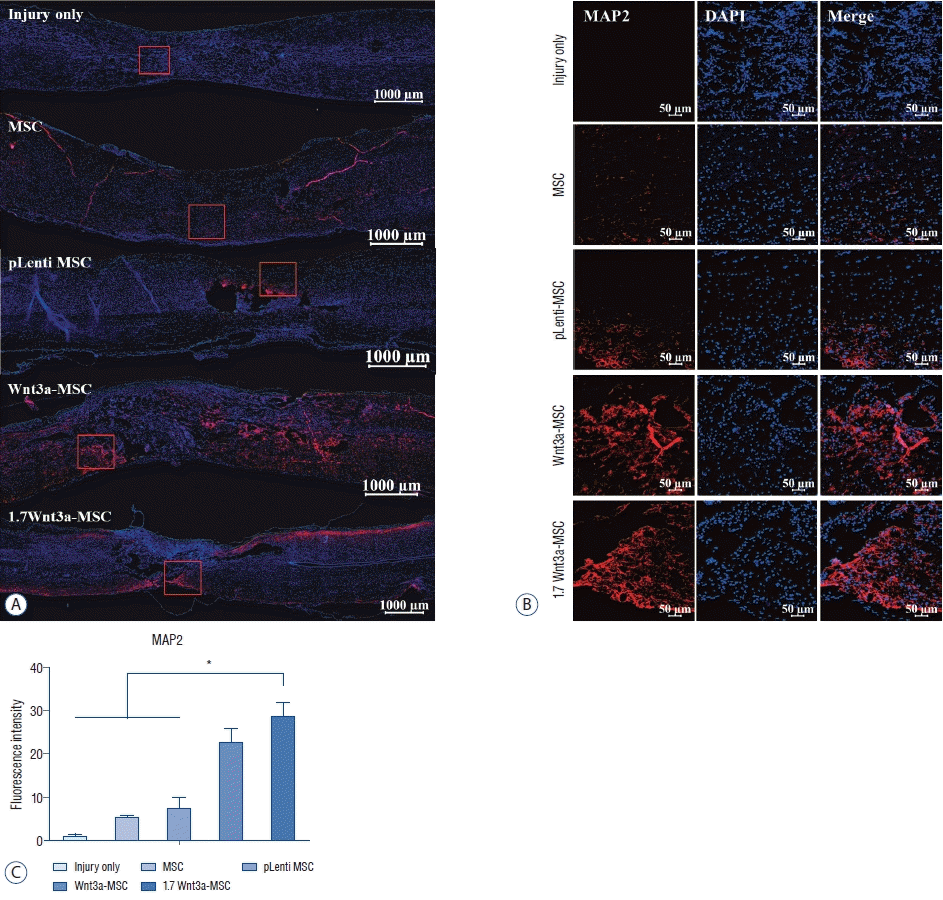 | Fig. 6.Immunofluorescent staining of axonal regeneration marker microtubule-associated protein 2 (MAP2). confocal microscopic images revealed that anti-MAP2 antibody staining in the spinal cord was greater in the Wnt3a-MSc and 1.7 Wnt3a-MSc groups than in other groups. A : Tile scan image; scale bar : 1000 μm. b : Scale bar : 50 μm (magnification, ×100). c : Quantification of fluorescence intensity. *p<0.05. MSc : mesenchymal stem cells, DAPI : 4',6-diamidino-2-phenylindole. |
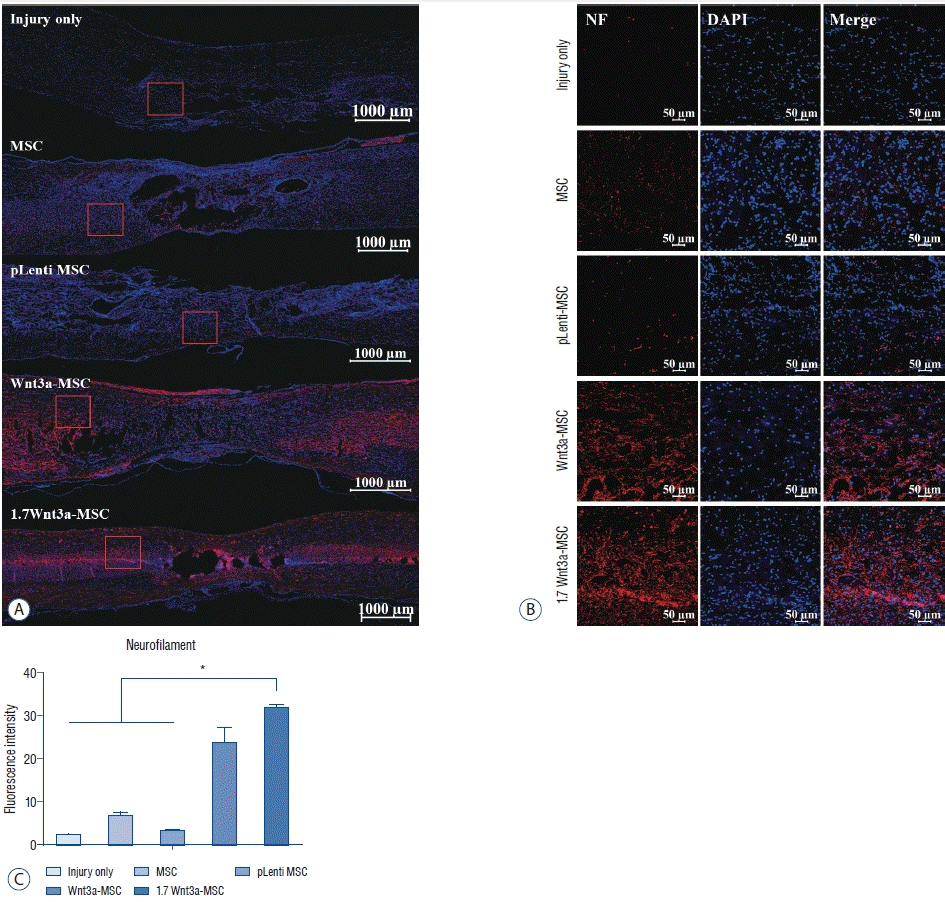 | Fig. 7.Immunofluorescent staining of axonal regeneration marker neurofilament (NF). confocal microscopic images revealed that anti-NF antibody staining in the spinal cord was greater in the Wnt3a-MSc and 1.7 Wnt3a-MSc groups than in other groups. A : Tile scan image; scale bar : 1000 μm. b : Scale bar : 50 μm (magnification, ×100). c : Quantification of fluorescence intensity. *p<0.05. MSc : mesenchymal stem cells, DAPI : 4',6-diamidino-2-phenylindole. |


 PDF
PDF Citation
 Print
Print


 XML Download