INTRODUCTION
MATERIALS AND METHODS
Subjects
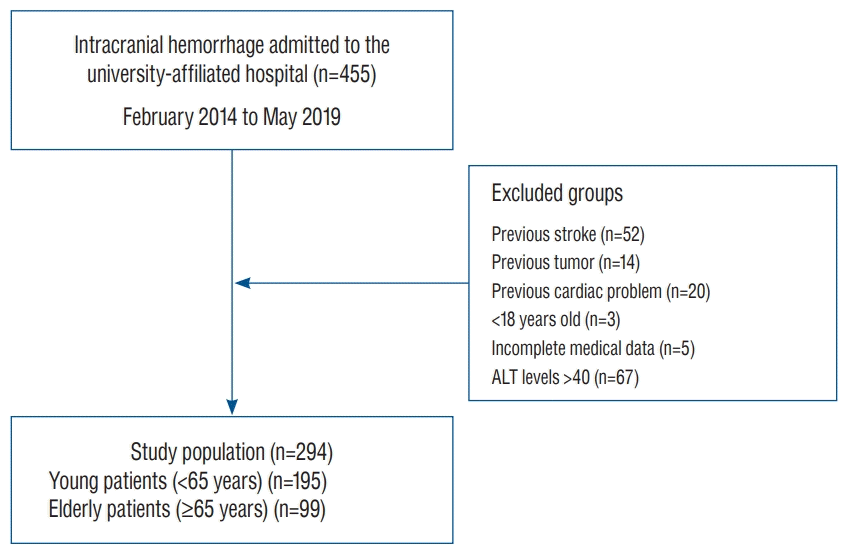
 | Fig. 1.Strengthening the reporting of observational studies in epidemiology diagram of the study population. From the 455 patients, 52, 14, and 20 patients were excluded because they had a history of previous stroke, tumor, or cardiac problems, respectively. Among the remaining 369 patients with intracranial hemorrhage, three patients under 18 years old, five patients with incomplete medical records and laboratory data, and 67 patients whose serum ALT levels greater than 40 were excluded. Finally, 294 subjects were enrolled in the study. ALT : alanine transaminase. |
Data collection
Data preprocessing
Statistical analyses
RESULTS
Table 1.
Values are presented as mean±standard deviation or number (%). GCS : Glasgow coma scale, EDH : extradural hemorrhage, SDH : subdural hemorrhage, ICH : Intracranial hemorrhage, IVH : intraventricular hemorrhage, SAH : subarachnoid hemorrhage, ALT : alanine aminotransferase, Hb : hemoglobin, CRP : C-reactive protein, BMI : body mass index, DM : diabetes mellitus
Table 2.
|
Total (n=294) |
Elderly (n=99) |
Young (n=195) |
||||
|---|---|---|---|---|---|---|
| HR | p-value | HR | p-value | HR | p-value | |
| Age (years) | 1.029 | 0.004* | 1.005 | 0.841 | 0.998 | 0.925 |
| Sex | 0.909 | 0.762 | 0.759 | |||
| Female | Ref. | Ref. | Ref. | |||
| Male | 1.036 | 0.909 | 1.132 | 0.762 | 0.865 | 0.759 |
| Initial GCS | 0.760 | 0.000* | 0.806 | 0.000* | 0.718 | 0.000* |
| Cause | 0.518 | 0.096 | 0.996 | |||
| Trauma | Ref. | Ref. | Ref. | |||
| Spontaneous | 0.752 | 0.518 | 0.402 | 0.096 | 1.004 | 0.996 |
| Hemorrhage type | 0.268 | 0.309 | 0.528 | |||
| EDH, SDH | Ref. | Ref. | Ref. | |||
| ICH, IVH | 2.157 | 0.151 | 2.091 | 0.193 | 33339.516 | 0.928 |
| SAH | 1.498 | 0.489 | 2.602 | 0.139 | 18421.813 | 0.932 |
| Laboratory findings at diagnosis | ||||||
| Extremely low ALT (<10 U/L) | 4.298 | 0.000* | 6.135 | 0.000* | 1.563 | 0.551 |
| Low albumin (<3.5 g/dL) | 11.872 | 0.000* | 3.661 | 0.010* | 32.272 | 0.000* |
| Low Hb (<11 g/dL) | 7.887 | 0.000* | 4.809 | 0.000* | 12.744 | 0.000* |
| Creatinine | 1.417 | 0.000* | 1.315 | 0.043* | 1.497 | 0.000* |
| CRP | 1.018 | 0.000* | 1.017 | 0.000* | 1.019 | 0.000* |
| BMI | 0.057 | 0.210 | 0.291 | |||
| Underweight (<18.5) | Ref. | Ref. | Ref. | |||
| Normal weight (18.5–24.9) | 0.523 | 0.069 | 0.537 | 0.168 | 0.606 | 0.397 |
| Overweight (25.0–29.9) | 0.248 | 0.009 | 0.345 | 0.116 | 0.239 | 0.099 |
| Obese (≥30) | 0.740 | 0.694 | No data | 1.298 | 0.763 | |
| DM | 0.820 | 0.677 | 0.840 | 0.750 | 0.441 | 0.426 |
| Hypertension | 1.323 | 0.365 | 0.976 | 0.955 | 0.879 | 0.806 |
| Dyslipidemia | 1.114 | 0.821 | 0.840 | 0.750 | 0.790 | 0.819 |
| Smoking history | 1.178 | 0.640 | 1.606 | 0.346 | 1.330 | 0.568 |
| Alcohol consumption | 0.830 | 0.564 | 1.287 | 0.574 | 0.879 | 0.879 |
HR : hazard ratio, GCS : Glasgow coma scale, EDH : extradural hemorrhage, SDH : subdural hemorrhage, ICH : Intracranial hemorrhage, IVH : intraventricular hemorrhage, SAH : subarachnoid hemorrhage, ALT : alanine aminotransferase, Hb : hemoglobin, CRP : C-reactive protein, BMI : body mass index, DM : diabetes mellitus
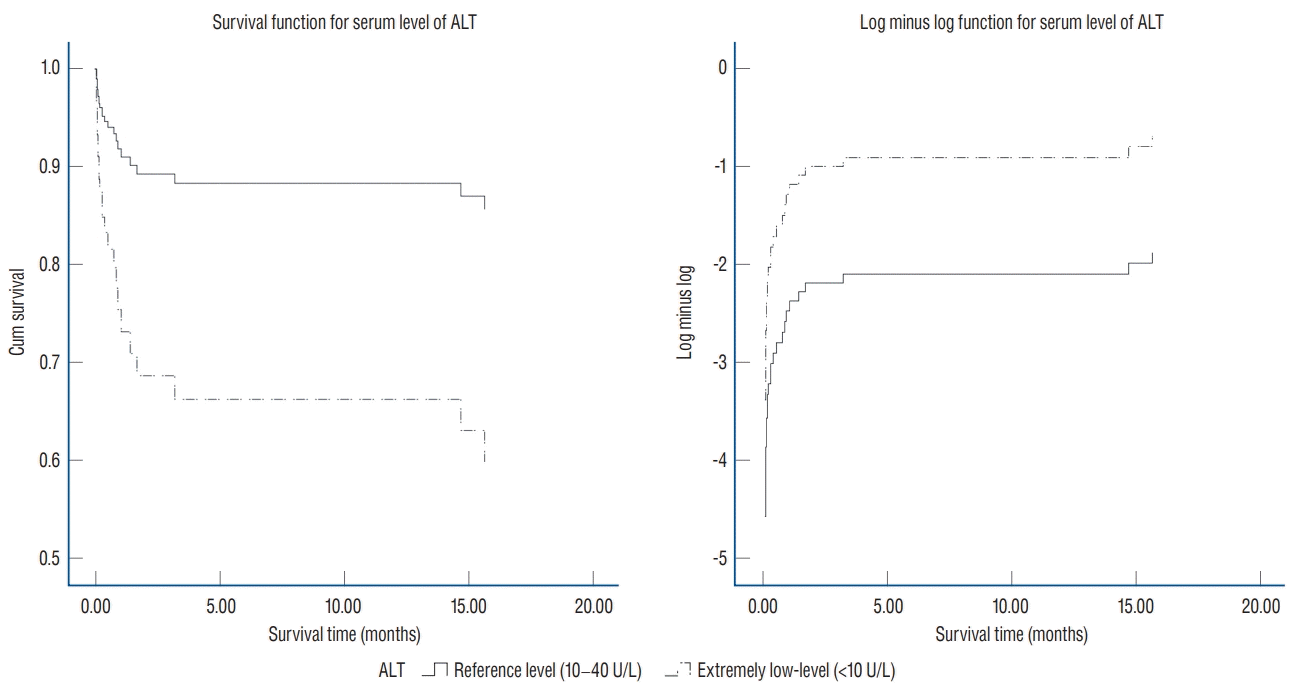
 | Fig. 2.Cumulative survival and log minus log curve in the elderly group. The Cox proportional model was constructed according to the ALT level, and it was found that there was a difference in survival rate in the elderly group, even though the confounders were controlled. Since the log minus log functions did not cross each other in this study, the application of the Cox proportional hazard model is appropriate. Elderly people with extremely low ALT levels (<10 U/L) at the time of intracranial hemorrhage had a higher mortality rate than those with reference ALT levels (10–40 U/L). ALT : alanine aminotransferase. |
Table 3.
| Adjusted HR |
95% CI |
p-value | ||
|---|---|---|---|---|
| Lower | Upper | |||
| Total | ||||
| Age (years) | 1.023 | 1.001 | 1.045 | 0.040* |
| CRP | 1.012 | 1.007 | 1.016 | <0.001* |
| Low Hb (<11 g/dL) | 3.592 | 1.778 | 7.258 | <0.001* |
| Initial GCS | 0.837 | 0.765 | 0.916 | <0.001* |
| Young | ||||
| CRP | 1.012 | 1.005 | 1.019 | 0.001* |
| Low Hb (<11 g/dL) | 5.635 | 1.759 | 18.054 | 0.004* |
| Initial GCS | 0.803 | 0.695 | 0.927 | 0.003* |
| Elderly | ||||
| Extremely Low ALT (<10 U/L) | 3.313 | 1.232 | 8.909 | 0.018* |
| CRP | 1.008 | 1.000 | 1.016 | 0.051 |
| Initial GCS | 0.844 | 0.750 | 0.949 | 0.005* |


 PDF
PDF Citation
 Print
Print


 XML Download