Journal List > J Korean Neurosurg Soc > v.63(5) > 1160890

Hong, Han, Lee, Lee, and Moon: Is the Agricultural Work a Risk Factor for Koreans Elderly Spinal Sagittal Imbalance?

Abstract

Objective

A primary degenerative sagittal imbalance has been considered because of unique lifestyles such as the prolonged crouched posture during agricultural work and performing activities of daily living on the floor. Previous papers have reported that sagittal imbalance disease is often seen distinctly in the farming districts of “oriental” countries such as Korea and Japan. However, this finding was only evaluated with the use of X-ray, and other factors such as magnetic resonance imaging (MRI), muscle volume, compression fracture, and laboratory results were not considered. Thus, using these, we evaluate the agricultural work-associated factors for Korean elderly spinal sagittal imbalance.

Methods

We recruited 103 Korean participants who had a sagittal vertical axis (SVA) of >5 cm in this Korean Elderly Sagittal Imbalance Cohort Study. The following were evaluated : radiological parameters, MRI, compression fracture, vitamin D, parathyroid hormone, C-terminal telopeptide, osteocalcin, bone mineral density and muscle fatty change, muscle volume, and health-related quality of life from patients’ survey. Moreover, in this survey, the farmers’ annual working hours were investigated. Subsequently, we analyzed the associated factors for spinal sagittal imbalance depending on occupation.

Results

A total of 46 participants were farmers, and the others were housewives, sellers, and office workers. The farmer group had more SVA (141 vs. 99 mm, p=0.001) and pelvic tilt (31° vs. 24°, p=0.004) and lesser lumbar lordosis (20° vs. 30°, p=0.009) and thoracic kyphosis (24° vs. 33°, p=0.03) than non-farmer group. A significantly positive correlation was noted between the working hour and SVA in the farmer group (p=0.014). The visual analogue scale score for back pain (8.26 vs. 6.96, p=0.008) and Oswestry Disability Index (23.5 vs. 19.1, p=0.003) in the farmer group were higher than that in the non-farmer group, but the Short Form-36 score was not significantly different between the two groups. The Mini-Mental State Exam score was significantly lower in the farmer group than in the non-farmer group (24.85 vs. 26.98, p=0.002).

Conclusion

The farmer group had more sagittal imbalance and back pain in proportion to the working hours even though the muscle and bone factors and general laboratory condition were not significantly different between the two groups. These results supported that the long hours spent in the crouched posture while performing agricultural work were a risk factor for severe sagittal imbalance.

INTRODUCTION

Primary degenerative sagittal imbalance (PDSI) is a branch of adult spinal deformity from the perspective of global sagittal alignment [14]. It was first described in Japan, which was thought to be attributed to a sedentary lifestyle and long squatting activity engaged in agriculture [4,16,17]. Previous papers reported that PDSI is common in Asian agricultural regions such as Korea and Japan, but there is no significant progress in understanding this condition [16,17,23]. Sagittal imbalance is common in elderly, and its prevalence rate ranges from 20% to 40%. Moreover, it was thought to be an aging process but gradually recognized as a disease to be treated [10]. Three components of the spinal column are involved in the transformation into a marked spinal deformity [22]. Especially in terms of health-related quality of life (HRQOL), it is one of the most significant topics in spinal diseases [2,8,14,24]. From the data of the United States and South Korea, as the population ages rapidly, the burden of degenerative spinal diseases also increases quickly [7,15]. Sagittal imbalance is thought to be a cumulative result of degeneration, but the exact impact factors are not clearly defined [1]. Although some authors reported that squatting and sedentary lifestyles are common in rural populations, the quantitative analysis of occupational factors for Koreans has not yet been elucidated [16,23]. In the present study, we performed an assessment of the degree of sagittal imbalance and HRQOL between the agricultural and nonagricultural populations.

MATERIALS AND METHODS

Study design

This study was approved by the Institutional Review Board of Chonnam National University Medical School Research Institute (approval number CNUH-2016-127). For the purpose of the study, not the treatment, we recruited 103 Korean participants over 60 years old who had a sagittal vertical axis (SVA) of >5 cm on whole-spine standing X-ray in this Korean Elderly Sagittal Imbalance Cohort Study. The exclusion criteria were as follows : 1) bed-ridden state; 2) impossible independent life; 3) previous history of spine or knee operation; 4) past history of Parkinson’s disease or cerebrovascular disease; and 5) presence of severe infection and acute vertebral fracture and in quarantine. The participants were divided into two groups : farmer and non-farmer.
Face-to-face questionnaires were administered for HRQOL as follows : visual analogue scale (VAS) of the back and leg, Physical Component Summary (PCS)/Mental Component Summary (MCS) of Short Form-36 (SF-36), Oswestry Disability Index (ODI), and Mini-Mental State Exam (MMSE). In addition, telephone surveys were conducted on daily working hours and annual working periods. A working hour is defined as the product of daily working hours and annual working periods. The daily working time was defined as the time worked in a squatting position in a field during the day.

Data sources and variables

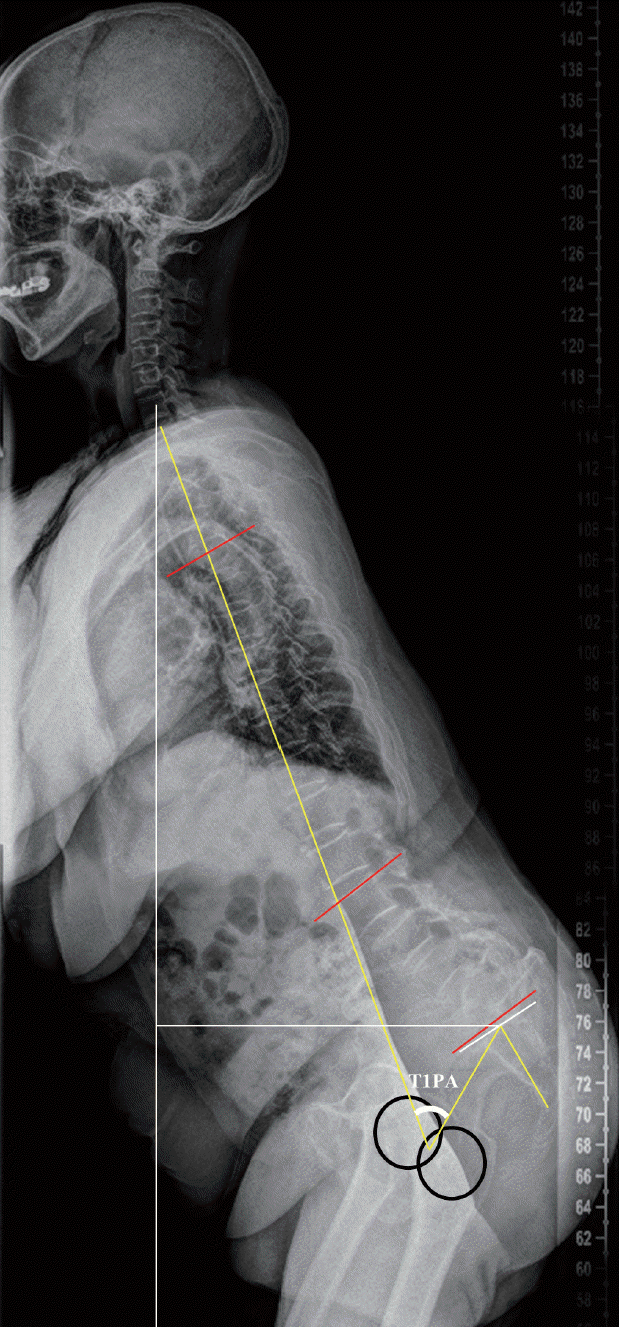
Demographics such as age, sex, weight, height, and body mass index were examined in each group. Whole-spine X-ray, lumbar magnetic resonance imaging (MRI), bone mineral density (BMD), and plasma clinical chemistry were performed in each patient. The radiological parameters of sagittal imbalance were measured on whole-spine lateral X-ray based on the Scoliosis Research Society (SRS)-Schwab radiological classification, including SVA, thoracic kyphosis (TK), T1 pelvic angle (T1PA), lumbar lordosis (LL), pelvic incidence (PI), pelvic tilt (PT), sacral slope (SS), and compression fracture (Fig. 1).
The back and lumbar muscle volumes were measured by the total cross-sectional area (TCSA) of the psoas muscle (PS), lumbar multifidus muscle (MF), and lumbar erector spinae muscle (ES) from the patients’ MRI image using the region of interest measurement tool of the picture archiving and communication system (M-view; INFINITT Healthcare, Seoul, Korea). In addition, fatty streaks of the lumbar muscle were measured from MRI according to the grading system by Battaglia et al. [3] and Goutallier et al. [9].
Laboratory tests were performed on peripheral venous blood samples. Hemoglobin A1c (HbA1c), vitamin D, calcium ion, parathyroid hormone (PTH), C-terminal telopeptide (CTX), osteocalcin, rheumatoid factor, total cholesterol, triglyceride, high-density lipoprotein (HDL) cholesterol were measured.

Statistics

All data were analyzed using SPSS ver. 18.0 (SPSS Inc., Chicago, IL, USA). Demographics, radiological parameters, questionnaires, and laboratory values associated with spinal sagittal imbalance were evaluated between the two groups using t-test, chi-square test, and regression analysis. Pearson’s correlation coefficient test was performed to analyze correlations between parameters. In the farmer group, a regression analysis was conducted to assure a correlation between the working hours and radiologic indicators. A p-value of <0.05 was considered significant. Described data are presented as mean±standard deviation.

RESULTS

Demographics

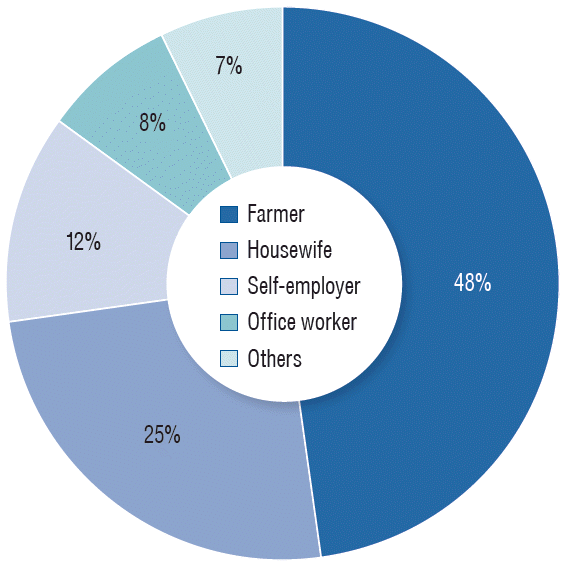
Seven participants were excluded from the study because they refused lumbar MRI scan. Consequently, there were 46 farmers and 50 non-farmers. Non-agricultural occupations consisted of housewives (25%), self-employed (12%), office workers (8%), and others (7%) (Fig. 2). The analyzed baseline statistics for each group are shown in Table 1.
The mean ages of the farmer and non-farmer groups were 72.85 and 70.1 years, respectively. The proportion of women in the farmer group was 76%, and that of the other was 86%. The farmer group showed lower height and weight than the non-farmer group. The BMD values at the lumbar spine and femur were relatively lower in the non-farmer group. However, no significant difference was found in the aforementioned values between the two groups. The average working hour in the farmer group was 270 hour-years (Table 1). The average working hour in the non-farmer group was 0 hour-years.

Radiological findings

The mean SVA values in the farmer and non-farmer groups were 14.16±6.13 and 9.96±5.42 cm, respectively (p=0.001). The farmer group demonstrated significantly decreased LL (20.05° vs. 30.71°, p=0.009) and TK (24.16° vs. 33.27°, p=0.03) than the non-farmer group. Significant increases in PI–LL (38.06° vs. 24.29°, p=0.003), PT (31.65° vs. 24.82°, p=0.004) and T1PA (37.84° vs. 28.29°, p=0.004) were noted in the farmer group, which resulted from subsequent pelvic compensation. As the imbalance was more remarkable in the farmer group, the two groups showed significantly different amounts of pelvic compensation. The muscle volume and fatty change calculated as TCSA and Goutallier’s grade of MF, ES, and PS were not significantly different between the two groups (Table 2). When the farmer group was analyzed separately, correlation analysis between SVA and other indicators was conducted in the agricultural group. There was no correlation with demographics, laboratory test or muscle quality other than working hour. In the multivariate regression analysis, between the working hours and radiological parameters, SVA had a significantly positive correlation (p=0.014). Longer working hours was the only predicting factor for the higher SVA value. No other SVA-related values were identified, such as TK, T1PA, LL, PI, PT, SS, and PI–LL (Table 3).

HRQOL

Self-reported surveys including the back and leg VAS, SF-36 PCS and MCS, ODI, and MMSE were evaluated. The VAS scores for back pain were 8.26 for the participants in the farmer group and 6.96 for those in the non-farmer group. This difference was statistically significant (p=0.008). However, the VAS score for leg pain was not significantly different between the two groups. SF-36 PCS and MCS had lower scores in the farmer group than in the non-farmer group, but statistical significance was found only for PCS (p=0.027). The ODI showed significantly higher scores in the farmer group (23.5 vs. 19.12, p=0.003). Meanwhile, the results of the MMSE were significantly lower in the participants in the farmer group (24.85 vs. 26.98, p=0.002; Table 4).

Laboratory findings

All laboratory tests including total cholesterol, HDL cholesterol, HbA1c, vitamin D, PTH, CTX, and osteocalcin had no difference between the two groups (Table 5).

DISCUSSION

We are the first to describe that Korean elderly farmers were shown to have more severe sagittal imbalance. The average SVA of the farmer group was 14 cm, which corresponds to the marked deformity of the SRS-Schwab classification [25]. T1PA was also higher in the farmer group, which is a sagittal alignment marker that compensates for the drawback that SVA is variable according to the measurer [19]. The decrease in LL was even worse at 20° in the farmer group. Compensatory sagittal balance changes resulted in more severe TK reductions in the farmer group. LL has evolved to adapt to promote upright posture in the human spine. Normal sagittal spine balance allows humanity to walk upright with minimal force [20]. The LL loss causes more energy to maintain an upright posture, which worsens pain exacerbations and LL loss itself [11,21]. Eventually, severe sagittal imbalance results in more severe back pain and lower quality of life. Several studies have shown that sagittal imbalance is closely associated with poor HRQOL [8]. In this study, back pain was more severe (VAS score for back pain, 8.26 vs. 6.96, p=0.008), and life discomfort was more common in the farmer group as the result of SF-36 PCS and ODI score (23.5 vs. 19.12, p=0.003) showed.
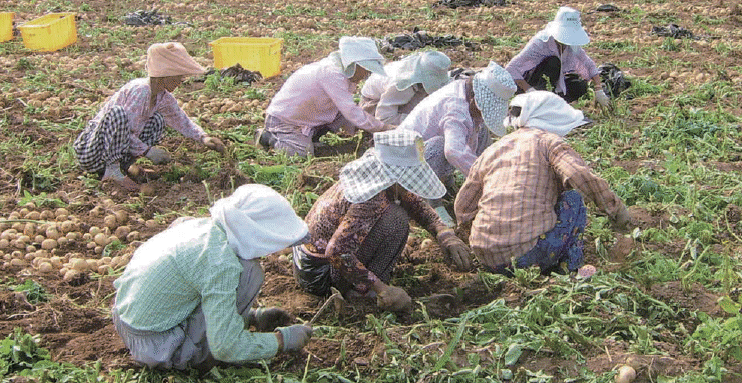
Korean elderly farmers suffered from more severe sagittal imbalance, complained of more pain, and had lower quality of life. In Korea, work in the rural areas is frequently performed while sitting on the floor or squatting, often accompanied by a load of heavy lifting by bending at the waist (Fig. 3) [14]. In addition, these areas are less modernized than cities, and several elderly people still live on the floor. Asian lifestyle, such as squatting and sitting on the floor without back support, is a common practice in East Asia, which causes back pain and poor quality of life. In the middle-aged Korean population, long hours of sedentary lifestyles have been reported to be associated with lower back pain [12]. Some reports have described that sitting or deep squatting without back support aggravates low back pain in the Korean rural population and middle-aged women in China [5,26]. In a Western study group, although the lumbar intervertebral disc pressure when sitting on a chair is higher than standing [6], such pressure is increased in the squatting position, and stress on the lumbar spine is greater. Further study of spine kinetics in this regard may evolve the understanding of sagittal imbalance. The intramuscular pressure of the erectors spinae is higher in the squatting position than in the upright posture, which leads to the viscoelastic deformation of tissue structure, resulting in changes in tissue composition as well as muscle fatigue or soreness [18]. In regard to lower lumbar spinal muscle volume and more fatty degeneration in severe sagittal imbalance [22], sedentary lifestyle in East Asia is also a factor associated with the muscle changes in such imbalance.
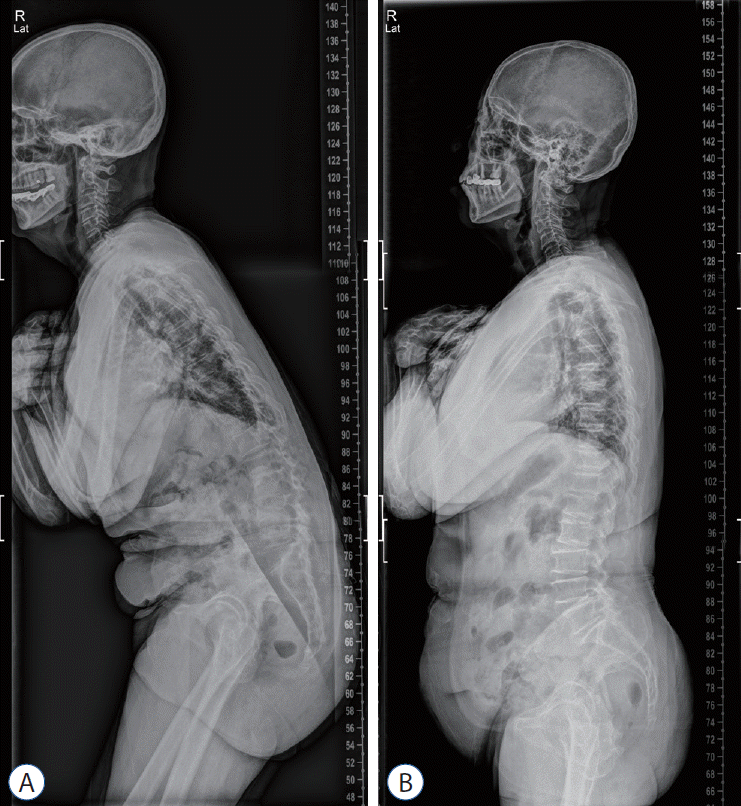
This study found a positive correlation between the agricultural working hour and SVA in the farmer group. To the best of our knowledge, this is the first report to show a statistically significant relationship between the working hour and SVA. In the correlation analysis of SVA on the farmer group, there was no correlation with demographics, laboratory test or muscle quality other than working hour. Radiological parameters or pain indicators have direct confounder effect with SVA, respectively, and when analyzing with working hours, the effect of working hours is underestimated. Although there was no significance in each individual parameter, it is notable that there is a correlation between the working hour and SVA. The SVA value is the most significant indicator for assessing the sagittal balance as an integrated value of the spinopelvic parameters. The participants in the farmer group who may be considered to have the heavy-duty floor life for a long time had, more severe sagittal imbalance compared with the non-farmers (Fig. 4). From these results, to reduce PDSI, it should be suggested that farmers reduce their working hours in a sitting or squatting position and change to a standing lifestyle.
The MMSE score was also lower in the farmer group than in the non-farmer group. Failure to balance can result in not only pain, but also a decrease in forward-looking ability, which lead to social interaction [13]. It is notable that the treatment of sagittal imbalance in the farmer group should be considered to not only pain, but also disability or function.

Limitation

This study has some limitations. Due to the characteristics of the cross-sectional and observational study, we could not clarify the causal relationship between measured indicators and agriculture. Although indicators were found to differ between the two groups, further follow-up studies are necessary to ascertain the causal relationship of whether the farmer group is the only factor affecting each indicator difference.
The method of checking annual working hours through telephone surveys can be biased in some ways. Memory-dependent assessments of elderly may not be accurately investigated, and it is difficult to reflect consistency or continuity of working hours. If the squatting posture during the day except for working hours was analyzed in the two groups, the confounder of the daily life pattern might be excluded, but there may be bias due to insufficient investigation of these parts. Nevertheless, the daily sedentary life pattern is generally not considered to be different between participants, so this study focusing on working hours in a deep squatting posture is pertinent.
There is no model or findings that could fully demonstrate the understanding of how the squatting posture advances sagittal imbalance. Further biomechanical research would be necessary, such as disc degeneration and difference of axial loading point during squatting position to determine the effect of SVA and loss of lordosis.

CONCLUSION

Sagittal imbalance and back pain were worse in the Korean elderly farmers compared with those in non-famers. Longer working hours of agricultural workers resulted in higher SVA. These findings showed the long hours spent in the crouched posture while performing agricultural work was a risk factor for severe sagittal imbalance. To reduce PDSI, it should be suggested that farmers reduce their working hours in a sitting or squatting position and change to a standing lifestyle.

Notes

No potential conflict of interest relevant to this article was reported.

INFORMED CONSENT

Informed consent was obtained from all individual participants included in this study.

AUTHOR CONTRIBUTIONS

Conceptualization : BJM, JKL

Data curation : JHH

Formal analysis : BJM

Funding acquisition : JKL

Methodology : BJM

Project administration : BJM

Visualization : SKL

Writing - original draft : JHH, BJM

Writing - review & editing : MSH, JHH

References

1. Ailon T, Smith JS, Shaffrey CI, Lenke LG, Brodke D, Harrop JS, et al. Degenerative spinal deformity. Neurosurgery 77 Suppl. 4:S75–S91. 2015.
crossref
2. Ames CP, Scheer JK, Lafage V, Smith JS, Bess S, Berven SH, et al. Adult spinal deformity: epidemiology, health impact, evaluation, and management. Spine Deform. 4:310–322. 2016.
crossref
3. Battaglia PJ, Maeda Y, Welk A, Hough B, Kettner N. Reliability of the Goutallier classification in quantifying muscle fatty degeneration in the lumbar multifidus using magnetic resonance imaging. J Manipulative Physiol Ther. 37:190–197. 2014.
crossref
4. Bess S, Line B, Fu KM, McCarthy I, Lafage V, Schwab F, et al. The health impact of symptomatic adult spinal deformity: comparison of deformity types to United States population norms and chronic diseases. Spine (Phila Pa 1976). 41:224–233. 2016.
5. Cho NH, Jung YO, Lim SH, Chung CK, Kim HA. The prevalence and risk factors of low back pain in rural community residents of Korea. Spine (Phila Pa 1976). 37:2001–2010. 2012.
crossref
6. Claus A, Hides J, Moseley GL, Hodges P. Sitting versus standing: does the intradiscal pressure cause disc degeneration or low back pain? J Electromyogr Kinesiol. 18:550–558. 2008.
crossref
7. Department of Economic and Social Affairs United Nations : World population ageing, 1950-2050. New York: United Nations;2002.
8. Glassman SD, Berven S, Bridwell K, Horton W, Dimar JR. Correlation of radiographic parameters and clinical symptoms in adult scoliosis. Spine (Phila Pa 1976). 30:682–688. 2005.
crossref
9. Goutallier D, Postel JM, Bernageau J, Lavau L, Voisin MC. Fatty muscle degeneration in cuff ruptures. Pre- and postoperative evaluation by CT scan. Clin Orthop Relat Res. (304):78–83. 1994.
10. Kado DM, Prenovost K, Crandall C. Narrative review: hyperkyphosis in older persons. Ann Intern Med. 147:330–338. 2007.
crossref
11. Kim KT, Lee SH, Suk KS, Lee JH, Im YS, Seo EM. Loss of sagittal balance and clinical outcomes following corrective osteotomy for lumbar degenerative kyphosis. J Korean Orthop Assoc. 44:83–92. 2009.
crossref
12. Kim MJ, Ahn KY, Jeon YJ. Association of type of physical activity and sedentary time with lower back pain in Korean above 50 years : Korean National Health and Nutrition Examination Survey VI 2014. Korean Soc Sports Sci. 25:1107–1120. 2016.
13. Le Huec JC, Faundez A, Dominguez D, Hoffmeyer P, Aunoble S. Evidence showing the relationship between sagittal balance and clinical outcomes in surgical treatment of degenerative spinal diseases: a literature review. Int Orthop. 39:87–95. 2015.
crossref
14. Lee CH, Chung CK, Jang JS, Kim SM, Chin DK, Lee JK. 'Lumbar degenerative kyphosis' is not byword for degenerative sagittal imbalance: time to replace a misconception. J Korean Neurosurg Soc. 60:125–129. 2017.
crossref
15. Lee CH, Chung CK, Kim CH, Kwon JW. Health care burden of spinal diseases in the Republic of Korea: analysis of a nationwide database from 2012 through 2016. Neurospine. 15:66–76. 2018.
crossref
16. Lee CS, Kim YT, Kim E. Clinical study of lumbar degenerative kyphosis. J Korean Soc Spine Surg. 4:27–35. 1997.
17. Lee SH, Kim KT, Suk KS, Lee JH, Seo EM, Huh DS. Sagittal decompensation after corrective osteotomy for lumbar degenerative kyphosis: classification and risk factors. Spine (Phila Pa 1976). 36:E538–E544. 2011.
18. Mueller G, Morlock MM, Vollmer M, Honl M, Hille E, Schneider E. Intramuscular pressure in the erector spinae and intra-abdominal pressure related to posture and load. Spine (Phila Pa 1976). 23:2580–2590. 1998.
crossref
19. Protopsaltis T, Schwab F, Bronsard N, Smith JS, Klineberg E, Mundis G, et al. TheT1 pelvic angle, a novel radiographic measure of global sagittal deformity, accounts for both spinal inclination and pelvic tilt and correlates with health-related quality of life. J Bone Joint Surg Am. 96:1631–1640. 2014.
crossref
20. Roussouly P, Gollogly S, Berthonnaud E, Dimnet J. Classification of the normal variation in the sagittal alignment of the human lumbar spine and pelvis in the standing position. Spine (Phila Pa 1976). 30:346–353. 2005.
crossref
21. Roussouly P, Pinheiro-Franco JL. Biomechanical analysis of the spinopelvic organization and adaptation in pathology. Eur Spine J 20 Suppl. 5(Suppl 5):609–618. 2011.
crossref
22. Ryu DS, Shinn JK, Kim BW, Moon BJ, Ha Y, Lee JK, et al. Prospective observational cohort study of health-related quality of life: marked adult sagittal deformity (ASD) in comparison with mild to moderate ASD. Spine (Phila Pa 1976). 44:1723–1730. 2019.
crossref
23. Takemitsu Y, Harada Y, Iwahara T, Miyamoto M, Miyatake Y. Lumbar degenerative kyphosis. Clinical, radiological and epidemiological studies. Spine (Phila Pa 1976). 13:1317–1326. 1988.
24. Taneichi H. Update on pathology and surgical treatment for adult spinal deformity. J Orthop Sci. 21:116–123. 2016.
crossref
25. Terran J, Schwab F, Shaffrey CI, Smith JS, Devos P, Ames CP, et al. The SRS-Schwab adult spinal deformity classification: assessment and clinical correlations based on a prospective operative and nonoperative cohort. Neurosurgery. 73:559–568. 2013.
26. Yip YB, Ho SC, Chan SG. Identifying risk factors for low back pain (LBP) in Chinese middle-aged women: a case-control study. Health Care Women Int. 25:358–369. 2004.
crossref

Fig. 1.
Definitions of each radiologic parameter. The angle between the lines from the centroid of T1 to the femoral head axis and from the femoral axis to the middle of the S1 endplate. T1PA : T1 pelvic angle.
jkns-2020-0096f1.tif
Fig. 2.
Occupation of participants. There were 46 farmers and 50 non-farmers. Non-agricultural occupations consisted of 24 housewives, 11 self-employed, 8 office workers, and 7 others.
jkns-2020-0096f2.tif
Fig. 3.
A photograph showing female farmers working in a crouched posture on the ground in a farm in Korea. This photograph is courtesy of Korea Agency of Education, Promotion and Information Service in Food, Agriculture, Forestry and Fisheries.
jkns-2020-0096f3.tif
Fig. 4.
The whole-body X-rays of two participants with different working hours and degrees of sagittal imbalance. A : Working hour, 450 hour-years; SVA, 18.7 cm. B : Working hour, 250 hour-years; SVA, 5.2 cm. SVA : sagittal vertical axis.
jkns-2020-0096f4.tif
Table 1.
Demographics of the farmer and non-farmer groups
Farmer (n=46) Non-farmer (n=50) p-value
Age (years) 72.85±4.23 70.10±4.13 0.001
Female (%) 76.0 86.0 0.214
Height (cm) 154.04±7.55 156.42±7.28 0.120
Weight (kg) 56.74±10.51 59.84±8.86 0.121
BMI (kg/m2) 23.82±3.96 24.42±2.98 0.204
Lumbar BMD -1.74±0.90 -1.64±0.86 0.607
Compression fracture 15 (32.6) 13 (26.0) 0.508
Working hour* (hour-years) 270±139 0

Values are presented as mean±standard deviation or number (%). *Working hour, flexed position on the ground, and 35 participants surveyed. BMI : body mass index, BMD : bone mineral density

Table 2.
Comparison of radiological parameters on sagittal alignment between the farmer and non-farmer groups
Farmer (n=46) Non-farmer (n=50) p-value
SVA (cm) 14.16±6.13 9.96±5.42 0.001*
TK (º) 24.16±16.85 33.27±24.22 0.034
T1PA (º) 37.84±13.37 28.29±13.10 0.004*
LL (º) 20.05±19.43 30.71±19.92 0.009*
PI (º) 58.11±11.74 55.00±11.01 0.184
PT (º) 31.65±11.00 24.82±11.89 0.004*
SS (º) 26.61±14.45 30.12±9.35 0.157
PI–LL (º) 38.06±21.31 24.29±22.53 0.003*
TCSA MF 704.84±193.60 744.32±233.51 0.375
TCSA ES 1746.31±1317.09 1559.48±340.83 0.335
TCSA PS 2328.51±505.96 2384.20±417.71 0.559
Goutallier MF 2.18±0.83 2.45±0.98 0.154
Goutallier ES 2.00±0.80 2.12±0.98 0.518
Goutallier PS 2.04±0.74 2.20±0.93 0.371

* p<0.01.

p<0.05.

Invalid data excluded, 28 farmers and 41 non-farmers.

SVA : sagittal vertical axis, TK : thoracic kyphosis, T1PA : T1 pelvic angle, LL : lumbar lordosis, PI : pelvic incidence, PT : pelvic tilt, SS : sacral slope, TCSA : total cross-sectional area, MF : multifidus muscle, ES : erector spinae muscle, PS : psoas muscle

Table 3.
Multivariate regression analysis between the working hours and radiological parameters on sagittal alignment of the farmer group
Farmer (n=35)
β±SE p-value
SVA 0.019±0.007 0.014*
TK 0.008±0.023 0.725
T1PA 0.024±0.019 0.219
LL -0.04±0.023 0.096
PI -0.016±0.015 0.309
PT -0.014±0.013 0.313
SS -0.001±0.018 0.958
PI–LL 0.024±0.028 0.390

* p<0.05.

Invalid data excluded, 28 farmers and 41 non-farmers.

SE : standard error, SVA : sagittal vertical axis, TK : thoracic kyphosis, T1PA : T1 pelvic angle, LL : lumbar lordosis, PI : pelvic incidence, PT : pelvic tilt, SS : sacral slope

Table 4.
Comparison of HRQOL between the farmer and non-farmer groups
Farmer (n=46) Non-farmer (n=50) p-value
VAS back 8.26±2.27 6.96±2.44 0.008*
VAS leg 7.15±2.69 6.44±2.72 0.201
SF-36 PCS 31.83±12.92 38.06±14.24 0.027
SF-36 MCS 45.09±14.48 48.97±16.62 0.227
ODI 23.50±7.73 19.12±6.24 0.003*
MMSE 24.85±3.77 26.98±2.47 0.002*

* p<0.01.

HRQOL : health-related quality of life, VAS : visual analogue scale, SF-36 : Short Form-36, PCS : Physical Component Summary, MCS : Mental Component Summary, ODI : Oswestry Disability Index, MMSE : Mini-Mental State Exam

Table 5.
Comparison of laboratory tests between the farmer and non-farmer groups
Farmer (n=46) Non-farmer (n=50) p-value
Total cholesterol 199.61±42.56 198.26±48.67 0.886
TG 133.25±95.17 136.34±108.83 0.883
HDL 56.13±14.32 57.78±12.94 0.555
HbA1c 5.74±0.56 5.92±1.24 0.367
RF 4.40±4.86 7.43±13.36 0.140
Vitamin D 23.80±8.02 21.23±8.43 0.131
PTH 46.56±19.19 40.38±20.27 0.132
CTX 0.42±0.20 0.42±0.26 0.971
Osteocalcin 21.04±8.17 20.45±7.87 0.723

TG : triglyceride, HDL : high-density lipoprotein, HbA1c : hemoglobin A1c, RF : rheumatoid factor, PTH : parathyroid hormone, CTX : C-terminal telopeptide

TOOLS
Similar articles