Journal List > J Korean Neurosurg Soc > v.63(5) > 1160881

Jung, Jang, Ko, Choi, Nam, Kwon, and Park: Relationship between Increased Intracranial Pressure and Mastoid Effusion

Abstract

Objective

This study aimed to assess the relationship between increased intracranial pressure (ICP) and mastoid effusions (ME).

Methods

Between January 2015 and October 2018, patients who underwent intracranial surgery and had ICP monitoring catheters placed were enrolled. ICP was recorded hourly for at least 3 days. ME was determined by the emergence of opacification in mastoid air cells on follow-up brain imaging. C-reactive protein (CRP) levels, presence of endotracheal tube (ETT) and nasogastric tube (NGT), duration of intensive care unit (ICU) stay, duration of mechanical ventilator application, diagnosis, surgical modalities, and presence of sinusitis were recorded. Each factor’s effect on the occurrence of ME was analyzed by binary logistic regression analyses. To analyze the independent effects of ICP as a predictor of ME a multivariable logistic regression analysis was performed.

Results

Total of 61 (53%) out of 115 patients had ME. Among the patients who had unilateral brain lesions, 94% of subject (43/50) revealed the ipsilateral development of ME. ME developed at a mean of 11.1±6.2 days. The variables including mean ICP, peak ICP, age, trauma, CRP, ICU stays, application of mechanical ventilators and presence of ETT and NGT showed statistically significant difference between ME groups and non-ME groups in univariate analysis. Sex and the occurrence of sinusitis did not differ between two groups. Adding the ICP variables significantly improved the prediction of ME in multivariable logistic regression analysis.

Conclusion

While multiple factors affect ME, this study demonstrates that ICP and ME are probably related. Further studies are needed to determine the mechanistic relationship between ICP and middle ear pressure.

INTRODUCTION

Mastoid effusions (ME) or middle ear effusions are a morbidity related to treatment in an intensive care unit (ICU). ME is encountered frequently as an incidental finding on brain imaging in post-neurosurgical patients in the neuro-ICU. Some reports have pointed to a relationship between ME and disorders of consciousness [6,17], with others arguing that this relationship is mediated by intracranial pressure (ICP) [10,13,14]. Known risk factors associated with ME include advanced age, prolonged endotracheal intubation, mechanical ventilation, nasogastric tube (NGT), altered consciousness, sedation, a prolonged ICU stay, the use of antibiotics, radiographic opacification of sinus [6,11,15,17,18]. Eustachian tube dysfunction, mucociliary dysfunction, increased mucus viscosity, and pathogens that migrate from the Eustachian tube into the middle ear have been identified as potential causes of ME [6,7]. Endotracheal tubes (ETTs) and NGTs, which are foreign bodies, may contribute to Eustachian tube dysfunction or act as pathogen sources in the oropharynx [11,17].
Until now, there have been no reports on the relationship between directly measured ICP and ME. In the present study, we sought to reveal the relationship between ICP and ME in a large cohort of patients being treated in the neuro-ICU.

MATERIALS AND METHODS

This study was performed according to the principles outlined in the Declaration of Helsinki and was approved by the Institutional Review Board of Chung-Ang University Hospital (IRB No. 1906-004-16266). From January 2015 to October 2018, the patients who underwent intracranial surgery and ICP monitoring device placement were enrolled. A total of 115 patients met the inclusion criteria. ICP was recorded hourly for at least 3 days. Head computer tomography (CT) scans or magnetic resonance imaging (MRI) at the time of admission and at least once a week subsequently to surgery were obtained. Temporal bone or facial bone fractures at admission, a prior history of skull base surgery (i.e., trans-mastoid surgery, history of sinonasal malignancy, etc.) and death within three days post-surgery were exclusion criteria. The mean age of the study participants was 58.1±15.0 (range, 22–88). Male patients were 65 (56.5%) and female patients were 50 (43.5%).
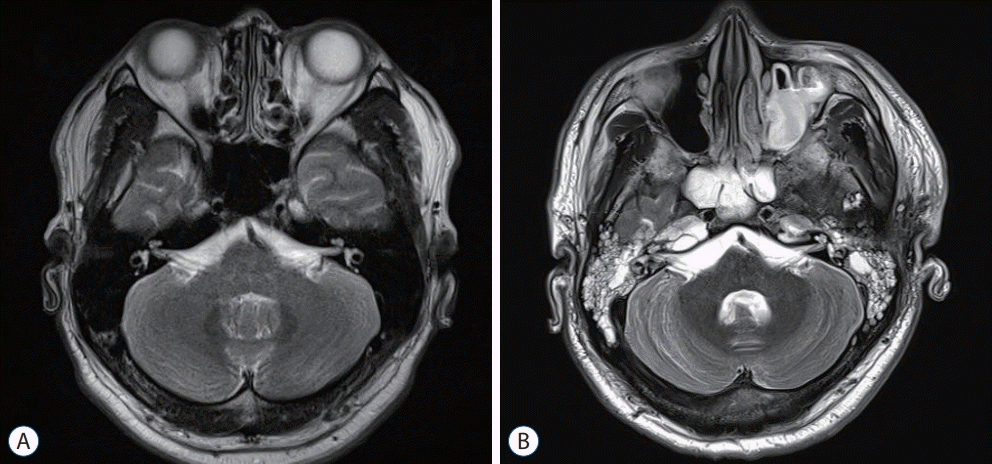
The presence of ME was radiologically determined by opacification of the mastoid air cell cavity. More specifically, a remarkable absence of aeration or air-fluid level of the mastoid air cell on CT imaging indicated ME. On MR images, high signal intensity of T2 or T2 fluid-attenuated inversion recovery (FLAIR) imaging in the mastoid air cell cavity indicated ME (Fig. 1) [12,22]. Two independent reviewers confirmed these diagnoses.
Using the criteria outlined above, we compared the initial imaging and follow up imaging of all patients. A combination of CT, T2- and T2 FLAIR-weighted images were used when available. Aggravation of ME was indicated by an obvious change between the initial and follow-up images. Laterality of ME was checked and categorized into unilateral (left or right side only) and bilateral side.
ICP monitoring probes (Spiegelberg Gmb H & C.’s, Hamburg, Germany) were placed into the brain parenchyma, subdural space, or cerebral ventricles, depending on the surgical pathologies and modalities used. There were 17 cases with intraventricular probes and 98 cases with subdural or parenchymal probes. According to the place of the ICP probes the measured ICP and development of ME was illustrated as a Supplementary Table 1. Catheters were usually indwelled for 5 to 7 days after surgery, in accordance with the patient’s condition. ICP values were recorded hourly. Daily mean ICP and daily peak ICP during the monitoring period were recorded. Maximum C-reactive protein (CRP) levels between post-operative days 4 and 7 were noted. The CRPs on the first postoperative day were designated as baseline. The presence of an ETT, NGT, the duration of ICU stays, and the duration of mechanical ventilation were all reviewed for group-wise differences. The initial presence of sinusitis was determined by reviewing initial imaging. We categorized patients’ diagnoses as trauma, aneurysmal subarachnoid hemorrhage (SAH), intracerebral hemorrhage (ICH) or intraventricular hemorrhage (IVH), malignant cerebral infarction, or others. Cases were simply defined as traumatic or non-traumatic. Laterality of the brain lesion was noted (left or right side) in case of supratentorial trauma, ICH, and malignant infarction. Aneurysmal SAH, IVH and infra-tentrorial lesions were regarded as bilateral lesion, because these pathologies were thought to increase ICP globally. Ipsilateral or contralateral aggravation of ME was checked by comparing laterality of ME with laterality of brain lesion. The surgical modality was categorized as a craniostomy, craniotomy, or craniectomy.
Pearson’s chi-square tests and student’s t-tests were used to test differences between categorical and continuous variables, respectively. For non-normally distributed variables, Mann-Whitney U tests were used instead. For categorical variables, data were expressed as numbers and percentages, and chi-squared tests were performed to compare proportions of the sample represented by the mastoid effusion-occurred group and the non-occurred group. Receiver operating characteristic curve analyses were performed to estimate the prediction accuracy of continuous values for the occurrence of ME. A cutoff value was selected to maximize the sum of sensitivity and specificity. Binary logistic regression analyses were performed to analyze the effect of each clinical measurement on the occurrence of ME. To analyze the independent effect of ICP as a predictor of ME, multivariable logistic regression analyses were performed using a backward stepwise procedure as the variable selection method to minimize Akaike Information Criterion. Three models were named model A, B and C to perform this statistical analysis. Model A included sex, trauma, operation method, CRP, ICU stay and presence of ETT and NGT whereas excluded mean ICP and peak ICP. In model B and model C, mean ICP and peak ICP were fixed variable and other variables in model A were eliminated backward step, respectively. Prediction performance was estimated by several measures including the area under the curve (AUC), sensitivity, or specificity. In addition, Net Reclassification Improvement (NRI) and Integrated Discrimination Improvement (IDI) were used to estimate prediction improvements, as determined by ICP values. Though the AUC is the most common tool for quantifying the incremental value of a new predictor, there is concern that the AUC is insensitive and does not demonstrate the value of new markers that are useful for prediction. NRI and IDI has been proposed as alternatives to the increase in the AUC for evaluating improvement in the performance of assessment by the addition of new factors [20]. NRI is considered as more predicitive than AUC when the change of magnitude is small in a new model as compared to an old model and IDI test appears to be more powerful than the AUC [16]. R language version 3.3.3 (R Foundation for Statistical Computing, Vienna, Austria) and T&F program ver. 3.0 (YooJin BioSoft, Seoul, Korea) were used for all statistical analyses.

RESULTS

Factors affecting the development of ME

Of the 115 patients assessed here, ME was confirmed in 61 (53%) at a mean of 11.1±6.2 postoperative days. The ME group was, on average, older than the non-ME group (62.2±15.6 vs. 56.4±14 years; p=0.04). Trauma was diagnosed in 30 patients (26.1%), while 85 (73.9%) were non-traumatic. Non-trauma case findings included aneurysmal SAH (n=31, 27%), ICH or IVH (n=39, 33.9%), cerebral infarction (n=12, 10.4%), and other pathologies (n=3, 2.6%). ME developed more frequently in trauma patients (21 out of 30 patients, 70%) than in non-trauma patients (40 out of 85 patients, 47%) (p=0.03). ME due to surgical procedures occurred in 10/17 (58.8%) craniostomy cases, 15/43 (34.9%) craniotomy cases, and 36/55 (65.5%) craniectomy cases. ME developed most frequently in craniectomy patients (p=0.009, Table 1).
Of the patients of ME group, bilateral development of ME was 39/61 (63.9%) and unilateral development of ME was 22/61 (26.1%). Thirty three out of the 39 bilateral ME patients had unilateral brain lesion. Of the 22 unilateral ME development group, five patients had bilateral brain lesions, 14 had same sied brain lesions with ME side and three had opposite side brain lesions. Among the 50 patients with unilateral brain lesion, 47 patients showed same side ME aggravation (94%).
There were statistically significant differences in mean ICP and peak ICP values between the two groups; the ME group had significantly higher mean ICP (18.5±9.2 vs. 13.7±5.7 mmHg; p<0.001) and peak ICP (20±9.8 vs. 14.7±6.4 mmHg; p<0.001) levels. CRP was higher in the ME group than in the non-ME group (173.4±102.3 vs. 98.7±72.5; p<0.001). The duration of ICU stays was longer in the ME group than in the non-ME group (31.7±33 vs. 13.1±10.9 days; p<0.001). The duration of mechanical ventilation was longer in the ME group than in the non-ME group (15.9±23.1 vs. 4.0±8.1; p<0.001). ETT and NGT were more frequent in the ME group than in the non-ME group (57/79, 72.1% vs. 22/79, 27.9% and 51/75, 68% vs. 24/75, 32%, respectively; p<0.001). The presence of sinusitis was similar between the ME and non-ME groups (p=0.207) (Table 1). When the patients were divided as traumatic causes and non-traumatic causes (Table 2), age was older in the trauma group. In trauma patients bilateral ME developed in 66.7% (14/21) compared to 62.5% (25/40) in the non-trauma patients. This difference is not statistically significant. The mean and peak ICP, baseline CRP levels, ICU stay duration, mechanical ventilator applied duration and presence of ETT or NGT were not differen between two groups. Follow-up CRP was significantly high in the trauma group (Table 2). Within each group, the baseline CRPs were not diffent between ME development and non-development groups (Table 3).
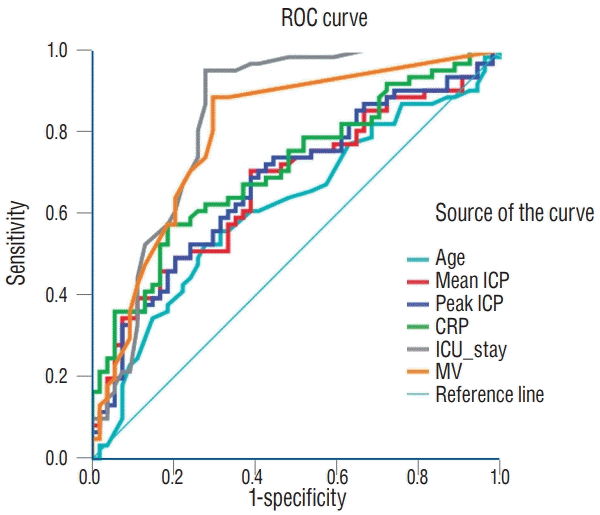
To estimate prediction accuracy of the significant continuous variables (age, ICP, CRP, ICU stay length, and duration of ventilator use) for the occurrence of ME, a cutoff value was selected to maximize the sum sensitivity and specificity values using a ROC curve approach. ICU stay and ventilator use duration had the largest area, with mean ICP and peak ICP also demonstrating significance (Fig. 2).

Increased ICP and ME

To analyze the independent effect of ICP, multivariable logistic regression analyses were performed using a backward stepwise procedure. With model A, which included sex, trauma, operative method, CRP, ICU stay duration, and use of an ETT or NGT but not mean ICP or peak ICP, estimation prediction was significant (AUC, 0.908; 95% confidence interval [CI], 0.856–0.96; p<0.001). With model B, which included mean ICP as a fixed variable and eliminated the other variables from model A with a backward step approach, estimation prediction was also significant (AUC, 0.923; 95% CI, 0.877–0.968; p<0.001). When mean ICP increased by 1 cmH2O, ME rates increased by 11.3%. With model C, in which peak ICP was a fixed variable and the other variables in model A were eliminated using a backward step approach, estimation prediction was also significant (AUC, 0.925; 95% CI, 0.88–0.97; p<0.001). When peak ICP increased by 1 cmH2O, ME rates increased by 11.4% (Tables 4 and 5).
A comparison of AUCs for model B and C with model A revealed an insignificant difference (p=0.158 and p=0.103; Table 5). The p-value of model B (adding a mean ICP) was 0.025 by NRI measurement and 0.055 by IDI measurement. The p-value of model C (adding a peak ICP) was 0.033 by NRI measurement and 0.041 by IDI measurement (Table 6), which showed that addition of the peak ICP variable could improve in predicting of ME development.

DISCUSSION

ICP and ear pressure

High occurrences of ME have been reported in ICU patients, with rates ranging from 10.3% to 51.4% [6,15,17]. Patients included in these studies were neurological ICU patients. However, authors pointed out swallowing impairments, NGT, ETT or prolonged mechanical ventilation as a significant causing factor [6,11,18]. They did not considered severity of neurological status as a factor for development of ME except one report, which revealed that altered consciousness was significantly related to development of ME [17]. In the present study, 53% (61/115) of patients with ICP monitoring had ME. In the group with ME, peak ICP and mean ICP was significantly higher than in the group without ME. We assumed that ICP factor might contribute to the development of ME, from the result that the present study showed higher incidence of development of ME than previous studies. Because patients enrolled in our study underwent intracranial surgery, which meant they were exposed to higher ICP than other neurological ICU patients.
It is known that in humans ICP changes are transmitted to the inner ear [3,4]. Beentjes [3] noticed that rapid increases in cerebro-spinal fluid (CSF) pressure resulted in elevated perilymphatic and endolymphatic pressures which was thought as a role of the cochlear duct. Carlborg et al. [5] showed no pressure difference between perilymph and CSF pressure and Marchbanks et al. [19] reported after vetnriculo/lumbar-peritoneal shunt placement, abnormal perilymphatic pressure was relieved. In an experimental study, it was revealed that the onset of an inner ear pressure change following manipulation of ICP was immediate without a measurable time lag, and equalized within a few seconds [23].
About the relationship between ICP and middle ear pressure, ICP appears a driver for spontaneous tympanic membrane displacement (TMD) in humans [8]. Pathologic tympanometry was reported to be related to mortality in comatose children with nontraumatic brain pathologies [13]. In some patients the degree of TMD was correlated with ICP, which were measured by lumbar puncture manometry [14].
Considering the rapid pressure and fluid balance between intracranim and inner ear, and pressure transmission from intracranium to middle ear cavity, the results of our study, the influence of increased intracranial pressure (IICP) on development of ME seems not exceptional. We are not sure how IICP contributes to inflammatory reactions of middle ear, nevertheless, abrupt IICP may affect on the environment of fluid or pressure balance of inner ear and subsequently on middle ear aeration.
The laterality or bilaterality of ME shows us a hint about a relation of ICP with the development of ME. Several cases of ME have been reported in which unilateral ME occurred on the same side with the thrombosed sinus and bilateral transverse sinus thrombosis presented with bilateral ME [1,9]. These authors suggested that the ME may have developed due to mucosal edema and effusion resulting from venous congestion. In our study 94% of subject (43/50) revealed the same side development of ME according to patient’s brain lesion and the development of bilateral ME was 39/61 (63.9%). These results made us conjecture that the unfavorable pressure conditions rather than a focal mechanical obstruction like an Eustachina tube dysfuntion could more attribute to develop mastoid opacification. When we utilized a multivariate logistic regression analysis approach to demonstrate that the use of peak ICP improved predictive power with regards to predicting the development of ME.

Trauma and CRP in the development of ME

In the present study we found that CRP levels significantly related to the occurrence of ME. However, sinusitis was unrelated to ME. Most studies of ME indicate that ME is not related to fever, not increased in immunocompromised patients, and that fluid from the middle ear is in fact sterile [1,9,15,17].
CRP is a non-specific indicator of inflammation, which is increased by inflammation, infection, trauma, necrosis, malignancy, and allergic reactions. Its concentration can increase by 6 hours and peak at 48 hours. Trauma group showed more development of ME compared to non-trauma group. As shown in Table 3, between two groups follow-up CRP, which was measured between 4th and 7th postoperative day, was a significantly different factor. The baseline CRP, which was measured on the first postoperative day, was not significantly different between trauma and non-trauma group. ICP, duration of ICU stay, duration of ventilator application, the presence of ETT or NGT did not show meaningful difference. We had excluded the patients with temporal bone or facial bone fractures at admission or with a prior history of skull base surgery (i.e., trans-mastoid surgery, history of sinonasal malignancy, etc.). The impact of head trauma might affect the pressure balance of ear structures or trauma related inflammatory reaction could be an additional factor for development of ME.

Relation between ICP and ear pressure in view of potential clinical application

Mastoid air cells are contiguous with the middle ear cavity via the aditus to the mastoid antrum [2]. They seem to buffer against abnormal pressure in the middle ear. Marchbanks et al. [19] measured perilymphatic pressure with TMD techniques [8] and suggested their use for non-invasive serial monitoring of ICP changes. Reid et al. [21] later noted differences in TMD between patients with increased ICP and those with normal ICP. Raised ICP causes inward motion (negative measurement) of the tympanic membrane and low ICP causes outward motion. In their study the TMD was more negative in comatose children than in normal ones. In some patients the degree of TMD was correlated with ICP which were measured by lumbar puncture manometry. They suggested that this method had a potential utility in monitoring ICP in a variety of clinical circumstances [14]. The cochlear microphonic potential (CM7) is a voltage that results from sound-induced currents flowing at the frequency of a sound stimulus through the transduction ion channels of auditory sensory cells. With a near 1000 Hz sound stimulation CM is detected non-invasively between a gold-coated electrode inserted in the external acoustic meatus and skin electrodes pasted on the forehead. The time courses of CM phase and invasive ICP showed close similarity. However the authors suggested that the patients who stay longer in ICU and who have middle ear effusion would not be proper to be monitored with this method because intact middle ear was prerequisite.
Our results of increased ICP as a contributor to ME development can be an additional report to support the relationship between middle ear pressure and ICP.
There are some limitations to apply our results to support the relationships between increased ICP and development of ME. First, this is a retrospective study so that we could not control the condition of study groups. There are known factors of developing ME (CRP, ICU stays, NGT, ETT, and duration of mechanical ventilation), revealing same result in the present study. Also, controlled analysis between trauma group and non-trauma group should be performed to obtain reliability to our study. Secondly, significance of ICP variables in this study is vague. Peak ICP in our study revealed additional prediction value in development of ME. Mean ICP revealed borderline significance. Abrupt high pressure exposure to ears could be a more disturbing factor to the pressure balance or ventilation system. To clarify the role of ICP on ME development, homogeneous and controlled clinical groups (trauma only vs. non-trauma only) would be more proper and prospective measurements of the variables would be more reliable.

CONCLUSION

Increased ICP may contribut to the development of ME. Further study is required, however, to fully understand the relationship between middle ear pressure and ICP.

Notes

No potential conflict of interest relevant to this article was reported.

INFORMED CONSENT

This type of study does not require informed consent.

AUTHOR CONTRIBUTIONS

Conceptualization : YP

Data curation : YP, HJ

Formal analysis : HJ, MJK

Methodology : HJ, HHC

Project administration : YP, TKN

Visualization : KMJ

Writing - original draft : HJ

Writing - review & editing : YP, JTK

Supplementary Materials

The online-only data supplement is available with this article at https://doi.org/10.3340/jkns.2020.0067.

Supplementary Table 1.

Rate of mastoid effusion development and intracranial pressure according to the location of pressure monitoring probes
jkns-2020-0067-suppl.pdf

References

1. Agid R, Farb RI. Mastoid effusion associated with dural sinus thrombosis. Eur Radiol. 15:755–758. 2005.
crossref
2. Alper CM, Kitsko DJ, Swarts JD, Martin B, Yuksel S, Cullen Doyle BM, et al. Role of the mastoid in middle ear pressure regulation. Laryngoscope. 121:404–408. 2011.
crossref
3. Beentjes BI. The cochlear aqueduct and the pressure of cerebrospinal and endolabyrinthine fluids. Acta Otolaryngol. 73:112–120. 1972.
crossref
4. Carlborg B, Densert B, Densert O. Functional patency of the cochlear aqueduct. Ann Otol Rhinol Laryngol. 91(2 Pt 1):209–215. 1982.
crossref
5. Carlborg B, Densert O, Stagg J. Perilymphatic pressure in the cat. Description of a new method for study of inner ear hydrodynamics. Acta Otolaryngol. 90:209–218. 1980.
crossref
6. Cavaliere F, Masieri S, Liberini L, Proietti R, Magalini SI. Tympanometry for middle-ear effusion in unconscious ICU patients. Eur J Anaesthesiol. 9:71–75. 1992.
7. Christensen L, Schaffer S, Ross SE. Otitis media in adult trauma patients: incidence and clinical significance. J Trauma. 31:1543–1545. 1991.
8. El-Bouri WK, Vignali D, Iliadi K, Bulters D, Marchbanks RJ, Birch AA, et al. Quantifying the contribution of intracranial pressure and arterial blood pressure to spontaneous tympanic membrane displacement. Physiol Meas. 39:085002. 2018.
crossref
9. Fink JN, McAuley DL. Mastoid air sinus abnormalities associated with lateral venous sinus thrombosis: cause or consequence? Stroke. 33:290–292. 2002.
crossref
10. Giraudet F, Longeras F, Mulliez A, Thalamy A, Pereira B, Avan P, et al. Noninvasive detection of alarming intracranial pressure changes by auditory monitoring in early management of brain injury: a prospective invasive versus noninvasive study. Crit Care. 21:35. 2017.
crossref
11. González Pena M, Figuerola Massana E, Hernández Gutiérrez P, Rello Condomines J. Middle ear effusion in mechanically ventilated patients: effects of the nasogastric tube. Respir Care. 58:273–278. 2013.
crossref
12. Gossner J. Fluid signal in the mastoid is a common incidental finding on MRI of the brain. Eur Arch Otorhinolaryngol. 276:611–612. 2019.
crossref
13. Gwer S, Chengo E, Newton CR, Kirkham FJ. Unexpected relationship between tympanometry and mortality in children with nontraumatic coma. Pediatrics. 132:e713–e717. 2013.
crossref
14. Gwer S, Sheward V, Birch A, Marchbanks R, Idro R, Newton CR, et al. The tympanic membrane displacement analyser for monitoring intracranial pressure in children. Childs Nerv Syst. 29:927–933. 2013.
crossref
15. Huyett P, Raz Y, Hirsch BE, McCall AA. Radiographic mastoid and middle ear effusions in intensive care unit subjects. Respir Care. 62:350–356. 2017.
crossref
16. Kerr KF, McClelland RL, Brown ER, Lumley T. Evaluating the incremental value of new biomarkers with integrated discrimination improvement. Am J Epidemiol. 174:364–374. 2011.
crossref
17. Kesser BW, Woodard CR, Stowell NG, Becker SS. Middle ear effusion in adult ICU patients: a cohort study. Ear Nose Throat J. 92:340–346. 2013.
crossref
18. Lin CC, Lin CD, Cheng YK, Tsai MH, Chang CS. Middle ear effusion in intensive care unit patients with prolonged endotracheal intubation. Am J Otolaryngol. 27:109–111. 2006.
crossref
19. Marchbanks RJ, Reid A, Martin AM, Brightwell AP, Bateman D. The effect of raised intracranial pressure on intracochlear fluid pressure: three case studies. Br J Audiol. 21:127–130. 1987.
crossref
20. Pencina MJ, D'Agostino RB Sr, Demler OV. Novel metrics for evaluating improvement in discrimination: net reclassification and integrated discrimination improvement for normal variables and nested models. Stat Med. 31:101–113. 2012.
crossref
21. Reid A, Marchbanks RJ, Burge DM, Martin AM, Bateman DE, Pickard JD, et al. The relationship between intracranial pressure and tympanic membrane displacement. Br J Audiol. 24:123–129. 1990.
crossref
22. Sayal NR, Boyd S, Zach White G, Farrugia M. Incidental mastoid effusion diagnosed on imaging: are we doing right by our patients? Laryngoscope. 129:852–857. 2019.
crossref
23. Thalen EO, Wit HP, Segenhout JM, Albers FW. Dynamics of inner ear pressure change caused by intracranial pressure manipulation in the guinea pig. Acta Otolaryngol. 121:470–476. 2001.
crossref

Fig. 1.
Magenetic resonance imaging (MRI) of diagnosis of middle ear effusion. A : Initial T2 weight brain MRI before decompressive craniectomy showing air density of the mastoid air cells. B : Three-week follow up MRI of the same patient after surgery. Opacification of bilateral mastoid air cell is noted. This 42-year old man was presented with alterered consciousness due to left middle cerebral artery infarction. Left side craniectomy was done for decompression.
jkns-2020-0067f1.tif
Fig. 2.
Comparison of area under the curves among continuous variables to predict mastoid effusion. ROC : receiver operating characteristic, ICP : intracranial pressure, CRP : C-reactive protein, ICU : intensive care unit, MV : mechanical ventilation.
jkns-2020-0067f2.tif
Table 1.
Characteristics of demographic and clinical variables
Variable Value ME : yes ME : no p-value
Sample No. 115 (100.0) 61 (53.0) 54 (47.0)
Age 62.2±15.6 56.4±14 0.04
Sex 0.19
 Female 50 (43.5) 30 (60.0) 20 (40.0)
 Male 65 (56.5) 31 (47.7) 34 (52.3)
Diagnosis 0.047
 Trauma 30 (26.1) 21 (70.0) 9 (30.0)
 Aneurysmal SAH 31 (27.0) 12 (38.7) 19 (61.3)
 ICH/IVH 39 (33.9) 22 (56.4) 17 (43.6)
 Infarction 12 (10.4) 6 (50.0) 6 (50.0)
 Others 3 (2.6) 0 (0.0) 3 (100.0)
Trauma 0.03
 Non-trauma 85 (73.9) 40 (47.0) 45 (53.0)
 Trauma 30 (26.1) 21 (70.0) 9 (30.0)
Operation 0.009
 Craniostomy 17 (14.8) 10 (58.8) 7 (41.2)
 Craniotomy 43 (37.4) 15 (34.9) 28 (65.1)
 Craniectomy 55 (47.8) 36 (65.5) 19 (34.5)
Mean ICP (cmH2O) 18.5±9.2 13.7±5.7 0.001
Peak ICP(cmH2O) 20.0±9.8 14.7±6.4 <0.001
CRP 173.4±102.3 98.7±72.5 <0.001
ICU stay (days) 31.7±33.0 13.1±10.9 <0.001
Ventilators (days) 15.9±23.1 4.0±8.1 <0.001
Presence of ETT <0.001
 Yes 79 (68.7) 57 (72.1) 22 (27.9)
 No 36 (31.3) 4 (11.1) 32 (88.9)
Presence of NGT <0.001
 Yes 75 (65.2) 51 (68.0) 24 (32.0)
 No 40 (34.8) 10 (25.0) 30 (75.0)
Other sinusitis 0.207
 Yes 32 (27.8) 20 (62.5) 12 (37.5)
 No 83 (72.2) 41 (49.4) 42 (50.6)

Values are presented as mean±standard deviation or number (%). ME : mastoid effusion, SAH : subarachnoid hemorrhage, ICH : intracerebral hemorrhage, IVH : intraventricular hemorrhage, ICP : intracranial pressure, CRP : C-reactive protein, ICU : intensive care unit, ETT : endotracheal tube, NGT : nasogastric tube

Table 2.
Variables in the trauma group and the non-trauma group
Trauma (n=30) Non-trauma (n=85) p-value
ME development 21 (70.0) 40 (47.1) 0.03
Age (years) 65.6 57.4 0.01
Bilateral ME 14/21 (66.7) 25/40 (62.5) 0.69
Mean ICP (cmH2O) 16.8 16 0.65
Peak ICP (cmH2O) 17.9 17.3 0.75
Baseline CRP 27.4±33.1 31.8±51.7 0.67
Follow-up CRP 177.7±92.4 125.1±94.1 0.01
ICU stay (days) 22.7 23.1 0.94
Ventilators (days) 11.2 10.0 0.76
Presence of ETT 22 (73.3) 57 (67.1) 0.52
Presence of NGT 19 (63.3) 56 (65.9) 0.80

Values are presented as mean±standard deviation or number (%). ME : mastoid effusion, ICP : intracranial pressure, CRP : C-reactive protein, ICU : intensive care unit, ETT : endotracheal tube, NGT : nasogastric tube

Table 3.
CRP on the first postoperative day (baseline) and on between 4th and 7th postoperative day (follow-up) in the trauma and in the non-trauma patients
Trauma
p-value Non-trauma
p-value
ME : yes (n=21) ME : no (n=9) ME : yes (n=40) ME : no (n=45)
Baseline CRP 25.7±32.6 31.4±35.9 0.287 36.3±40.5 27.8±60.1 0.454
Follow-up CRP 204.6±80.7 148.2±55.6 0.018 164.5±104.9 90.0±67.0 0.001

Values are presented as mean±standard deviation. CRP : C-reactive protein, ME : mastoid effusion

Table 4.
Result of multivariable binary logistic regression analysis using occurrence of mastoid effusion as response
Variable Model A* Model B Model C
Mean ICP 1.113 (1.018–1.218)
Peak ICP 1.114 (1.024–1.213)
Sex 0.392 (0.111–1.391) 0.284 (0.076–1.063) 0.271 (0.072–1.023)
Trauma 4.160 (1.076–16.091) 4.554 (1.064–19.490) 4.798 (1.084–21.242)
Operation
Craniotomy vs. craniostomy 0.144 (0.023–0.889) 0.095 (0.013–0.715) 0.087 (0.011–0.679)
Craniectomy vs. craniostomy 0.213 (0.037–1.243) 0.129 (0.017–0.995) 0.129 (0.016–1.022)
CRP 1.008 (1.001–1.016) 1.010 (1.002–1.018) 1.010 (1.002–1.018)
ICU stay 1.056 (1.004–1.111) 1.058 (1.003–1.115) 1.062 (1.007–1.119)
Presence of ETT 7.510 (1.834–30.754) 4.912 (1.140–21.172) 4.578 (1.058–19.808)
Presence of NGT 2.572 (0.704–9.399) 3.639 (0.848–15.624) 3.490 (0.814–14.970)

Values are presented as odds ratio (95% CI).

* In a model A, which included sex, trauma, operation method, CRP, ICU stay and presence of ETT and NGT whereas excluded mean ICP and maximal ICP, prediction of estimation was significant (AUC, 0.908; 95% CI, 0.856–0.96; p<0.001).

With a model B, in which mean ICP was a fixed variable and other variables in model A were eliminated backward step. Model B in prediction of estimation was significant (AUC, 0.923; 95% CI, 0.877–0.968; p<0.001). When mean ICP increases as 1, development of ME increases 11.3%.

With a model C, in which peak ICP was a fixed variable and other variables in model A were eliminated backward step. Model C in prediction of estimation was significant (AUC, 0.925; 95% CI, 0.88–0.97; p<0.001). When maximal ICP increases as 1, development of ME increases 11.4%. ICP : intracranial pressure, CRP : C-reactive protein, ICH : intracerebral hemorrhage, ETT : endotracheal tube, NGT : nasogastric tube, CI : confidence interval, AUC : area under the curve, ME : mastoid effusion

Table 5.
Comparison of AUCs of three different prediction models
Predictor AUC 95% CI p-value Sensitivity Specificity p-value for AUC comparison
Model A 0.908 0.856–0.960 <0.001 0.885 0.796 Reference
Model B 0.923 0.877–0.968 <0.001 0.918 0.759 0.158
Model C 0.925 0.880–0.970 <0.001 0.836 0.852 0.103

AUC : area under the curve, CI : confidence interval

Table 6.
Statistics of NRI and IDI about model B and model C
Value p-value
Model B
 NRI (decile) 0.265 (0.033 to 0.497) 0.025
 IDI 0.034 (-0.001 to 0.069) 0.055
Model C
 NRI (decile) 0.259 (0.021 to 0.497) 0.033
 IDI 0.039 (0.002 to 0.076) 0.041

Values are presented as mean (95% confidence interval). IDI : Integrated Discrimination Improvement, NRI : Net Reclassification Improvement

TOOLS
Similar articles