Abstract
Objective
The functional information of 11C-methionine positron emission tomography (MET-PET) images can be applied for Gamma knife radiosurgery (GKR) and its image quality may affect defining the tumor. This study conducted the phantom-based evaluation for geometric accuracy and functional characteristic of diagnostic MET-PET image co-registered with stereotactic image in Leksell GammaPlan® (LGP) and also investigated clinical application of these images in metastatic brain tumors.
Methods
Two types of cylindrical acrylic phantoms fabricated in-house were used for this study : the phantom with an array-shaped axial rod insert and the phantom with different sized tube indicators. The phantoms were mounted on the stereotactic frame and scanned using computed tomography (CT), magnetic resonance imaging (MRI), and PET system. Three-dimensional coordinate values on co-registered MET-PET images were compared with those on stereotactic CT image in LGP. MET uptake values of different sized indicators inside phantom were evaluated. We also evaluated the CT and MRI co-registered stereotactic MET-PET images with MR-enhancing volume and PET-metabolic tumor volume (MTV) in 14 metastatic brain tumors.
Results
Imaging distortion of MET-PET was maintained stable at less than approximately 3% on mean value. There was no statistical difference in the geometric accuracy according to co-registered reference stereotactic images. In functional characteristic study for MET-PET image, the indicator on the lateral side of the phantom exhibited higher uptake than that on the medial side. This effect decreased as the size of the object increased. In 14 metastatic tumors, the median matching percentage between MR-enhancing volume and PET-MTV was 36.8% on PET/MR fusion images and 39.9% on PET/CT fusion images.
In treatment planning for Gamma knife radiosurgery (GKR), although magnetic resonance imaging (MRI) provides optimal anatomical information and high spatial resolution, additional diagnostic image is required to distinguish the recurrence at a previous radiation treated region. Positron emission tomography (PET) scanning is often needed to localize metabolic activity inside the brain and 11C-methionine positron emission tomography (MET-PET) enables differentiating recurrence from post-treatment induced changes such as radiation necrosis [4]. GKR was attempted using the stereotactic PET image, defined on Leksell GammaPlan® (LGP) by the radioactive fiducial markers [6]. LGP commonly allows a stereotactic image to be acquired using dedicated indicator or the diagnostic image co-registered with the stereotactic image can be used in GKR. Because GKR is a stereotactic image-based radiosurgery device, it is necessary to evaluate the geometric accuracy of stereotactic images available in GKR [2,7,9,10]. Accuracy of image co-registration available in an LGP was investigated for stereotactic or diagnostic image of MR scan and those of computed tomography (CT) scan using both a phantom study and a clinical patient study, which demonstrated the sufficient geometrical accuracy of co-registration function implemented in LGP [8]. Diagnostic PET image without stereotactic information can be co-registered to the reference image and its geometric accuracy and imaging distortion must be acceptable to apply it in GKR.
The purpose of this study is to assess the usefulness of diagnostic MET-PET imaging in region of interest (ROI) defining procedures for GKR in terms of geometric precision. We investigated geometric accuracy and functional characteristic for the routinely co-registered MET-PET image in LGP using a phantom study. We also evaluated the CT and MRI co-registered stereotactic MET-PET images to determine whether these images provide exact stereotactic information for GKR in metastatic brain tumors.
Two types of phantoms were designed and manufactured for this study (Fig. 1). Phantom I to evaluate a geometric accuracy houses an array-shaped axial rod insert, and 69 rods were vertically placed in the 9×9 lattice layout of the phantom (Fig. 2, upper). Phantom II to assess a functional characteristic houses 13 tube inserts of different sizes (1.5, 3, 4, and 5 mm in inner radius) positioned at different distances (20, 28.3, and 45 mm) from circle center of cylinder (Fig. 3, upper). Stereotactic CT and MR images of phantoms were acquired with the fiducial indicators, and PET images were co-registered to already-defined stereotactic images using ImageMergeTM (ELEKTA INSTRUMENT AB, Stockhoim, Swedwn) on LGP (Figs. 2 and 3, lower).
The stereotactic indicator boxes were attached on the stereotactic frame to impose the fiducials on the CT or MR images. A dedicated PET indicator box is not supported by Leksell stereotactic system. A Light Speed VCT (GE Healthcare, Chicago, IL, USA) was used to acquire stereotactic CT images. CT scans had a slice thickness of 0.625 mm and a 250×250 mm field of view (FOV). Stereotactic MR images for the phantoms were acquired using a SIGNA EXCITE 1.5T MRI scanner (GE Healthcare) equipped with a 275 mm inner diameter Quadrature Head Coil (GE Healthcare). Three-dimensional (3D)-MR scanning was performed with a slice thickness of 1 mm and 250×250 mm FOV. A Discovery PET/CT 600 scanner (GE Healthcare) was used to acquire PET images. The stereotactic frame of the phantoms was secured in the head holder fit to the PET couch. MET-PET scanning was performed with a slice thickness of 3.27 mm. The images were reconstructed in the form of transaxial images of 256×256×98 anisotropic voxels. Since PET imaging has the systemic limitation of image acquisition using a conventional dual-head gamma camera fit with a coincidence detector, spatial resolution was essentially much more limited than CT or MR images. Tomographic images from CT, MRI, and PET scanners were imported into the LGP via a computer network. CT and MR images were defined on LGP using the alignment of fiducial markers in the images. The lattice points of the Phantom I were clearly distinguished on CT or MR images, but not on PET images. The lattice points on PET images were defined using the Semi-automatic segmentation tool in LGP.
Geometric accuracy is described by the imaging distortion in spatial linearity and the local displacement in positional deviation. The rods placed systematically in the Phantom I formed the lattice points on tomographic CT, MR, and PET images. In each image set, the center coordinate values of lattice points were measured on different axial planes. To reduce the systematic error, a neurosurgeon and a medical physicist separately measured the coordinate value twice. A CT image was taken as the reference; its distortion was assumed to be negligible in identifying the locations of lattice points. For i×j rod array on Z=k plane of the image, the coordinate matrix (Ck) and its elements (ei,j,k) can be given by Eq. (1).
(i=1…9; j=1…9; k=80, 100, 120, and 140)
Where xi,j,k, yi,j,k and zi,j,k are coordinate values. The center-to-center spacing (Sx or Sy) of lattice points for x or y direction, can be described as Eq. (2).
Therefore, imaging distortions, δ(n) in the spatial linearity can be defined as Eq. (3).
Where Sx(n) or Sy(n) is the spacing of a reference image, and Sx'(n) or Sy'(n) is that of a measured (or distorted) image. Sx(n)-Sx'(n) or Sy(n)-Sy'(n) represents a deviation. n is spacing number. There were 69 lattice points on one image slice and their center-to-center spacing has 60 values for x or y direction, respectively.
The positional deviation field can be identified by the local displacement vectors between coordinate matrices of lattice points on the images within the FOV. The local displacement along each axis can be determined as the difference between the lattice point coordinates for CT and PET images in the Leksell coordinate system.
From Eq. (1), the total displacement corresponding to each lattice point on the z=k plane of the phantom is given by Eq. (4).
Where xi,j,k, yi,j,k and zi,j,k are coordinate values of a reference, and x'i,j,k, y'i,j,k and z'i,j,k is those of a measured (or distorted) image.
The lower image resolution in PET may result in invalid or inaccurate contouring of target. Partial volume effect (PVE) of PET image is phenomenon of the loss of apparent activity in small objects or regions because of the limited resolution of the imaging system, such as PET scanner. PET uptake value may be inaccurate due to the influence of the PVE. PET imaging characteristic for PVE-affected small target was evaluated using Phantom II. The maximum standardized uptake value (SUVmax) for the tube ROI was measured by a nuclear medicine physician. The distortion of the SUV is likely to affect the definition of the tube ROIs. For all tube groups, SUVmax was analyzed according to r (=the inner radius of the tube) and d (=distance from the circle center of the phantom to that of the tube).
The enhanced MR stereotactic images, pre-enhanced CT stereotactic images, and MET-PET images without stereotactic information were examined for 10 patients with 14 metastatic brain tumors. Nine patients had primary lung cancers with non-small cell carcinoma, and one had breast cancer with adenocarcinoma. Out of 14 lesions, eight were previously treated with GKR, and the median prescription dose was 20 Gy (range, 16–20). Six lesions were newly developed. The mean age of the 10 patients (seven men and three women) was 58.5 years (range, 50–71).
The contrast enhanced MR images was performed about 10 minute after Gadovist injection of 0.1 mmol per kilogram body weight. The MET-PET images without stereotactic information were co-registered with the MR and CT stereotactic images by using LGP. MET-PET/CT and MET-PET/MR fusion images were generated (Fig. 4). On the MET-PET images, the metabolic tumor volume (MTV) was calculated as the volume over 1.3×the mean standardized uptake value (SUVmean) of the contralateral normal cortex. The MR-enhanced volume was calculated on T1-weighted MR images after gadolinium administration. On the MET-PET/CT and MET-PET/ MR fusion images, the matching volume was calculated as the MTV including the MR-enhanced volume, and the matching percentage (%) was calculated as the (matching volume/total MTV)×100. We compared the matching percentage between the MET-PET/CT and MET-PET/MR fusion images.
The descriptive statistics are presented as the median value and range. The Wilcoxon signed-rank test was used to compare the differences in the matching percentage between the two groups (MET-PET/CT and MET-MR/CT images). All statistical analyses were performed by using SPSS ver. 21.0 (SPSS, Chicago, IL, USA); statistical significance was accepted at p<0.05.
Spatial linearity may be used to express the degree of imaging distortion present in images produced by any imaging system [12]. The average imaging distortion (, that includes imaging distortion for x- and y-direction), is measured by an absolute value. On different axial planes (around z=80, 100, 120, 140) of the phantom, the average imaging distortion was (z=80, z=100, z=120, z=140) = (0.98, 0.91, 0.92, 0.81%) in stereotactic MR image, (2.69, 2.45, 2.45, 2.88%) in MET-PET/CT fusion image and (2.58, 2.71, 2.79, 2.89%) in MET-PET/MR fusion image. The distortion of the PET fusion images was relatively higher than that of MR images, with no significant difference. Typical distortion distribution was plotted as a deviation (Fig. 5). In addition, there was no statistical difference of imaging distortion according to the co-registered image including CT or MR images. The positional deviation field was identified by the local displacement. Total displacement (∆) of MR and two fusion images was also measured on different axial planes (around z=80, 100, 120, 140) of the phantom : (∆z=80, ∆z =100, ∆z =120, ∆z =140) = (0.69±0.25, 0.69±0.21, 0.82± 0.20, 0.95±0.25 mm) in stereotactic MR image; (0.98±0.34, 0.62±0.30, 0.65±0.32, 0.84±0.39 mm) in MET-PET/CT fusion image; (0.82±0.38, 0.71±0.29, 0.76±0.37, 0.79±0.34 mm) in MET-PET/MR fusion image. A typical positional deviation field maps from the displacement matrix measured in MR and two co-registered MET-PET image plans at z=100 are displayed in Fig. 6. There was no statistical difference between two MET-PET images.
Functional characteristics of PET was evaluated using Phantom II. To verify location dependency of MET-PET uptake, SUVmax of tube ROI was measured and represented by contour plot (Fig. 7). Solid lines represent vertical grids and dotted curves indicate the contour line of SUVmax normalized to its minimum value. The contour interval is the level difference between adjacent contour lines. The spacing of contour line was widened as tube size increased, which indicates MET-PET uptake increased to approach plateaus. The contour line curved to left as the distance from phantom center to the tube increased, which indicates the indicator on the lateral side of the phantom exhibited higher uptake than that on the medial side. This effect decreased as the tube size increased : the uptake value of the outermost tube was increased by 37% (1.13→1.55) for group I, 9.0% (7.09→7.73) for group II, 8.4% (11.86→12.86) for group III and -0.3% (14.00→13.96) for group IV.
The data are summarized in Table 1. The median MRenhanced volume was 1.12 cm3 (range, 0.12–26.28). On MET-PET images, the median SUVmean of the contralateral normal cortex was 1.6 (range, 1.1–2.0), and the median threshold of the MTV was 2.1 (range, 1.4–2.6). The median MTV was 1.14 cm3 (range, 0.21–27.41). On the MET-PET/CT fusion images, the median matching volume was 0.30 cm3 (range, 0.03–19.96), and the median matching percentage was 39.9% (range, 4.5–81.0). On the MET-PET/MR fusion images, the median matching volume was 0.35 cm3 (range, 0.02–18.22), and the median matching percentage was 36.8% (range, 6.9– 81.0). No statistical difference was observed in the matching percentage between MET-PET/CT and PET/MR fusion images (p=0.917).
The co-registration function implemented in LGP has previously been confirmed for stereotactic and diagnostic CT or MR using phantom study, and its accuracy verified as clinically sufficient [8]. However, validation of PET image co-registration in GKR has not been adequately studied. We attempted to quantitatively evaluate the geometric accuracy for diagnostic MET-PET image in routine co-registered imageguided GKR procedures. Although the accuracy of the coregistration process can be assessed using patient images with identifiable anatomical and external markers14), this approach is limited in that anatomical landmarks of the same patient are not always identified on CT, MR and PET images. Consequently, the assessment of co-registration software, such as ImageMergeTM (ELEKTA INSTRUMENT AB), on LGP is mainly based on phantom study [3]. Multi-modality phantoms, allowing geometric accuracy of PET image to be measured simply, were fabricated instead of using a commercialized phantom. Imaging distortion may refer to irregularity of a lattice point interval caused by inappropriate scaling of the distance between points anywhere in tomographic images. For MR image, an imaging distortion in spatial linearity less than 5% is generally acceptable [12]. In phantom study, imaging distortion of MR images was 0.90% mean value over the whole measurement range. Imaging distortions of MET-PET/CT and MET-PET/MR fusion images according to each Z-plane were measured at less than 3% mean value. The degree of distortion deviation of MR image recognized by many authors in stereotactic surgery is generally not more than 1.5 mm in the X-Y plane and 2 to 3 mm in the Z-axis direction [13]. In our study, mean imaging distortion of MR image, MET-PET/CT and MET-PET/MR fusion images were 0.12±0.12 mm, 0.35± 0.30 mm and 0.36±0.34 mm over the whole measurement range. Nakazawa et al.8) assessed the accuracy of image coregistration for stereotactic and diagnostic CT or MR in Leksell stereotactic space using a phantom study, and evaluated its usefulness in clinical cases. In their study, the mean error of the inter-image coordinates was <1 mm in all measurement areas in phantom and clinical patient analyses [8]. In this study, to compare spatial distortion of PET images co-registered to CT and MR images, local displacement was calculated in the axial planes as various z positions. Mean displacement between images was <1 mm over the whole measurement range.
We attempted to quantitatively identify functional characteristics related to an imaging quality for diagnostic PET image in routine co-registered image-guided GKR procedures. PVE can affect the reading of SUVs and is closely related to the detectability of tumors. Presently, the change of MET-uptake according to the location of the small lesion was investigated in a phantom study. The object on the lateral side in phantom exhibited slightly higher SUVmax than that on the medial side, that increased in relatively smaller objects. Especially, the SUVmax of the smallest tube (1.5 mm in diameter) revealed a remarkable increase in lateral side, while biggest tube (5.0 mm in diameter) displayed negligible change. This finding is presumably closely related to the normalizationand attenuation-correction of PET images [1,5]. Although this distortion is only to be in a small area, it should be considered in PET image-guided GKR. There have been few reports of validation of MET-uptake according to location of small lesion in routine GKR procedures so far.
Even though the geometric accuracy of MET-PET images was acceptable on phantom-based study, the PET images of patients failed to show exact stereotactic information in LGP. The spatial difference was observed between the MR-enhanced lesion and the MET uptake lesion in metastatic tumors without infiltrative nature. These difference could be explained with partial volume effect. MET-PET images have the limited spatial resolution, and the radioisotope accumulation could be underestimated especially in less than 2 cm sized lesions [11,15]. The metastatic lesion is almost sphericalshaped. But it has more various shapes than the phantom. And, the radiation necrosis was included within the tumors for previously treated eight lesions. Even though most metastatic tumor cells were within the MR enhanced volume, the radiation effect could make a variety of metabolic intake. In the clinical data, the PET images could more limitations in providing exact stereotactic information compared to phantom study.
MET-PET images can distinguish recurrence from posttreatment radiation effect, and such diagnostic functions can be applied to re-GKR. Geometric accuracy of co-registered PET image in Leksell stereotactic space was acceptable to ensure proper treatment planning in phantom study. However, both CT and MR co-registered PET images could limitations in providing exact stereotactic information in the radiosurgery planning tool in clinical setting. The limited spatial resolution and accuracy should be considered when these images are used for GKR.
Notes
AUTHOR CONTRIBUTIONS
Conceptualization : WYJ, SHL
Data curation : SHL, TYJ, IYK
Formal analysis : SHL, SYK
Funding acquisition : WYJ
Methodology : TYJ, IYK, SJ
Project administration : WYJ, KSM, SJ
Visualization : SHL, SYK
Writing - original draft : SHL
Writing - review & editing : WYJ, TYJ, KSM, IYK, SJ
ACKNOWLEDGMENTS
This study was supported by a grant (HCRI15005-1) Chonnam National University Hospital Biomedical Research Institute.
References
1. Carney JP, Townsend DW, Rappoport V, Bendriem B. Method for transforming CT images for attenuation correction in PET/CT imaging. Medical physics. 33:976–983. 2006.

2. Chung HT, Kim DG. Distortion correction for digital subtraction angiography imaging: PC based system for radiosurgery planning. Comput Methods Programs Biomed. 71:165–173. 2003.

3. Isambert A, Bonniaud G, Lavielle F, Malandain G, Lefkopoulos D. A phantom study of the accuracy of CT, MR and PET image registrations with a block matching-based algorithm. Cancer Radiother. 12:800–808. 2008.

4. Jin SG, Ryu HH, Li SY, Li CH, Lim SH, Jang WY, et al. Nogo-A inhibits the migration and invasion of human malignant glioma U87MG cells. Oncol Rep. 35:3395–3402. 2016.

5. Kaneko K, Kuwabara Y, Sasaki M, Koga H, Abe K, Baba S, et al. Validation of quantitative accuracy of the post-injection transmission-based and transmissionless attenuation correction techniques in neurological FDG-PET. Nucl Med Commun. 25:1095–1102. 2004.

6. Levivier M, Massager N, Wikler D, Lorenzoni J, Ruiz S, Devriendt D, et al. Use of stereotactic PET images in dosimetry planning of radiosurgery for brain tumors: clinical experience and proposed classification. J Nucl Med. 45:1146–1154. 2004.
7. Nakazawa H, Komori M, Shibamoto Y, Takikawa Y, Mori Y, Tsugawa T. Geometric accuracy in three-dimensional coordinates of Leksell stereotactic skull frame with wide-bore 1.5-T MRI compared with conventional 1.5-T MRI. J Med Imaging Radiat Oncol. 58:595–600. 2014.

8. Nakazawa H, Mori Y, Komori M, Shibamoto Y, Tsugawa T, Kobayashi T, et al. Validation of accuracy in image co-registration with computed tomography and magnetic resonance imaging in Gamma knife radiosurgery. J Radiat Res. 55:924–933. 2014.

9. Nakazawa H, Mori Y, Yamamuro O, Komori M, Shibamoto Y, Uchiyama Y, et al. Geometric accuracy of 3D coordinates of the Leksell stereotactic skull frame in 1.5 Tesla- and 3.0 Tesla-magnetic resonance imaging: a comparison of three different fixation screw materials. J Radiat Res. 55:1184–1191. 2014.

10. Neumann JO, Giese H, Biller A, Nagel AM, Kiening K. Spatial distortion in MRI-guided stereotactic procedures: evaluation in 1.5-, 3- and 7-Tesla MRI Scanners. Stereotact Funct Neurosurg. 93:380–386. 2015.

11. Okamoto S, Shiga T, Hattori N, Kubo N, Takei T, Katoh N, et al. Semiquantitative analysis of C-11 methionine PET may distinguish brain tumor recurrence from radiation necrosis even in small lesions. Ann Nucl Med. 25:213–220. 2011.

12. Price RR, Axel L, Morgan T, Newman R, Perman W, Schneiders N, et al. Quality assurance methods and phantoms for magnetic resonance imaging: report of AAPM nuclear magnetic resonance Task Group No. 1. Med Phys. 17:287–295. 1990.

13. Rousseau J, Clarysse P, Blond S, Gibon D, Vasseur C, Marchandise X. Validation of a new method for stereotactic localization using MR imaging. J Comput Assist Tomogr. 15:291–296. 1991.

14. Scarfone C, Lavely WC, Cmelak AJ, Delbeke D, Martin WH, Billheimer D, et al. Prospective feasibility trial of radiotherapy target definition for head and neck cancer using 3-dimensional PET and CT imaging. J Nucl Med. 45:543–552. 2004.
Fig. 1.
Two types of multi-modality phantoms : Phantom I (A) to evaluate a geometric accuracy and Phantom II (B) to assess a functional characteristic of positron emission tomography images.
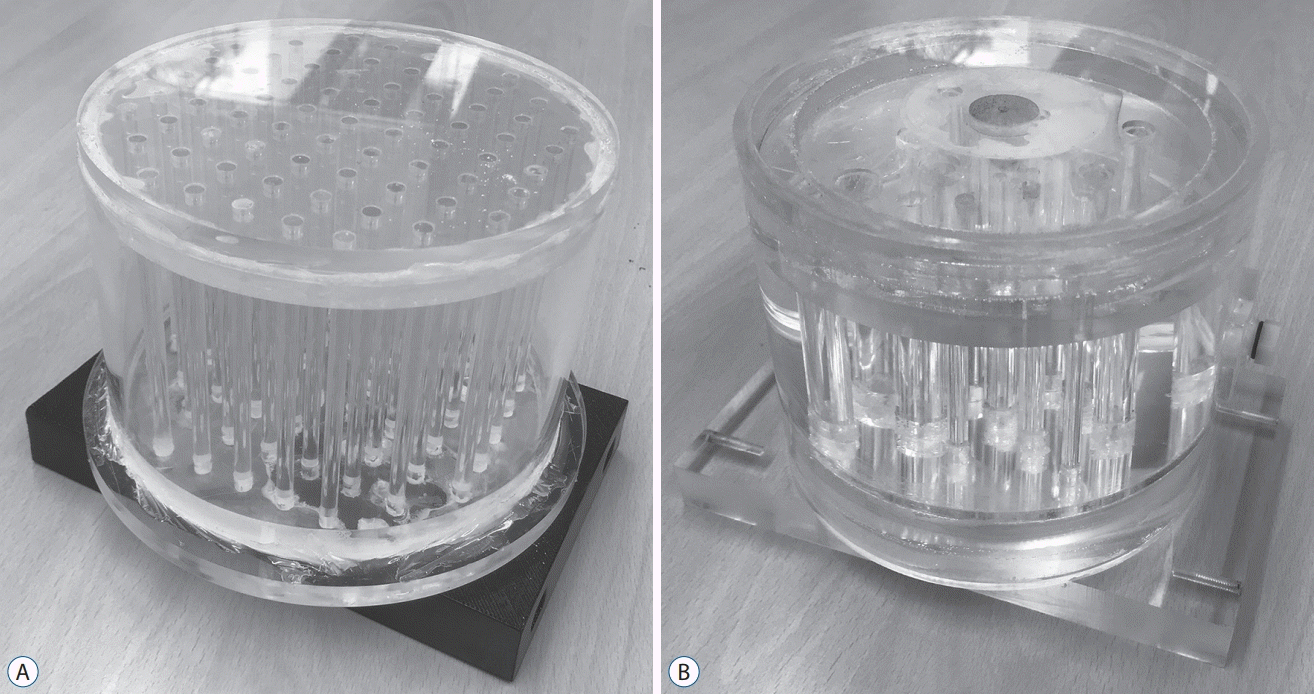
Fig. 2.
Schema of Phantom I : interior view (A) and axial view (B) and of the phantom. Typical Phantom I scanned-images imported into Leksell GammaPlan® : computed tomography (C), magnetic resonance (D), and positron emission tomography (E).
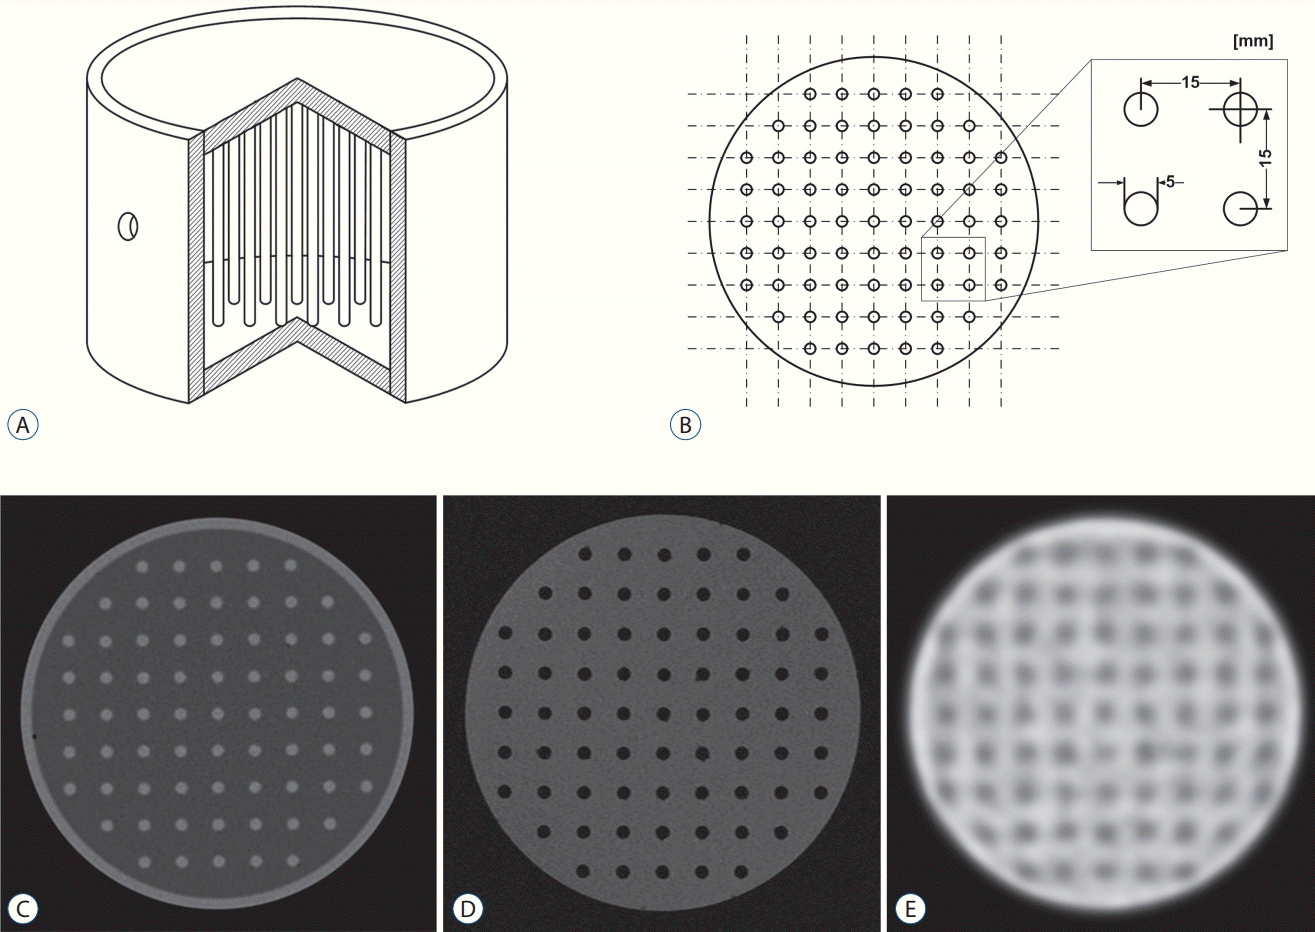
Fig. 3.
Schema of Phantom II : interior view (A) and axial view (B) and of the phantom. Typical phantom II scanned-images imported into Leksell GammaPlan® : computed tomography (C), magnetic resonance (D), and positron emission tomography (E). The phantom contains 13 tubes grouped into by size (group I, 3 tubes with r=1.5 mm; group II, 4 tubes with r=3 mm; group III, 3 tubes with r=4 mm; group IV, 3 tubes with r=5 mm). The tubes in each group are positioned at different distances (20, 28.3, and 45 mm) from cylinder center.
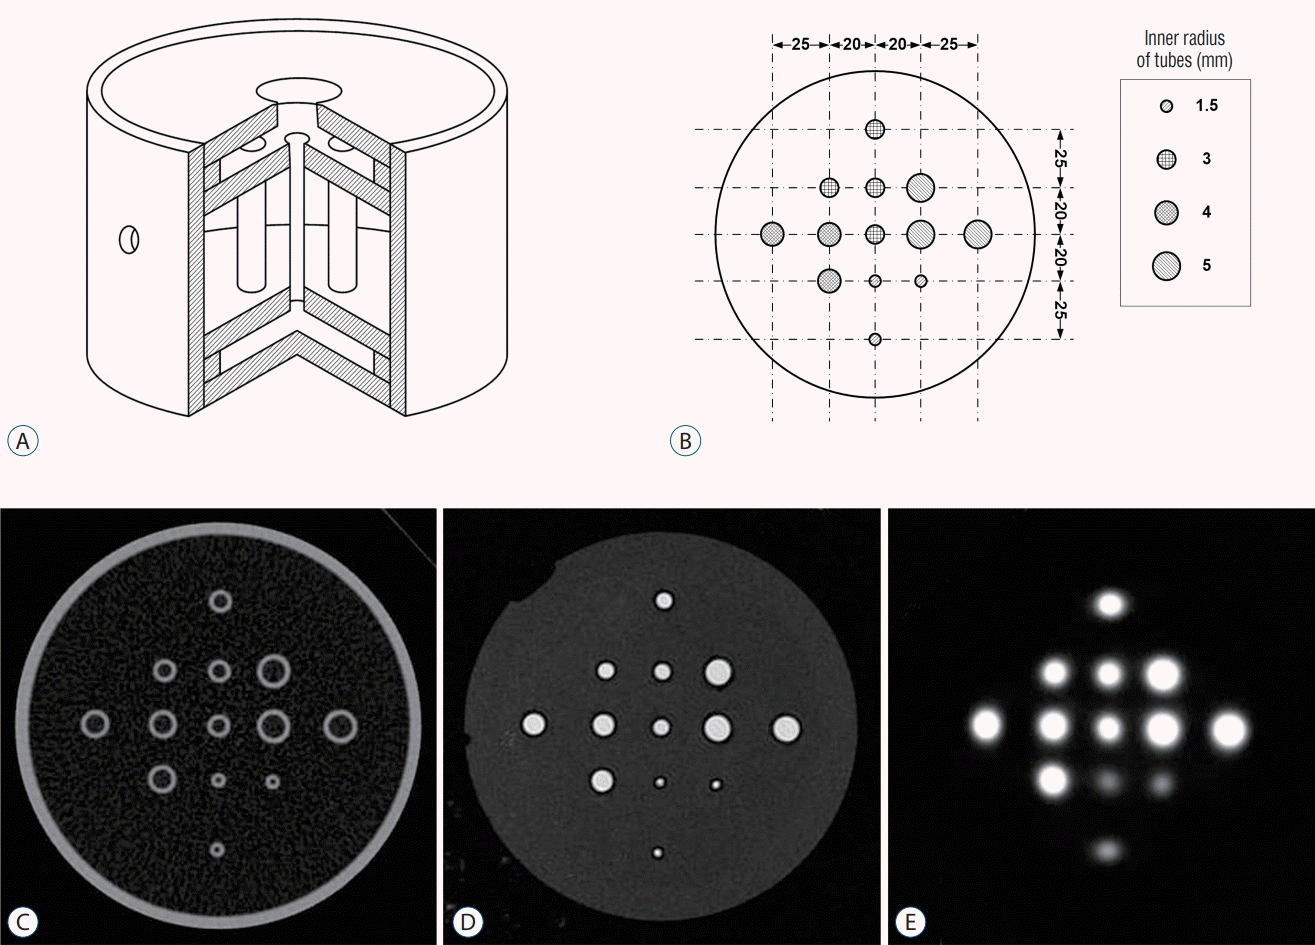
Fig. 4.
MET-PET/CT and MET-PET/MR fusion images with the Leksell GammaPlan®. Upper : MR-enhanced images; MR-enhanced volume (blue line), 1.26 cm3. Middle : MET-PET/CT fusion images; metabolic tumor volume (brown line), 1.41 cm3; matching percentage, 25.5%. Lower : MET-PET/MR fusion images; metabolic tumor volume, 1.41 cm3 (green line); matching percentage, 25.0%. Matching volume : MTV including the MR-enhanced volume; matching percentage (%) : (matching volume/total MTV)×100. MET-PET : 11C-methionine positron emission tomography, CT : computed tomography, MR : magnetic resonance, MTV : metabolic tumor volume.
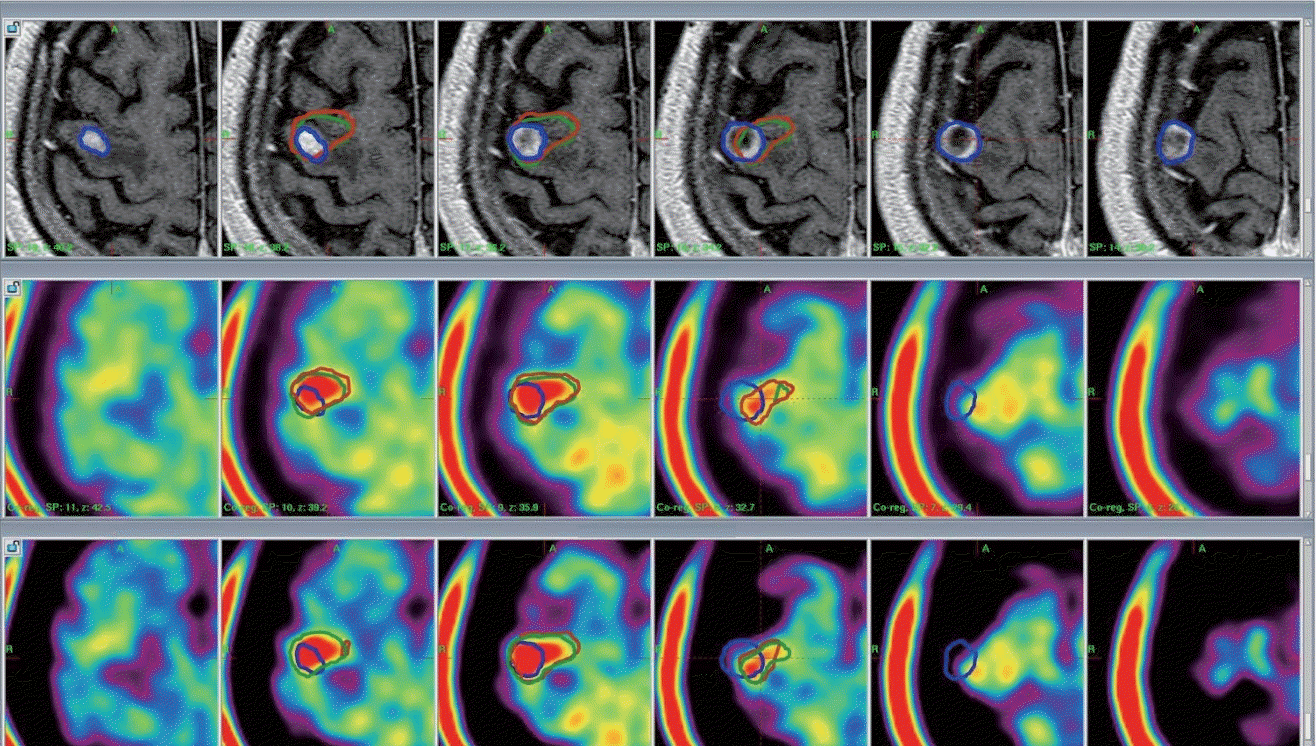
Fig. 5.
Typical distortion distribution for x-direction spacing (Sx) was expressed at various z position. The distortion deviations for MR image was stably maintained, while those of MET-PET images displayed and revealed relatively larger fluctuations. MR : magnetic resonance, MET-PET : 11C-methionine positron emission tomography, CT : computed tomography.
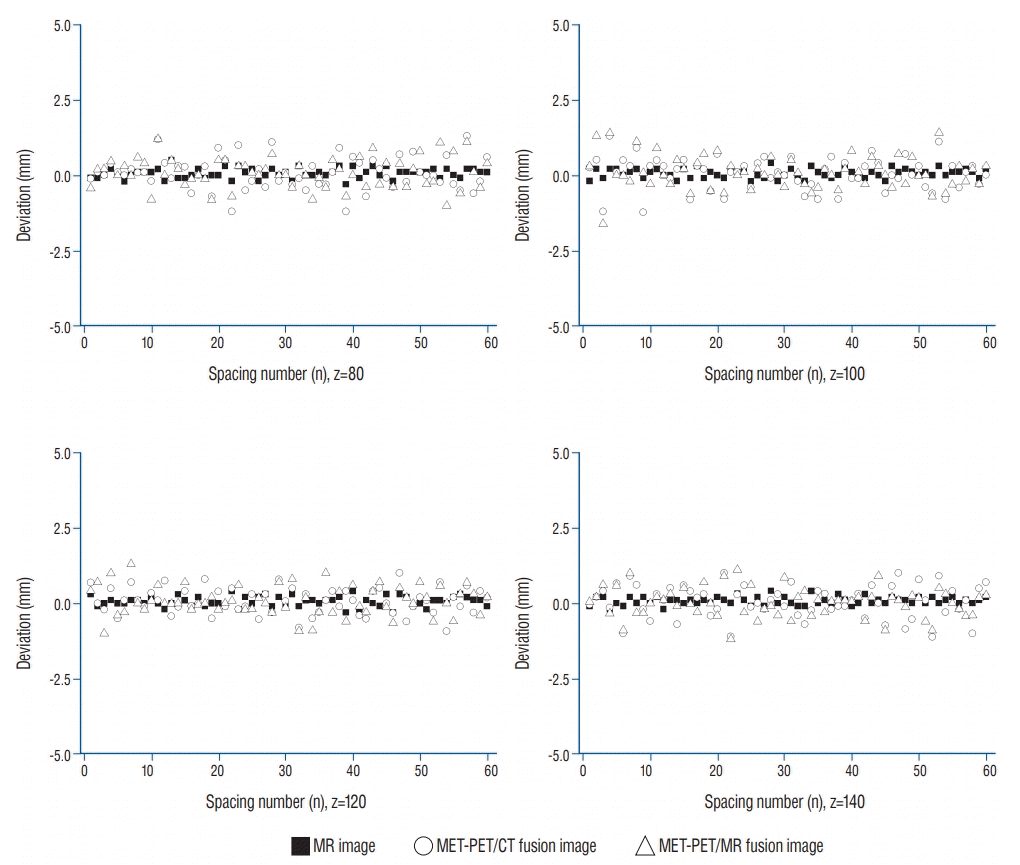
Fig. 6.
Typical positional deviation field map (Di,j,k, z=100) : MR (A), CT-PET (B), and MR-PET (C). Displacement distribution for MR image is stably maintained, while those of PET images reveal relatively larger fluctuations. MR : magnetic resonance, CT : computed tomography, PET : positron emission tomography.
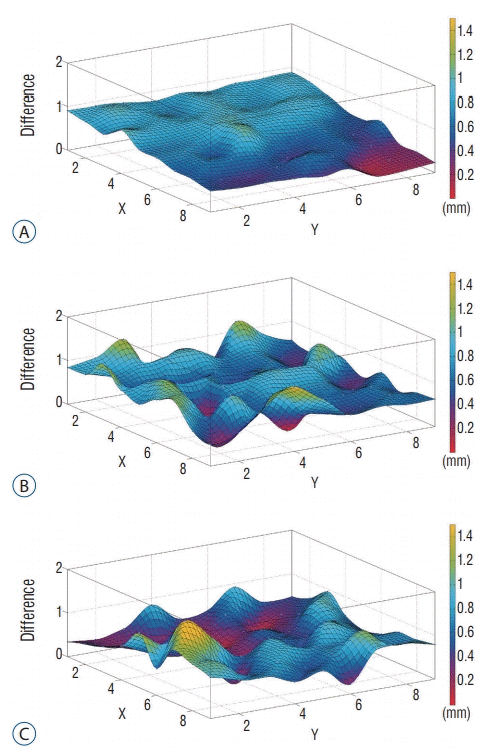
Fig. 7.
SUVmax distribution as a function of tube location (d) and tube size (r), showing image distortion of the phantom II scanned-positron emission tomography image. The dotted lines indicate the contour line set to contour interval of 1.0, and its spacing depends on steepness : the finding shows that SUVmax increases to approach plateaus as tube size increases. Verticality of contour lines represents linearity of SUVmax for tube location: the contour line curved to left represents tube on the lateral side of the phantom exhibits higher uptake than that on the medial side, and these effect decreases as the tube size increases. SUVmax : maximum standardized uptake value.
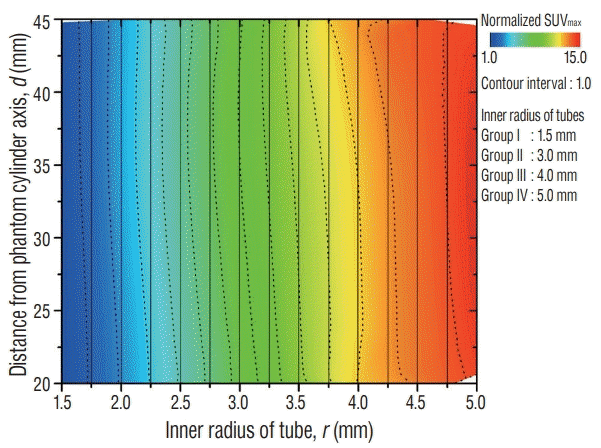
Table 1.
Comparison of CT and MRI co-registered MET-PET stereotactic images
| Patient No. | Tumor No. | Treated/new lesions | MR enhanced volume (cm3) | SUVmean (reference) | PET-MTV threshold | PET-MTV (mL) |
MET-PET/CT fusion images |
MET-PET/MR fusion images |
||
|---|---|---|---|---|---|---|---|---|---|---|
| Matching volume (mL)* | Matching percentage (%)† | Matching volume (mL)* | Matching percentage (%)† | |||||||
| 1 | 1 | New | 0.14 | 1.8 | 2.3 | 0.21 | 0.09 | 42.9 | 0.07 | 33.3 |
| 2 | 2 | New | 1.48 | 1.9 | 2.5 | 1.88 | 1.05 | 55.9 | 1.19 | 63.3 |
| 3 | 3 | New | 2.95 | 1.6 | 2.1 | 4.28 | 1.15 | 26.9 | 2.22 | 51.9 |
| 3 | 4 | New | 0.73 | 1.6 | 2.1 | 0.87 | 0.14 | 16.1 | 0.35 | 40.2 |
| 4 | 5 | New | 1.02 | 1.5 | 2.0 | 2.88 | 1.02 | 35.4 | 0.91 | 31.6 |
| 5 | 6 | Treated | 1.21 | 1.6 | 2.1 | 0.36 | 0.24 | 66.7 | 0.20 | 55.6 |
| 5 | 7 | Treated | 0.65 | 1.6 | 2.1 | 0.45 | 0.19 | 42.2 | 0.13 | 28.9 |
| 6 | 8 | Treated | 26.28 | 2.0 | 2.6 | 27.41 | 19.96 | 72.8 | 18.22 | 66.5 |
| 7 | 9 | Treated | 20.93 | 2.0 | 2.6 | 18.06 | 14.38 | 81.0 | 14.63 | 81.0 |
| 8 | 10 | Treated | 1.52 | 1.3 | 1.7 | 1.93 | 1.16 | 61.0 | 1.22 | 63.2 |
| 8 | 11 | New | 0.12 | 1.3 | 1.7 | 0.66 | 0.03 | 4.5 | 0.16 | 24.2 |
| 9 | 12 | Treated | 0.76 | 1.1 | 1.4 | 0.24 | 0.09 | 37.5 | 0.06 | 25.0 |
| 9 | 13 | Treated | 0.18 | 1.1 | 1.4 | 0.29 | 0.04 | 13.8 | 0.02 | 6.9 |
| 10 | 14 | Treated | 1.26 | 1.4 | 1.8 | 1.41 | 0.36 | 25.5 | 0.35 | 25.0 |
| Median | 1.12 | 1.6 | 2.1 | 1.14 | 0.30 | 39.85 | 0.35 | 36.75 | ||


 PDF
PDF Citation
 Print
Print


 XML Download