Journal List > J Korean Neurosurg Soc > v.63(3) > 1160766

Son, Park, Kang, Han, Choi, and Ohk: In-Vitro Study of Urokinase Thrombolysis Following Stereotactic Aspiration of Intracerebral Hematoma

Abstract

Objective

A consensus regarding the ideal regimen for urokinase (UK) thrombolysis subsequent to stereotactic spontaneous intracerebral hemorrhage aspiration has yet to be established. The purpose of this study is to evaluate the efficacy of UK thrombolysis relative to when the regimen is changed.

Methods

Venous blood from 30 heathy volunteers was obtained for this in-vitro study. Various concentrations of UK solution were added to microcentrifuge tubes containing the clotted blood. The efficacy of UK thrombolysis was identified by checking the weight of lysed hematoma following various time intervals with different concentrations of UK solution. Group one, the “3×4” group involved four administrations every 3 hours over 12 hours, and group two, the “6×2” group involved two administrations every 6 hours over 12 hours.

Results

More hematoma was lysed in the 3×4 group than the 6×2 group across all concentration levels (however, the differences were only significant between groups at the 500 and 1000 IU concentration levels, p<0.05). There were no significant differences of lysed hematoma among the various UK solution concentrations within groups.

Conclusion

This study suggests that frequent administrations of UK thrombolysis may result in a greater degree of lysed hematoma in comparison to a higher concentration of UK.

INTRODUCTION

Spontaneous intracerebral hemorrhage (SICH) is one of the most devastating types of stroke. It represents a significant cause of mortality and morbidity [18]. Stereotactic aspiration and subsequent thrombolysis have been considered a less invasive and more effective treatment modality for spontaneous intracerebral hematoma, especially deep-seated hematoma [13,17]. Various fibrinolytic agents have been administered for the lysis of remnant hematoma after SICH aspiration, including tissue-type plasminogen activator (t-PA), urokinase (UK) and streptokinase [11,17,19].
So far, t-PA has been the most widely used fibrinolytic agent for SICH thrombolysis [8,9,14,18,21]. The first use of t-PA to lyse remnant SICH after stereotactic aspiration was in 1994 by the Gilsbach group [15]. They demonstrated that a basal ganglia hemorrhage was successfully resolved with thrombolysis using t-PA. After that, several reports have demonstrated the effectiveness of t-PA thrombolysis. However, despite its efficacy at resolving hematoma, several adverse effects have been observed in many trials, including proedema, inflammatory, and neurotoxic effects [4-6,16,18].
Therefore, in recent years, UK, an older thrombolytic drug, has re-emerged as a potential fibrinolytic treatment [1,5,18]. Furthermore, a large number of studies have reported that UK thrombolysis following SICH both increases clot resolution rate and improves clinical outcome [2,3,7,18,20].
When it comes to thrombolysis using UK, numerous clinical studies have reported on the efficacy of UK thrombolysis following SICH aspiration. To our knowledge, however, a consensus regarding the ideal regimen for UK thrombolysis has yet to be established. Although various regimens of thrombolysis have been administered at various institutions, there is no evidence to the best of our knowledge regarding the efficacy of UK thrombolysis relative to when the regimen is changed. Accordingly, we attempted to evaluate what the ideal regimen of UK thrombolysis is by doing an in-vitro thrombolysis study.

MATERIALS AND METHODS

Study design

The Ethics Committees of Kyungpook National University involved approved the study. Thirty healthy human volunteers without any history of medication and underlying disease participated in this study. The purpose of our study was two-fold : first, to investigate the effect of UK concentration on thrombolytic activity and, second, to evaluate the frequency of UK application on thrombolytic activity.
The method found in Prasad et al. [15] was followed, wherein clot lytic efficacy of thromboembolic drugs was evaluated by measuring the weight of clot lysed following each subsequent application. In that study, whole blood from healthy volunteers was allowed to form clots in previously-weighed microcentrifuge tubes. After an incubation period, supernatant serum was removed and clot mass was weighed by subtracting the weight of empty microcentrifuge tubes. After lysis by thrombolytic drugs, such as UK, lysed fluid was removed and remnant of the clot was weighed again. The amount of lysed clot was calculated as a function of the weight difference, before and after clot lysis, of the microcentrifuge tube [15]. We found that this was a simple and cost effective model for measurement of clot lysis activity of thrombolytic agents, so we decided to perform our experiment using this method.

Clot formation and UK solution

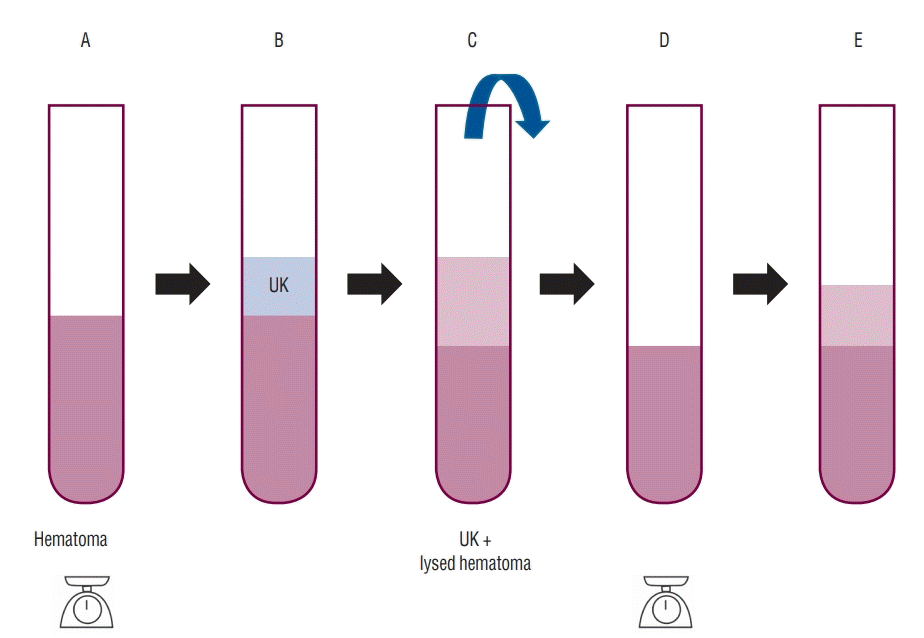
Venous blood was drawn from healthy human volunteers (n=30) without any history of medication or underlying disease. Sampled venous blood was transferred into previously-weighed sterile microcentrifuge tubes (1 mL of blood per tube). Then, the samples were incubated at 37℃ for 24 hours for clot formation. Following incubation, supernatant serum was removed and each tube was weighed again to measure clot weight (Fig. 1). The clot weight was determined by subtracting the weight of empty tube from the weight of tube having the clotted blood. Various concentrations of UK were applicated in the samples for each group : 0, 500, 1000, 2500, and 5000 IU. Each microcentrifuge tube was properly labeled and a UK solution with normal saline was added according to these concentrations. The volume of the each solution was all the same at 0.5 mL.
In terms of reaction duration, samples were divided into two groups. In the first group (group A), the duration of each reaction was 3 hours. After the 3-hour reaction time, we removed lysed supernatant of hematoma and weighed the remnant. After that, a 0.5 mL UK solution of each concentration was added again (Fig. 1). We repeated this process three more times. The total time of experiment was 12 hours, and the total number of measurements was four. At the last step of the experiment, total amount of lysed hematoma was recorded in Table 1. In the second group (group B), the duration of each reaction was 6 hours, and we measured the weight of remnant clot every 6 hours. The total number of measurements for the second group was two. The total amount of lysed hematoma for group two was also recorded in Table 1.

Statistical analysis

Data were analyzed using the programs SPSS Statistics 23 (SPSS Inc., Chicago, IL, USA). The Mann-Whitney U test and t-test were used to analyze differences between two groups as appropriate. The Kruskal-Wallis test and analysis of variance were used to analyze differences due to UK concentration changes. Significance was assumed when the p-value was less than 0.05.

RESULTS

In both groups, irrigation with saline alone showed less hematoma lysis than UK mixed solution. The average amount of liquefied hematoma in group A was greater than the average amount of liquefied hematoma in group B. The total weight of lysed hematoma for each concentration level and each group is shown in Table 1. At all UK concentrations except saline irrigation, more hematoma was lysed in group A than in group B. With regard to concentration level, the 500 and 1000 IU concentrations revealed statistical significance between the two groups (500 IU : 3 hours, 0.562 g; 6 hours, 0.426 g; p<0.006; 1000 IU : 3 hours, 0.564 g; 6 hours, 0.446 g; p<0.29) (Table 1). However, there was no statistical difference between the two groups in the 2500 and 5000 IU concentration. We believe that the lack of statistical significance may be due to the small sample size. It provides evidence that frequent UK thrombolysis administration is more effective. However, comparisons in each group based on UK concentration differences did not reach statistical significance (Table 2).

DISCUSSION

Our laboratory findings suggest that the administration frequency of UK may be a more important factor than UK concentration for efficient thrombolysis, although further studies are needed to confirm these results. Our first result was that the amount of lysed hematoma was more in group A (four administrations every 3 hours over 12 hours) than group B (two administrations every 6 hours over 12 hours) (p values only significant for the 500 and 1000 IU concentrations between groups). Our second result was that differences of liquefied hematoma for UK concentrations within the groups we compared were not statistically significant relative to difference in concentration. This suggests that UK concentration level might be a less important factor in UK thrombolysis efficiency then we expected, although further studies are necessary to validate these results.
Regarding our first result, we found that multiple and frequent administrations of UK thrombolysis may lead to a greater degree of lysed hematoma. Many studies have reported that UK thrombolysis is effective for lysing hematoma. For example, in a study by Chang and Hwang [2], it was reported that fibrinolytic therapy using UK following frameless stereotactic aspiration for SICH is associated with a low rebleeding and mortality rate. Likewise, Tan et al. [18] has shown that UK fibrinolytic therapy better resolved brain edema and led to better outcomes in treatment for SICH. In general, a review of several previous studied reveals that the frequency of UK thrombolysis is distributed over various ranges. In most studies, the time interval of UK thrombolysis varies from 3 to 12 hours [3,10,12]. However, no study to date has investigated differences in efficacy regarding the frequency of UK administrations. Our study suggests that increasing the frequency of UK fibrinolytic therapy administrations leads to a higher degree of lysed hematoma, although further studies are necessary to confirm these preliminary results.
Regarding our second result, the optimal dose for UK lysis of SICH remains unknown. Different researchers have used various regimens, mainly according to non-uniform institutional standards [12]. According to most reports, UK concentrations were distributed in a range from 3000 to 10000 IU. In most cases, the concentration of UK was 5000 IU [3,10,12]. Because UK thrombolysis can cause complications such as rebleeding, we assumed that if the lysis effect of UK is the same across different concentration levels, a lower concentration is more safe. So, we performed an experiment to elucidate whether UK concentrations of lower than 5000 IU have different lytic effects. Accordingly, we decided to compare the amount of thrombolysis each concentrations of UK in the group A. Another comparison was done in the group B. In both analyses, statistical significance was not reached. This suggests UK concentration level may not be a large factor in fibrinolytic therapy efficacy, although further studies are necessary to confirm these preliminary results. However, it is noteworthy that we can consider the possibility that a sufficient effect may be obtained even at a low concentration of UK.
There are some limitations associated with this study. The first limitation is that this is in vitro study. Because the result of the study is confined to the in-vitro circumstances, it is unlikely to know whether changing these factors would have the same effect in clinical situations. The second limitation is that the area where hematoma and UK come in contact could influence the result of the experiment. The results of the experiment may vary depending on the UK surface area of the blood clot. The third limitation is that our study only checked the amount of lysed hematoma depending on a few variations in UK concentration and frequency of thrombolysis. For example, the effect of more than 4 UK administrations within 12 hours was not included in this study. Accordingly, further studies would be needed to support our study and to find more information on what the ideal regimen and frequency of thrombolysis should be in practice.

CONCLUSION

This study suggests that at the same concentration, frequent administrations of UK thrombolysis may result in a greater degree of lysed hematoma. Further, our result that the relationship between UK concentration and the amount of lysed hematoma was not statistically significant might suggest that we can try lower the UK concentration in clinical cases. However, it is important to stress that further studies are necessary to confirm these preliminary results.

Notes

No potential conflict of interest relevant to this article was reported.

ACKNOWLEDGMENTS

This work was supported by Biomedical Research Institute grant, Kyungpook National University Hospital (2016).

Notes

Author Contributions

Conceptualization : JCP, WSS

Data curation : YMH, YJC

Formal analysis : WSS, BRO

Funding acquisition : WSS

Methodology : WSS

Project administration : JCP, WSS

Visualization : WSS

Writing - original draft : WSS

Writing - review & editing : JCP, DHK

References

1. Aydin IH, Takçi E, Kadioglu HH, Kayaoglu CR, Tüzün Y. The effect of urokinase on experimental intracerebral haematomas. Zentralbl Neurochir. 55:29–34. 1994.
2. Chang YH, Hwang SK. Frameless stereotactic aspiration for spontaneous intracerebral hemorrhage and subsequent fibrinolysis using urokinase. J Cerebrovasc Endovasc Neurosurg. 16:5–10. 2014.
crossref
3. Chen X, Chen W, Ma A, Wu X, Zheng J, Yu X, et al. Frameless stereotactic aspiration and subsequent fibrinolytic therapy for the treatment of spontaneous intracerebral haemorrhage. Br J Neurosurg. 25:369–375. 2011.
crossref
4. Gaberel T, Macrez R, Gauberti M, Montagne A, Hebert M, Petersen KU, et al. Immunotherapy blocking the tissue plasminogen activatordependent activation of N-methyl-D-aspartate glutamate receptors improves hemorrhagic stroke outcome. Neuropharmacology. 67:267–271. 2013.
crossref
5. Gaberel T, Montagne A, Lesept F, Gauberti M, Lemarchand E, Orset C, et al. Urokinase versus Alteplase for intraventricular hemorrhage fibrinolysis. Neuropharmacology. 85:158–165. 2014.
crossref
6. Keric N, Maier GS, Samadani U, Kallenberg K, Dechent P, Brueck W, et al. Tissue plasminogen activator induced delayed edema in experimental porcine intracranial hemorrhage: reduction with plasminogen activator inhibitor-1 administration. Transl Stroke Res. 3:88–93. 2012.
crossref
7. Lian L, Xu F, Hu Q, Liang Q, Zhu W, Kang H, et al. No exacerbation of perihematomal edema with intraclot urokinase in patients with spontaneous intracerebral hemorrhage. Acta Neurochir (Wien). 156:1735–1744. 2014.
crossref
8. Lippitz BE, Mayfrank L, Spetzger U, Warnke JP, Bertalanffy H, Gilsbach JM. Lysis of basal ganglia haematoma with recombinant tissue plasminogen activator (rtPA) after stereotactic aspiration: initial results. Acta Neurochir (Wien). 127:157–160. 1994.
crossref
9. Meunier JM, Wenker E, Lindsell CJ, Shaw GJ. Individual lytic efficacy of recombinant tissue plasminogen activator in an in vitro human clot model: rate of “nonresponse”. Acad Emerg Med. 20:449–455. 2013.
crossref
10. Montes JM, Wong JH, Fayad PB, Awad IA. Stereotactic computed tomographic-guided aspiration and thrombolysis of intracerebral hematoma : protocol and preliminary experience. Stroke. 31:834–840. 2000.
crossref
11. Narayan RK, Narayan TM, Katz DA, Kornblith PL, Murano G. Lysis of intracranial hematomas with urokinase in a rabbit model. J Neurosurg. 62:580–586. 1985.
crossref
12. Naval NS, Nyquist P, Carhuapoma JR. ICH aspiration and thrombolysis. J Neurol Sci. 261:80–83. 2007.
crossref
13. Niizuma H, Otsuki T, Johkura H, Nakazato N, Suzuki J. CT-guided stereotactic aspiration of intracerebral hematoma--result of a hematomalysis method using urokinase. Appl Neurophysiol. 48:427–430. 1985.
crossref
14. Ouriel K, Welch EL, Shortell CK, Geary K, Fiore WM, Cimino C. Comparison of streptokinase, urokinase, and recombinant tissue plasminogen activator in an in vitro model of venous thrombolysis. J Vasc Surg. 22:593–597. 1995.
crossref
15. Prasad S, Kashyap RS, Deopujari JY, Purohit HJ, Taori GM, Daginawala HF. Development of an in vitro model to study clot lysis activity of thrombolytic drugs. Thromb J. 4:14. 2006.
crossref
16. Rohde V, Rohde I, Thiex R, Ince A, Jung A, Dückers G, et al. Fibrinolysis therapy achieved with tissue plasminogen activator and aspiration of the liquefied clot after experimental intracerebral hemorrhage: rapid reduction in hematoma volume but intensification of delayed edema formation. J Neurosurg. 97:954–962. 2002.
crossref
17. Samadani U, Rohde V. A review of stereotaxy and lysis for intracranial hemorrhage. Neurosurg Rev. 32:15–21. discussion 21-22. 2009.
crossref
18. Tan Q, Chen Q, Niu Y, Feng Z, Li L, Tao Y, et al. Urokinase, a promising candidate for fibrinolytic therapy for intracerebral hemorrhage. J Neurosurg. 126:548–557. 2017.
crossref
19. Teernstra OP, Evers SM, Lodder J, Leffers P, Franke CL, Blaauw G. Stereotactic treatment of intracerebral hematoma by means of a plasminogen activator: a multicenter randomized controlled trial (SICHPA). Stroke. 34:968–974. 2003.
crossref
20. Wang GQ, Li SQ, Huang YH, Zhang WW, Ruan WW, Qin JZ, et al. Can minimally invasive puncture and drainage for hypertensive spontaneous Basal Ganglia intracerebral hemorrhage improve patient outcome: a prospective non-randomized comparative study. Mil Med Res. 1:10. 2014.
crossref
21. Zeumer H, Freitag HJ, Zanella F, Thie A, Arning C. Local intra-arterial fibrinolytic therapy in patients with stroke: urokinase versus recombinant tissue plasminogen activator (r-TPA). Neuroradiology. 35:159–162. 1993.
crossref

Fig. 1.
The weight of clotted venous blood in microcentifuge tube was measured on an electric micro scale. After UK was added (tube B) lysed hematoma was removed (tube C). The weight of lysed hematoma after UK reaction was determined by subtracting the weight of tube D from tube A. After that, a 0.5 mL UK solution of each concentration was added again (tube E). UK : urokinase.
jkns-2018-0224f1.tif
Table 1.
Differences of liquefied hematoma for dosing intervals in UK concentrations (at 12 hours)
Total amount of lysed hematoma (g)
p-value
Group A (3 hours) Group B (6 hours)
UK concentration (IU)
 0 0.249±0.129 (0.059–0.463) 0.231±0.120 (0.058–0.447) 0.673*
 500 0.562±0.198 (0.175–0.845) 0.426±0.189 (0.118–0.744) 0.006*
 1000 0.564±0.207 (0.185–0.869) 0.446±0.199 (0.109–0.771) 0.029
 2500 0.542±0.213 (0.180–0.869) 0.459±0.194 (0.124–0.788) 0.126*
 5000 0.532±0.220 (0.154–0.975) 0.449±0.203 (0.071–0.834) 0.135
Weight of initial hematoma 0.668±0.164 (0.504–0.832) 0.717±0.158 (0.559–0.875) 0.237

Values are presented as mean±standard deviation (range).

* Mann-Whitney U test.

t-test. UK : urokinase

Table 2.
Differences of liquefied hematoma for UK concentrations (at 12 hours)
Dose interval UK concentration (IU) Total amount of lysed hematoma (g) p-value
Group A (3 hours) 500 0.562±0.198 0.937*
1000 0.564±0.207
2500 0.542±0.213
5000 0.532±0.220
Group B (6 hours) 500 0.426±0.189 0.933
1000 0.446±0.199
2500 0.459±0.194
5000 0.449±0.203

Values are presented as mean±standard deviation.

* Kruskal-Wallis test.

ANOVA. UK : urokinase

TOOLS
Similar articles