Abstract
Objective
To investigate the epidemiology of newly-diagnosed, histologically-confirmed (NDHC) central nervous system (CNS) tumours and its changes over a 21-year period in a regional hospital in Hong Kong.
Methods
This is a single-institute retrospective descriptive study of patients undergoing surgery for CNS tumours in a regional hospital of Hong Kong in the period from January 1996 to December 2016. The histological definition of CNS tumours was according to the World Health Organization classification, while the site definition for case ascertainment of CNS tumours was as set out by the Central Brain Tumour Registry of the United States. Patients of any age, who had NDHC CNS tumours, either primary or secondary, were included. The following parameters of the patients were retrieved : age at diagnosis, gender, tumour location, and histological diagnosis. Population data were obtained from sources provided by the Government of Hong Kong. The incident rate, estimated by the annual number of cases per 100000 population, for each histology grouping was calculated. Statistical analyses, both including and excluding brain metastases, were performed. Statistical analysis was performed with Microsoft Excel, 2016 (Microsoft, Redmond, WA, USA).
Results
Among the 2134 cases of NDHC CNS tumours, there were 1936 cases of intracranial tumours and 198 cases of spinal tumours. The annual number of cases per 100000 population of combined primary intracranial and spinal CNS tumours was 3.6 in 1996, and 11.1 in 2016. Comparing the 5-year average annual number of cases per 100000 population of primary CNS tumours from the period 1996–2000 to 2011–2015, there was an 88% increase, which represent an increase in the absolute number of cases by 4.52 cases/100000 population. This increase was mainly contributed by benign histologies. In the aforementioned periods, meningiomas increased by 1.45 cases/100000 population; schwannomas by 1.05 cases/100000 population, and pituitary adenomas by 0.91 cases/100000 population. While gliomas had a fluctuating 5-year average annual number of cases per 100000 population, it only had an absolute increase of 0.51 cases/100000 population between the 2 periods, which was mainly accounted for by the change in glioblastomas.
Conclusion
This retrospective study of CNS tumour epidemiology revealed increasing trends in the incidences of several common CNS tumour histologies in Hong Kong, which agrees with the findings in large-scale studies in Korea and the United States. It is important for different geographic locations to establish their own CNS tumour registry with well-defined and structured data collection and analysis system to meet the international standards.
Information on the epidemiology of central nervous systems (CNS) tumours is important for clinical practice and research in neuro-oncology. Variations in the epidemiology of CNS tumours among different ethnic groups and geographic locations are well-established observations [17,25,26]. Ethnic Chinese constituted over 94% of the population of Hong Kong [1]. The health care system in Hong Kong is composed of the public and private sectors. The public health care services in Hong Kong are provided by government-funded hospitals governed by the Hospital Authority. Over 80% of patients in Hong Kong are treated in these government-funded hospitals [13]. These hospitals are grouped into seven clusters of hospitals under the Hospital Authority by geographic territory and each cluster has their own neurosurgery department [13]. Our institute, the Department of Neurosurgery of Tuen Mun Hospital, belongs to the New Territory West Cluster (NTWC) and had a catchment population of about 1.10 million in 2016, while the population of Hong Kong reached 7.34 million in 2016 [4]. Favorable condition for collecting epidemiological data it seems, there is very limited local epidemiological data on CNS tumours [12,20]. The Hong Kong Cancer Registry, which provides a populational-based cancer statistics of Hong Kong starting from 1963, registers only malignant brain tumours without covering benign CNS tumours [15]. In addition, none of the previous local reports fulfills the current international standards of using structured and detailed registration definitions [16,17,24].
Without an existing territory-wide CNS tumour registry, we investigate the epidemiology of newly-diagnosed, histologically-confirmed (NDHC) CNS tumours and its changes over a 21-year period in our institute, in order to gain insight into the epidemiology of CNS tumours in Hong Kong. Specifically, we look for 1) the annual number of patients with NDHC CNS tumours at our institute from January 1996 to December 2016, 2) the demographic and oncological characteristics of these patients, and 3) the annual number of cases per 100000 population for various NDHC CNS tumours in the population serviced by our institute through this 21-year period.
This study complies with the standard of Clinical Research Ethic Committee and Institutional Review Board of Tuen Mun Hospital. This is a single-institute retrospective descriptive study. Identifiers of patients undergoing surgery for CNS tumours in the period from January 1996 to December 2016 were retrieved from the operation database of the Department of Neurosurgery at Tuen Mun Hospital. We did not include solely autopsy cases. The medical records and histology reports of all identified patients were reviewed. The histological definition of CNS tumours was according to the World Health Organization (WHO) classification [19]. Since there have been amendments to the WHO classification in this 21-year period, the histological diagnosis on the report at the time of the first confirmatory diagnosis of a tumour was used, without histology slide review [18]. While, the site definition for case ascertainment of CNS tumours was as set out by the Central Brain Tumour Registry of the United States (CBTRUS), which practically includes all intracranial tumours, optic nerve tumours, olfactory tumours of the nasal cavity, and dural/intradural spinal tumours, and excludes skull tumours not involving the intracranial compartment. We also adopted the definition of “gliomas” by the CBTRUS. It encompasses the histologies with ICD-O-3 histology codes 9380-9384, 9391-9460, and practically includes all diffuse astrocytic and oligodendroglial tumours, other astrocytic tumours, ependymal tumours, other gliomas, and dysembryoplastic neuroepithelial tumours [24].
Patients of any age fulfilling both of the following two criteria were included : 1) The tumour was a CNS tumour (as defined above), either primary or secondary, satisfying the WHO classification; and 2) the tumour tissue for the initial histological diagnosis was obtained in the study period – i.e., newly diagnosed tumour. A newly diagnosed CNS tumour was defined as a tumour that had never been histologically confirmed in the patient before the study period. A patient might have two different newly diagnosed CNS tumours, provided that the histology of the second lesion is different from the first, excluding disease progression to a higher grade.
We excluded 1) patients suspected to have CNS tumours without histological confirmation, 2) patients with tumours involving the intracranial or spinal intradural compartments by local extension of head and neck soft tissue tumours, and 3) patients with non-neoplastic lesions such as Rathke’s cleft cyst, epidermoid cyst, arachnoid cyst, and radionecrosis.
Population data were obtained from sources provided by the Government of Hong Kong [1-4,9,10]. Mid-year population data of the districts in the catchment area of our institute through the study period were retrieved. The catchment area of our institute (NTWC) included three administrative districts from 1996 to 2002 (Tuen Mun, Yuen Long, and North District); but only two districts from 2003 to 2016 (Tuen Mun and Yuen Long). The total population of the catchment area in each year was calculated. We made the following assumptions when calculating the annual number of cases for various NDHC CNS tumours in the population serviced by our institute : 1) nearly all patients with CNS tumours residing in the catchment area of our institute (NTWC) received neurosurgical treatment at our institute, and 2) our patients with CNS tumours were nearly exclusively residing in our institute’s catchment area. The mid-year total population of Hong Kong of each year of the study period was also retrieved.
The annual number of cases for each histology grouping and some common histologies was tabulated. Statistical analyses, both including and excluding brain metastases, were performed. The annual number of cases per 100000 population of various NDHC CNS tumours in the population serviced by our institute in a certain year was calculated by dividing the annual number of cases in that year by the midyear catchment area population of that year. Trend lines for annual number of cases per 100000 population of some common CNS tumours were plotted for comparison. Distribution graphs of some common CNS tumours by age at diagnosis, and by gender were plotted. Male to Female ratios of various CNS tumours were compared using Z test. Statistical analysis was performed with Microsoft Excel, 2016 (Microsoft, Redmond, WA, USA).
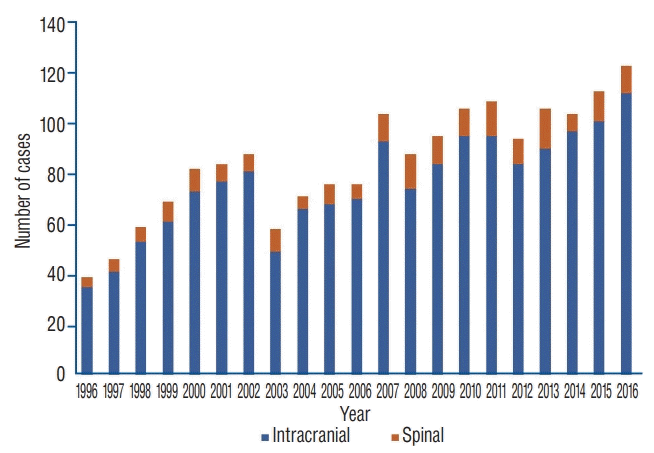
In the study period, there were 2134 patients with NDHC CNS tumours, which consisted of 1936 intracranial CNS tumours (1600 primary tumours, 336 brain metastases) and 198 spinal CNS tumours (192 primary tumours, six spinal intradural metastases). The annual number of cases of all primary CNS (intracranial and spinal) tumours is shown in Fig. 1. The distribution of these 2134 patients by histology groupings and histologies is shown in Table 1. Our initial search identified 2539 patients, but 405 patients were excluded for the following reasons : 16 patients with incomplete information; 229 patients with initial diagnosis made before the study period; 160 with non-neoplastic lesions, which include 23 epidermoid cysts, four dermoid cysts, 24 Rathke’s cleft cysts, and 109 miscellaneous lesions such as inflammation, demyelination, gliosis, and radiation effect. The 16 patients with incomplete information presented between 1996 and 2000.
The mid-year population in NTWC catchment area was 1.08 million in 1996, 1.04 million in 2006, and 1.10 million in 2016 and the corresponding mid-year total population of Hong Kong was 6.44 in 1996, 6.86 in 2006 and 7.34 in 2016 [5-8]. Thus, the NTWC catchment population was about 15% of the total population of Hong Kong in the study period. The midyear population of NTWC catchment area is shown in Fig. 2. The mid-year total population of Hong Kong and the percentage of the NTWC catchment area population over the total population of Hong Kong are also shown in Fig. 2. The drop in NTWC catchment area population in 2002 was due to relocating medical services of North District to another cluster of the Hospital Authority. There was a steady increase in the NTWC catchment area population from 2002 to 2016, with an average increment of 0.70% per year.
Considering all intracranial CNS tumours (primary and metastatic), the histology groupings in descending frequency of occurrence were tumours of the meninges (560 cases, 28.9% of all intracranial CNS tumours), gliomas (331 cases, 17.1%), brain metastases, (336 cases, 17.4%), tumours of the sellar region (315 cases, 16.3%), nerve sheath tumours (197 cases, 10.2%), germ cell tumours (39 cases, 2.4%), and primary CNS lymphomas (31 cases, 1.6%) (Table 1). When considering only primary intracranial CNS tumours, tumours of the meninges (35.0%) and gliomas (20.6%) together accounted for over half of the cases. Astrocytic, oligodendroglial, and ependymal tumours accounted for the majority of the gliomas; and over 50% of these tumours were glioblastomas (Table 1). The annual number of cases of intracranial gliomas, with WHO grading stratification, in the study period is shown in Fig. 3.
The number of primary intracranial CNS tumours with respect to age at diagnosis followed a right-skewed distribution, as shown in Fig. 4. Primary intracranial CNS tumours in general were most commonly first diagnosed in the 50–55 age group. Brain metastases also had a similar age distribution pattern as primary intracranial CNS tumours (Fig. 5). Different types of primary intracranial CNS tumours had slightly different distribution pattern by age at diagnosis. Most of the commonly encountered tumours had a peak age at diagnosis between the age 50 and 60 (Fig. 5).
Considering all primary intracranial CNS tumours, the male to female ratio was 0.82 : 1 (p<0.0001). However, different histologies of primary intracranial CNS tumours had highly variable male to female ratios. Meningiomas occurred much more frequently in female patients (male : female=0.36 : 1, p<0.0001), while the opposite was observed in germ cell tumours (male : female=5.50 : 1, p<0.0001). Male patients accounted for higher proportions of intracranial gliomas (male : female=1.52 : 1, p=0.0005), and glioblastomas (male : female=1.57 : 1, p=0.0041) (Fig. 6). Brain metastases had a male to female ratio of 1.38 : 1 (p=0.0055) (Fig. 6).
The details of the annual number of cases of NDHC intracranial CNS tumours per 100000 population for the years 1996 to 2016 are shown in Table 2. The annual number of cases per 100000 population of NDHC primary intracranial CNS tumours had been increasing through the study period, from 3.24 cases per 100000 population in 1996 to 10.15 cases per 100000 population in 2016. Brain metastases had fluctuating annual rates, but also on an increasing trend. Fig. 7 shows the 5-year average of the annual number of cases per 100000 population of different types of NDHC intracranial CNS tumours. It shows that the incidence rates of most histology groupings were on rising trends.
The annual number of cases per 100000 population of intracranial gliomas in 2016 was 2.17, including 1.36 for glioblastoma. The 5-year average annual number of cases per 100000 population of intracranial gliomas is shown in Fig. 8. There are obvious rising trends in the annual number of cases per 100000 population of both WHO grade II and WHO grade IV gliomas; while WHO grade I and WHO grade III gliomas both had a slight decrease in their rates (Fig. 8).
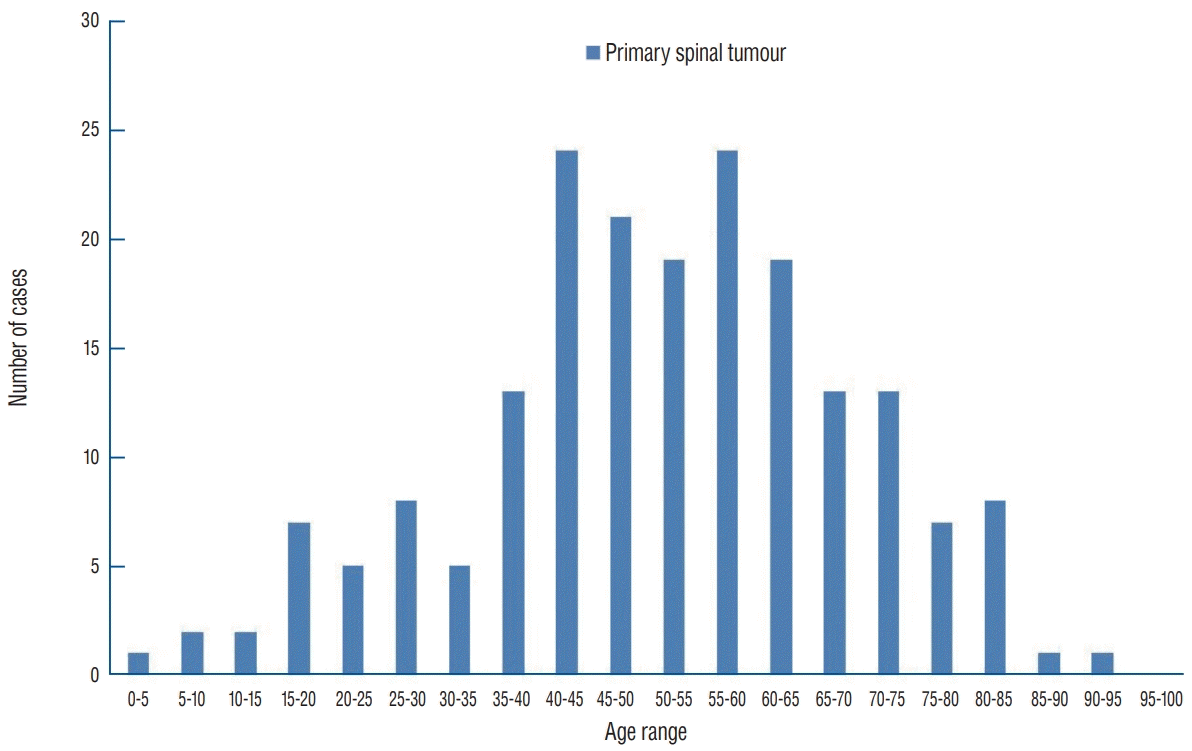
Considering all spinal CNS tumours (primary and metastatic), histology groupings in descending frequency of occurrence were nerve sheath tumours (96 cases, 49%), meningiomas (50 cases, 25%), gliomas (26 cases, 13%), and metastases (six cases, 3%). The distribution of spinal CNS tumours by histology groupings is shown in Table 1. Of all spinal CNS tumours, the male to female ratio was 1 : 1.03. The male to female ratios of different histological groups were not calculated because of small case numbers. The distribution of all spinal CNS tumours by age at diagnosis is shown in Fig. 9. The age at diagnosis of spinal CNS tumours had a broad high frequency range, between ages 40 to 60.
The 5-year average annual number of cases of different histological groups of spinal CNS tumours per 100000 population is shown in Fig. 10. Overall, the average annual number of cases per 100000 population of spinal schwannomas and meningiomas were increasing.
Primary spinal CNS tumours constituted only 10.7 % of all primary CNS tumours.
The annual number of cases per 100000 population of combined primary intracranial and spinal CNS tumours are shown in Table 3. Only meningiomas, nerve sheath tumours, and gliomas are shown in Table 3. For other types of tumours, the annual number of cases per 100000 population of certain spinal tumours were similar to their combined rates of intracranial and spinal tumours because they do not, or very rarely, occur within the spinal canal. The 5-year average annual number of cases per 100000 population of all primary CNS tumours, and some common histologies are shown in Fig. 11. For all primary CNS tumours, there was an 88% increase in the 5-year average annual number of cases per 100000 population from the period 1996–2000 to 2011–2015, which represent an increase in the absolute number of cases by 4.52 cases/100000 population (Fig. 11). This increase was mainly contributed by benign histologies. In the above-mentioned periods, meningiomas increased by 1.45 cases/100000 population (82%); schwannomas by 1.05 cases/100000 population (136%), and pituitary adenomas by 0.91 cases/100000 population (256%) (Figs. 7 and 11). While gliomas had a fluctuating 5-year average annual number of cases per 100000 population, there was only an absolute increase of 0.51 cases/100000 population (38%) between the first and the last 5-year periods, which was mainly accounted for by the change in glioblastomas (Fig. 7).
The study of CNS tumour epidemiology has several challenges when aiming to analyze geographic differences and chronological changes [11,17,20,21,23-25,27]. First, how we classify CNS tumours by histology (histological definition) is changing. Even though the WHO classification of CNS tumours has been universally accepted as the cornerstone of histological diagnosis of all CNS tumours, it is an evolving classification to accommodate new discoveries especially molecular findings of tumours [19,28]. In addition, historically, cancer registries did not include benign CNS tumours, which also have significant impacts on patients. Second, the anatomical compartments of CNS tumours vary among different registries. Take for example, tumours of the pituitary and pineal glands, brain lymphoma and leukaemia, and olfactory tumours of the nasal cavity are included as CNS tumours by CBTRUS, but not by the International Agency for Research on Cancer [25]. Third, there is no consensus on what forms a valid diagnosis – whether histological diagnosis is mandatory, or solely radiological diagnosis can be included. Many CNS tumours do not need treatment, and diagnosis is solely based on radiology – typically for small and benign lesions. And, for various considerations, many CNS tumours are treated with radiation therapy techniques without a histological diagnosis. However, if radiological diagnosis is accepted as a valid diagnostic criterion, we would then need to ask “to what extent”; for example, do we include small dural-based calcifications as meningiomas, non-cystic pituitary lesions as adenomas, lesions associated with nerves as schwannomas. Fourth, there is no standard definition on the inclusiveness of the data sources of a registry; for example, whether to include autopsy cases, and scrutinize radiology databases.
Currently, CBTRUS is likely the largest histology-specific aggregation of CNS tumour cases in the world that has structured and detailed registration definitions. We therefore adopted the site definition, histological definition of CBTRUS. Different from CBTRUS, we only included histologically confirmed cases, because radiologically diagnosed cases were not systematically collected in the past in our institute. Naturally, it is our goal to carry on and collect radiologically diagnosed cases in the future. But since CBTRUS also published the percentage of histologically confirmed cases, to a certain degree, our data can also be compared to their data [24]. Another difference from CBTRUS is that we collected data on metastatic tumours as well, but we analyze our data both with and without metastatic tumours. The advantage is that our data can be compared to CBTRUS data where only primary tumours are included, and also with publications where metastatic tumours are included, as in all of the previously published local data [12,20,26].
From our study, the annual number of cases per 100000 population of primary CNS tumours (combined intracranial and spinal) were increasing throughout the years 1996–2016 (Fig. 11, Table 3). Benign histologies – meningioma, schwannoma, and pituitary adenoma accounted for the majority of the overall increase in the number of cases per annum (Figs. 7 and 11). Gliomas had fluctuating annual number of cases per 100000 population, and a small increase in absolute number of cases over the years. The increase in annual number of cases per 100000 population of primary CNS tumours could be due to more prevalent of the disease in the population, but more liberal use and wider availability of neuroimaging studies could be a significant contributing factor especially for the observed increase in annual number of cases per 100000 population of the benign histologies. Besides, since we documented only operated cases, the easier acceptance of surgery by patients for incidentomas, as well as not overtly symptomatic tumours could also be a factor.
Concerning brain metastases requiring surgical excision, the 5-year average annual number of cases per 100000 population had increased by 74% from the period of 2006–2010 to the period of 2011–2015. This was probably due to the much longer overall survival of patients suffering from systemic cancers with newer anticancer agents, which unfortunately still fail to penetrate the blood brain barrier. The “true” incidence rates of brain metastases must be much higher than our histologically confirmed annual number of cases per 100000 population, since only patients with good clinical status undergo surgical excision for larger cerebral metastasis, and smaller tumours may be treated with radiosurgery or simply put under observation.
In Hong Kong, we do have a cancer registry run by the Hospital Authority of Hong Kong; however, up to the present time, only malignant tumours are being registered. Thus, there were only 201 cases of “brain and nervous system” tumours in the whole territory of Hong Kong in 2015, given an incidence rate of only 2.8 cases per 100000 population [14]. Two early single-institute reports of “nervous system”/intracranial tumours in Hong Kong, published in 1973 and 1979, focused on the relative proportion of several common types of tumours [12,27]. In those days, gliomas were the commonest type of intracranial tumours (44.0–48.7%), followed by meningiomas (12.2–25.0%), and pituitary adenomas (9–21%), as evidenced by the data from the US of the same period. The relative proportions of common types of tumours remained unchanged in a report by Ng et al. [20] in 1988. More importantly, Ng et al. [20] noted the necessity to document clearly the methods of a study, such as whether spinal cord tumours and autopsy cases were included, and whether diagnosis was histologically confirmed and properly reviewed.
A more recent report of a 1-year data (from July 2008 to June 2009) collected from all seven Hospital Authority neurosurgical units and eight private clinics in Hong Kong showed changes in the relative proportions of several common types of CNS tumours [26]. Akin to international data, meningiomas had become the commonest type of primary CNS tumours (23.9%); pituitary adenomas (16.6%) was the second commonest, instead of gliomas (12%) [11,16,17,22,24,25]. The incidence rates were also calculated for all primary CNS tumours (14.7/100000), meningiomas (3.5/100000), high grade gliomas (1/100000), and glioblastomas (<1/100000). Albeit their methodology was not well-documented, for examples : the definition of CNS tumours was not mentioned (probably only include intracranial tumours), the percentage of cases diagnosed by histology or radiology were not shown (except for vestibular schwannomas), the WHO histologies and histology groupings were not strictly followed, and there were a high percentage of “unconfirmed” and unspecified tumours (“other tumours”, “noncentral nervous system tumour”, “tumours of the sellar”). Comparing to our study, they reported a higher incidence rate of primary CNS tumours of 14.7 per 100000 population (ours 10.34 per 100000) (Table 4). Possible causes for our lower rate are 1) we excluded cases diagnosed with radiology without histological confirmation; and 2) they probably included some non-CNS tumours as defined by CBTRUS as mentioned above. They also reported slightly higher incidence rates of meningioma and pituitary adenomas than us, again probably due to their inclusion of cases diagnosed by radiology only. On the other hand, both studies reported similar incidence rates of glioblastomas (Table 4). This is probably because these tumours are almost all operated on and their histological definitions are quite universal. The above-mentioned discrepancies and similarities demonstrate the importance of standardizing the definitions of CNS tumours in epidemiology studies. Certainly, our results are not representative of the CNS tumour epidemiology in the entire Hong Kong, but our study shows the right direction to pursue.
Regionally, the Republic of Korea has one of the best available epidemiology statistics on primary CNS tumours, with clearly documented definitions as those of the CBTRUS [11,16,17]. In 2010, they first published the statistics of the incidence of CNS tumours in the year of 2005 in the Korean population [17], and has updated their statistics with the data of 2010, and 2013 [11,16]. Both radiologically-diagnosed and histologically-confirmed CNS tumours were included. The number of registered cases had increased from 5692 in 2005 to 11827 in 2013. The incidence of primary CNS tumours also had increased from 11.69 per 100000 population in 2005 to 23.39 per 100000 population in 2013. In our study, we had much lower annual number of cases per 100000 population of primary CNS tumours in the same years, and a much lower percentage of increase through the period (7.37/100000 population in 2005, and 9.74/100000 population in 2013) (Table 3). However, if solely comparing the relative frequencies of common tumour histologies revealed by our study and the Korean studies, the distributions were similar – meningioma was the commonest, followed by glioma or pituitary adenoma, while nerve sheath tumour came fourth (Table 1).
Comparing our findings to those from the CBTRUS in the period of years from 2009 to 2013, the overall incidence of primary CNS tumours in the United States (22.36/100000 population, age-adjusted) was nearly two times that of our finding (11.54/100000, crude rate). Again, if solely comparing the relative frequencies of common histologies revealed by the two studies, the distributions were similar – meningioma was the commonest, followed by glioma, while pituitary adenoma came third, and nerve sheath tumour came fourth (Table 1). The differences among the overall incidence of primary CNS tumours in Hong Kong, Korea and the United States, represents either true differences in the disease prevalence or apparent discrepancies due to methodology of the studies. It requires further better-structured, larger scale prospective local data collection to give a definitive answer.
Although our study has all the obviously limitations associated with a retrospective study of a small total case number, it has highlighted several key points in the process to establish a CNS tumour epidemiology registry for a population – it is essential to start with clear definitions (site definition, histological definition), have clear documentation of the details of data collection and analysis processes (e.g., record whether the mode of diagnosis is imaging or histology), adopt the current international standards, and constant review to fine-tune a data collecting and analysis system. Lastly, we would like to propose to register whether a CNS tumour is symptomatic or an incidental finding upon diagnosis. This parameter is also important when comparing incidence rates across different geographic locations and time periods.
Our small-scale retrospective study of CNS tumour epidemiology revealed increasing trends in annual number of cases per 100000 population for several common CNS tumour histologies in our local community, which agrees with the findings in large-scale studies in Korea and the United States. And the relative frequencies of these common tumour histologies are similar in different geographic regions. It is important for different geographic locations to establish their own CNS tumour registry with well-defined and structured data collection and analysis system, and to continue to fine-tune their systems to meet the international standards.
Notes
References
1. Census and Statistics Department of Hong Kong. Hong Kong 2011 Population Census - Summary Results. Hong Kong: Census And Statistics Department of Hong Kong;2012.
2. Census and Statistics Department of Hong Kong. Hong Kong 2001 population census main report, Vols. I & II. Hong Kong: Census And Statistics Department of Hong Kong;2012.
3. Census and Statistics Department of Hong Kong. Hong Kong 2006 population by-census main report: volume I. Hong Kong: Census And Statistics Department of Hong Kong;2007.
4. Census and Statistics Department of Hong Kong. Hong Kong 2016 Population By-Census - Main Results. Hong Kong: Census And Statistics Department of Hong Kong;2017.
5. Census and Statistics Department of Hong Kong. Population and household statistics analysed by district council district - 2001. Hong Kong: Census And Statistics Department of Hong Kong;2002.
6. Census and Statistics Department of Hong Kong. Population and household statistics analysed by district council district - 2003. Hong Kong: Census And Statistics Department of Hong Kong;2003.
7. Census and Statistics Department of Hong Kong. Population and household statistics analysed by district council district - 2010. Hong Kong: Census And Statistics Department of Hong Kong;2011.
8. Census and Statistics Department of Hong Kong. Population and household statistics analysed by district council district - 2016. Hong Kong: Census And Statistics Department of Hong Kong;2017.
9. Census and Statistics Department, Hong Kong Special Administrative Region. Hong Kong monthly digest of statistic. Hong Kong: Census and Statistics Department, Hong Kong Special Administrative Region;2016.
10. Census and Statistics Department, Hong Kong Special Administrative Region. Hong Kong monthly digest of statistic. Hong Kong: Census and Statistics Department, Hong Kong Special Administrative Region;2017.
11. Dho YS, Jung KW, Ha J, Seo Y, Park CK, Won YJ, et al. An updated nationwide epidemiology of primary brain tumors in Republic of Korea, 2013. Brain Tumor Res Treat. 5:16–23. 2017.

12. Ho-Cheong H. Intracranial tumours among Chinese in Hong Kong. Surg Neurol. 12:317–318. 1979.
13. Hospital Authority. Hospital Authority Statistical Report (2016-2017). Hong Kong: Hospital Authority;2018.
14. Hong Kong Cancer Registry. Hong Kong Cancer Statistics. Hong Kong: Hong Kong Cancer Registry;2015.
15. Hong Kong Cancer Registry. Overview of Hong Kong Cancer Statistics of 2016. Hong Kong: Hong Kong Cancer Registry;2018.
16. Jung KW, Ha J, Lee SH, Won YJ, Yoo H. An updated nationwide epidemiology of primary brain tumors in republic of Korea. Brain Tumor Res Treat. 1:16–23. 2013.

17. Lee CH, Jung KW, Yoo H, Park S, Lee SH. Epidemiology of primary brain and central nervous system tumors in Korea. J Korean Neurosurg Soc. 48:145–152. 2010.

18. Louis DN, Ohgaki H, Wiestler OD, Cavenee WK, Burger PC, Jouvet A, et al. The 2007 WHO classification of tumours of the central nervous system. Acta Neuropathol. 114:97–109. 2007.

19. Louis DN, Perry A, Reifenberger G, von Deimling A, Figarella-Branger D, Cavenee WK, et al. The 2016 World Health Organization classification of tumors of the central nervous system: a summary. Acta Neuropathol. 131:803–820. 2016.

20. Ng HK, Poon WS, South JR, Lee JC. Tumours of the central nervous system in Chinese in Hong Kong: a histological review. Aust N Z J Surg. 58:573–578. 1988.

21. Ostrom QT, Gittleman H, Farah P, Ondracek A, Chen Y, Wolinsky Y, et al. CBTRUS statistical report: primary brain and central nervous system tumors diagnosed in the United States in 2006-2010. Neuro Oncol. 15 Suppl 2:ii1–ii56. 2013.

22. Ostrom QT, Gittleman H, Fulop J, Liu M, Blanda R, Kromer C, et al. CBTRUS statistical report: primary brain and central nervous system tumors diagnosed in the United States in 2008-2012. Neuro Oncol. 17 Suppl 4:iv1–iv62. 2015.

23. Ostrom QT, Gittleman H, Liao P, Rouse C, Chen Y, Dowling J, et al. CBTRUS statistical report: primary brain and central nervous system tumors diagnosed in the United States in 2007-2011. Neuro Oncol. 16 Suppl 4:iv1–iv63. 2014.

24. Ostrom QT, Gittleman H, Liao P, Vecchione-Koval T, Wolinsky Y, Kruchko C, et al. CBTRUS statistical report: primary brain and other central nervous system tumors diagnosed in the United States in 2010-2014. Neuro Oncol. 19(suppl_5):v1–v88. 2017.

25. Ostrom QT, Gittleman H, Xu J, Kromer C, Wolinsky Y, Kruchko C, et al. CBTRUS statistical report: primary brain and other central nervous system tumors diagnosed in the United States in 2009-2013. Neuro Oncol. 18(suppl_5):v1–v75. 2016.

26. Pu JK, Ng GK, Leung GK, Wong CK. One-year review of the incidence of brain tumours in Hong Kong Chinese patients as part of the Hong Kong brain and spinal tumours registry. Surgical Practice. 16:133–136. 2012.

27. Wen HL, Cheung SY. Incidence of tumors in the nervous system in Hong Kong. J International surgery. 58:555–556. 1973.
28. Zülch KJ. Histological typing of tumours of the central nervous system. Geneva: World Health Organization;1979.
Fig. 2.
Population in the catchment area of NTWC and total population of Hong Kong. The change from 2001 to 2002 represents a relocation of neurosurgical service of a hospital to another cluster. *The population in the NTWC catchment area (unit : million). †The mid-year total population of Hong Kong (unit : million). ‡The percentage of the population in the NTWC catchment area over the mid-year total population of Hong Kong. NTWC : New Territory West Cluster.
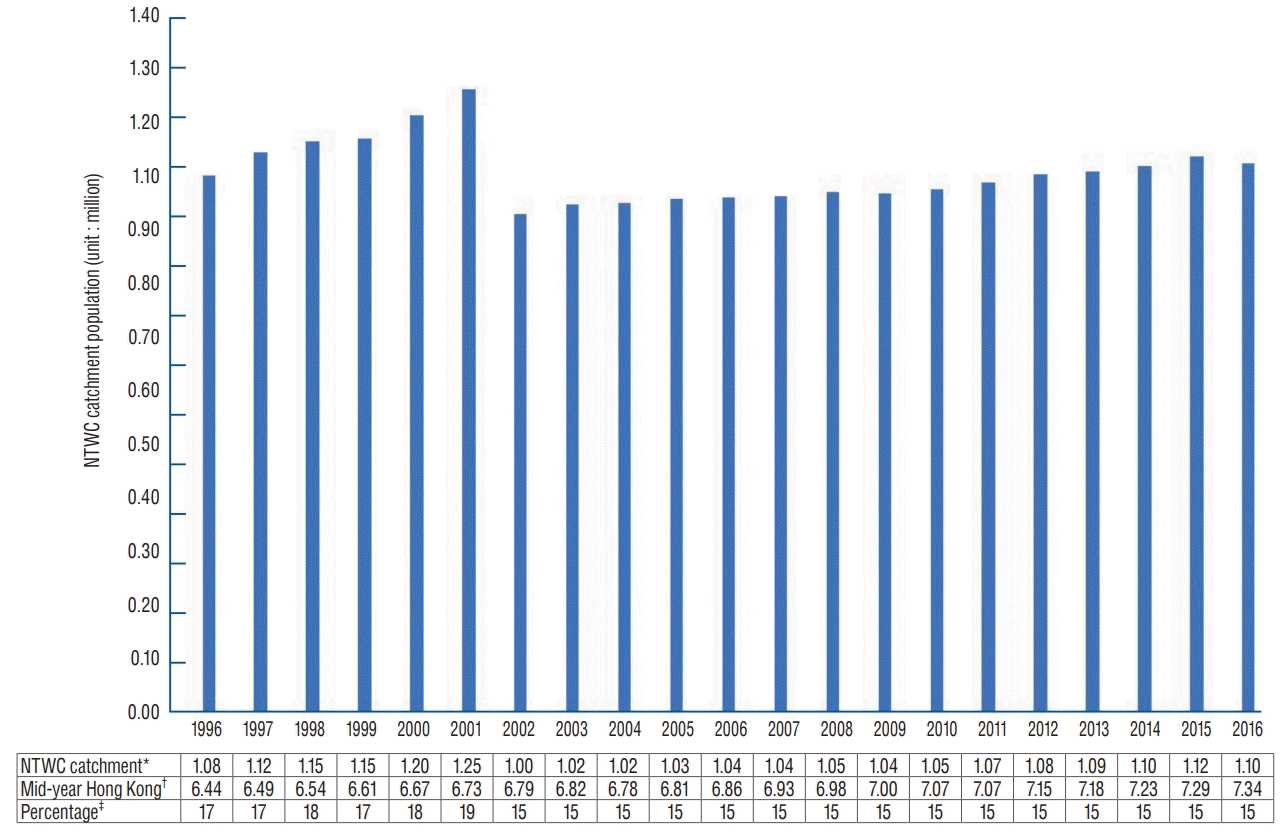
Fig. 3.
Annual number of cases of intracranial glioma. The pathological grade of intracranial glioma is based on the World Health Organization Classification of Tumors of the Central Nervous System applicable to the year of histological diagnosis.
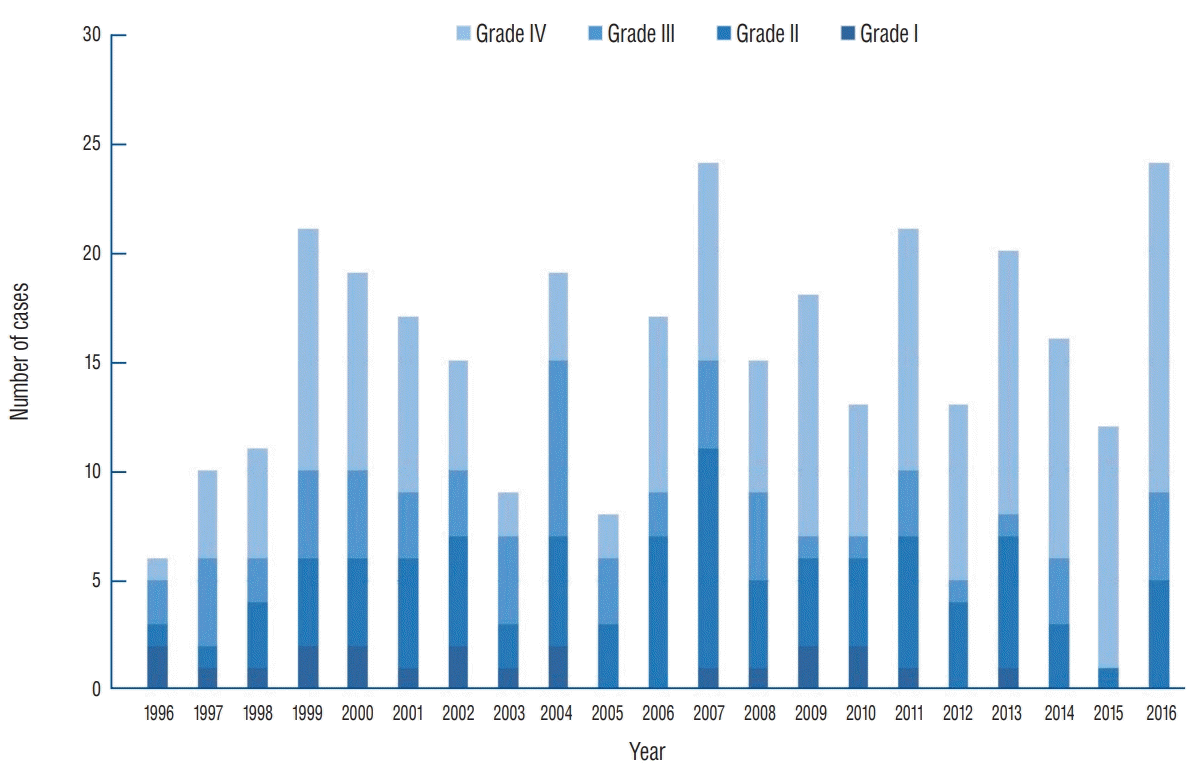
Fig. 4.
The distribution of primary intracranial tumours by age at diagnosis. The distribution is right-skewed with most intracranial tumours diagnosed at 50–55 age group.
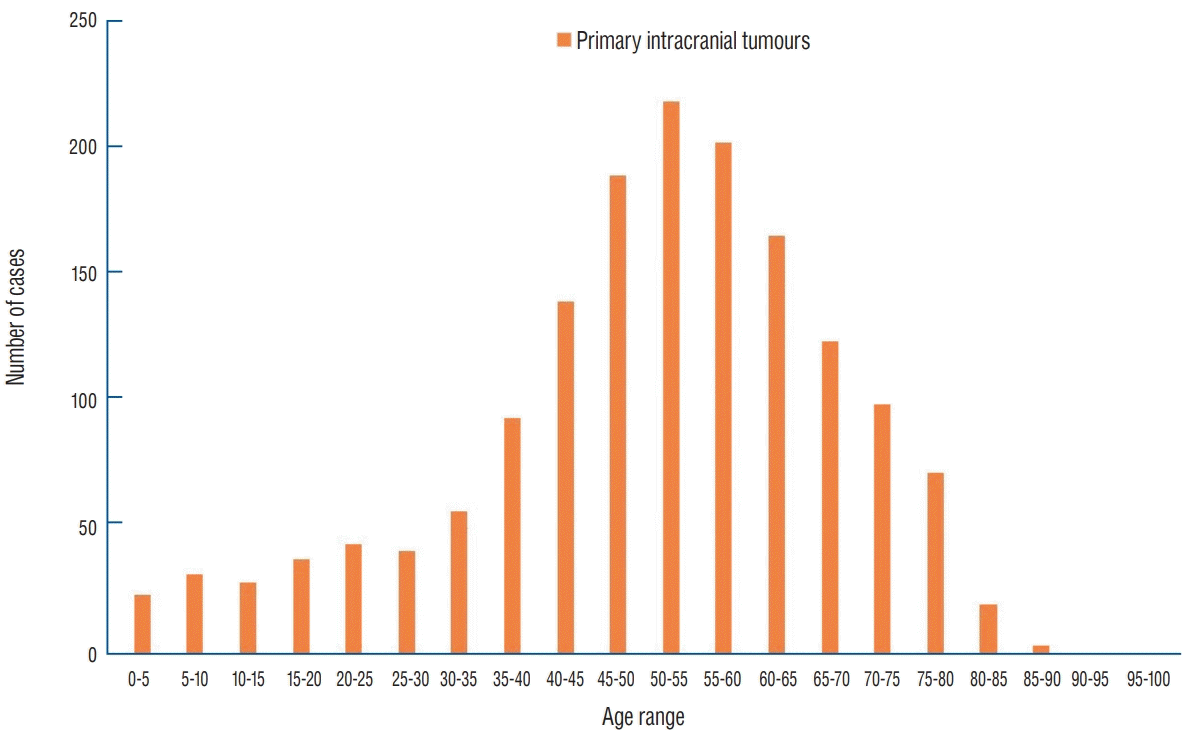
Fig. 5.
Distribution of primary and metastasis intracranial tumours by age at diagnosis and histology.
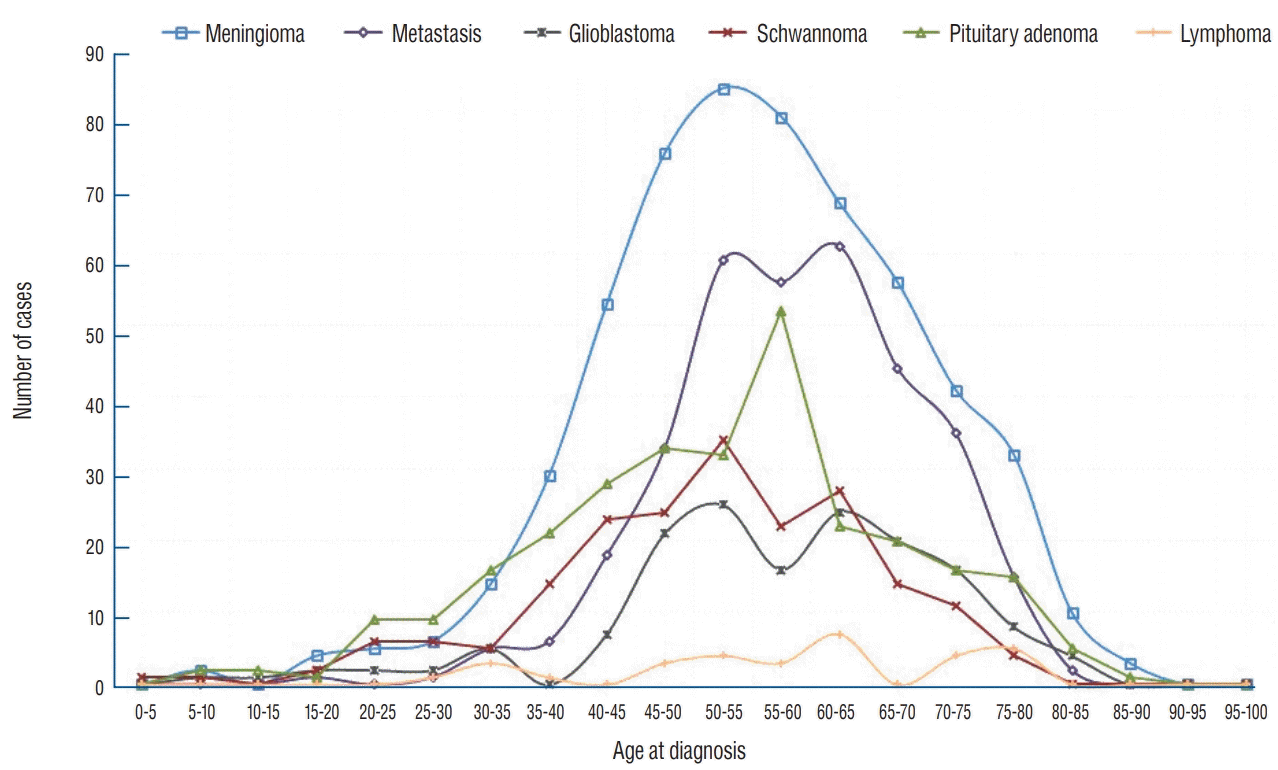
Fig. 6.
Distribution of intracranial tumours by sex. Different histological types of intracranial tumours are represented by the bar, with its length corresponding to the actual number of cases. *For statistically significant differences between male and female patients.
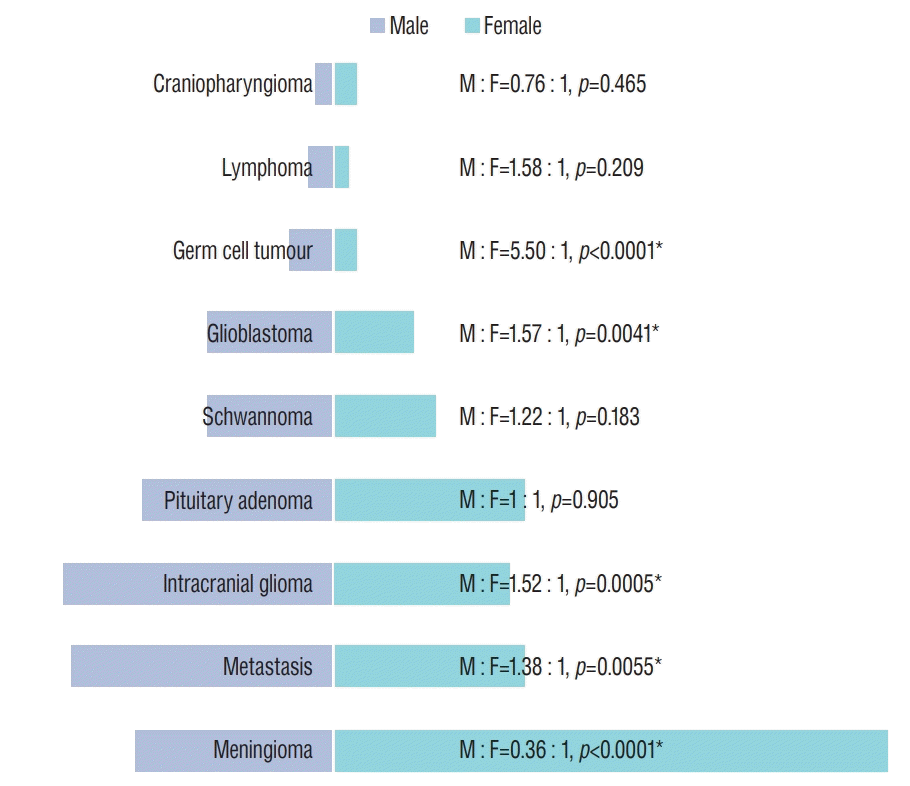
Fig. 7.
The 5-year average annual number of cases for intracranial tumours (unit : per 100000 population).
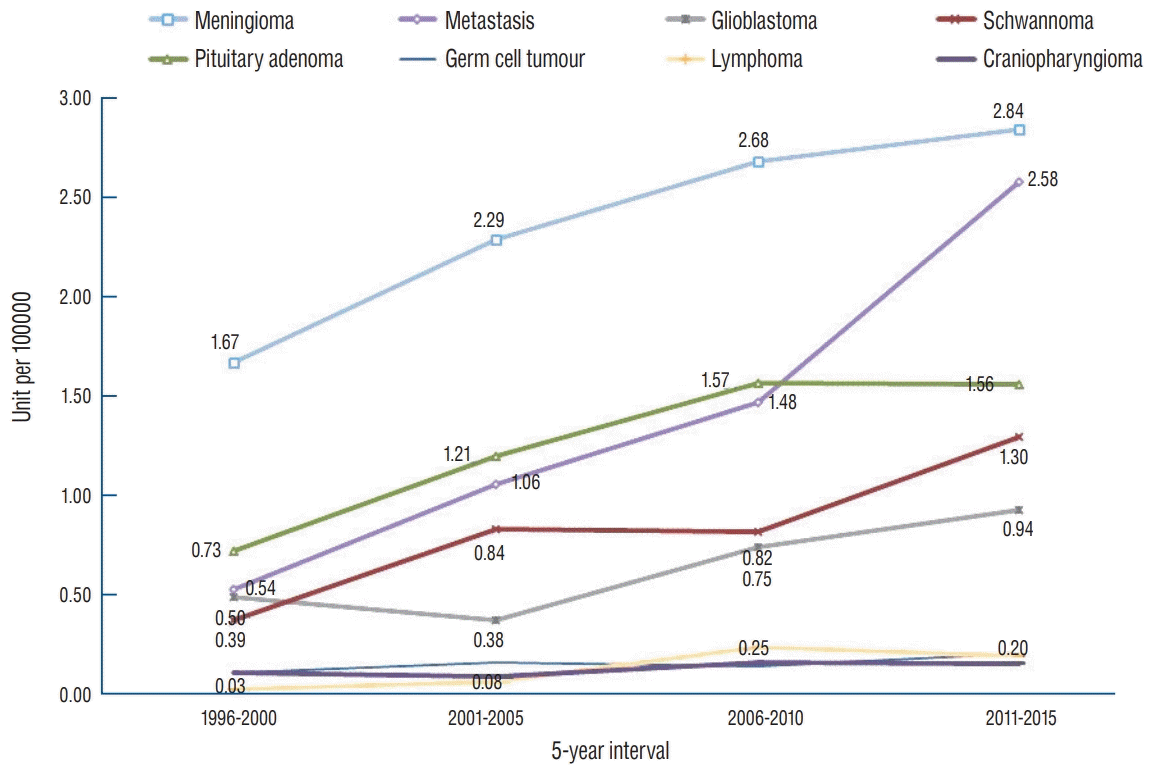
Fig. 8.
The 5-year average annual number of cases for intracranial glioma by different WHO grading (unit : per 100000 population). The pathological grade of intracranial glioma is based on the WHO Classification of Tumors of the Central Nervous System applicable to the year of histological diagnosis. WHO : World Health Organization.
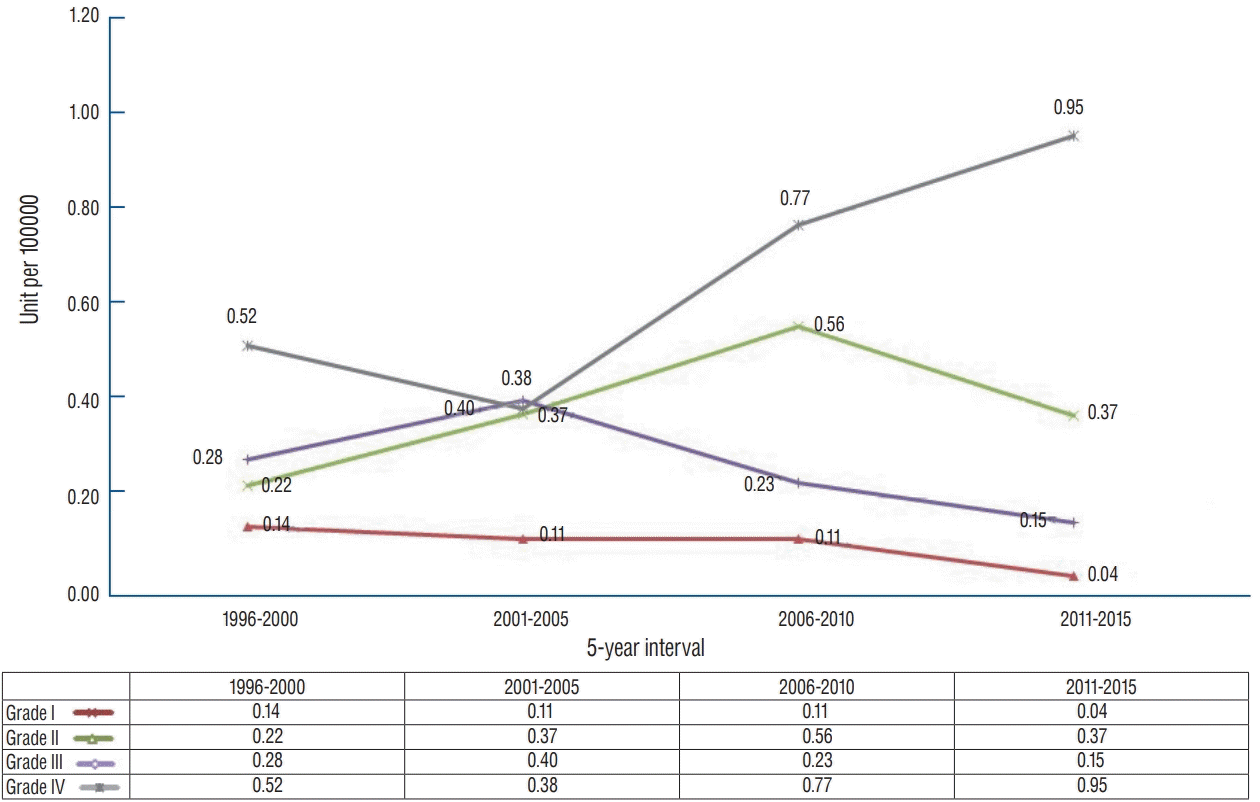
Fig. 10.
The 5-year average annual numbers of cases for different primary spinal tumours (unit : per 100000 population).
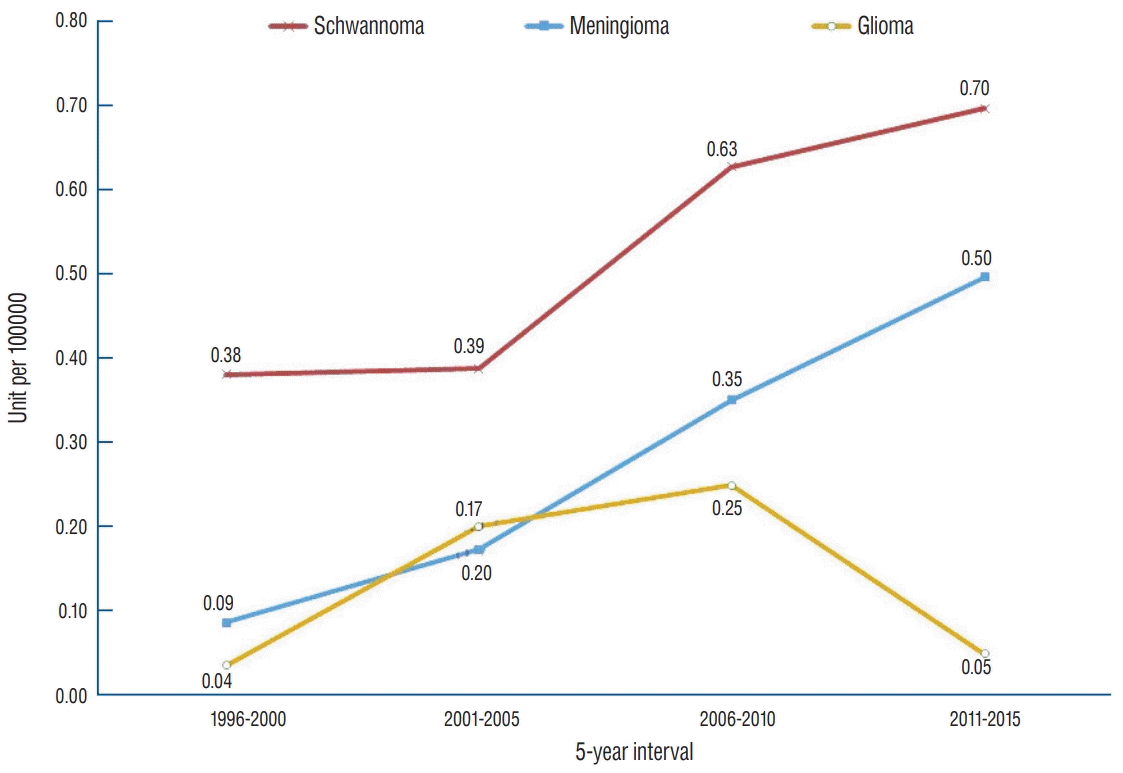
Fig. 11.
The 5-year average of annual numbers of cases for primary central nervous system tumours (unit : per 100000 population).
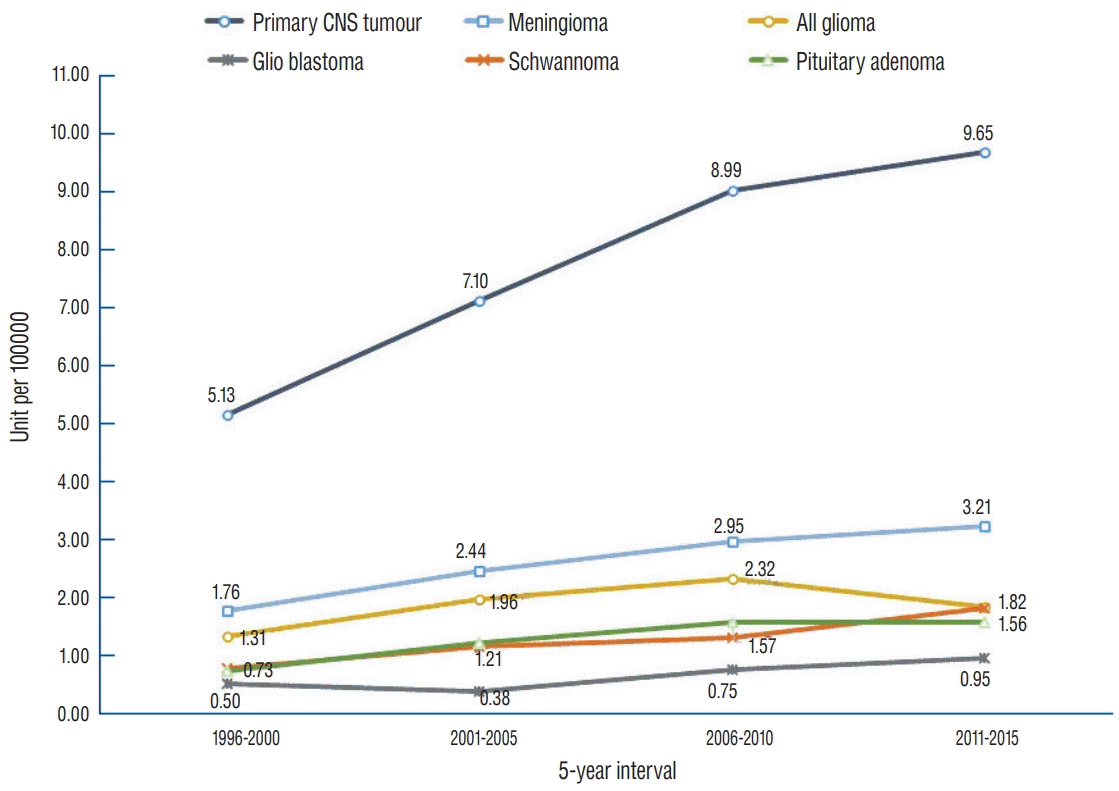
Table 1.
Distribution of CNS tumours by histology group
| Histology |
All |
Intracranial |
Spinal |
||||||
|---|---|---|---|---|---|---|---|---|---|
| 20-year total | % of all primary CNS tumours | % of all CNS tumours | 20-year total | % of all primary Intracranial tumours | % of all Intracranial tumours | 20-year total | % of all primary spinal tumours | % of all spinal tumours | |
| Diffuse astrocytic and oligodendroglial tumours | 296 | 16.5 | 13.9 | 287 | 17.9 | 14.8 | 9 | 4.7 | 4.5 |
| Diffuse astrocytoma | 44 | 2.5 | 2.1 | 39 | 2.4 | 2.0 | 5 | 2.6 | 2.5 |
| Anaplastic astrocytoma | 24 | 1.3 | 1.1 | 24 | 1.5 | 1.2 | 0 | 0.0 | 0.0 |
| Glioblastoma | 155 | 8.6 | 7.3 | 154 | 9.6 | 8.0 | 1 | 0.5 | 0.5 |
| Oligodendroglioma | 28 | 1.6 | 1.3 | 28 | 1.8 | 1.4 | 0 | 0.0 | 0.0 |
| Anaplastic oligodendroglioma | 12 | 0.7 | 0.6 | 12 | 0.8 | 0.6 | 0 | 0.0 | 0.0 |
| Oligoastrocytoma | 1 | 0.1 | 0.0 | 1 | 0.1 | 0.1 | 0 | 0.0 | 0.0 |
| Anaplastic oligoastrocytoma | 0 | 0.0 | 0.0 | 0 | 0.0 | 0.0 | 0 | 0.0 | 0.0 |
| Gliomatosis cerebri | 2 | 0.1 | 0.1 | 2 | 0.1 | 0.1 | 0 | 0.0 | 0.0 |
| Low grade glioma, NOS | 16 | 0.9 | 0.7 | 14 | 0.9 | 0.7 | 2 | 1.0 | 1.0 |
| High grade glioma, NOS | 14 | 0.8 | 0.7 | 13 | 0.8 | 0.7 | 1 | 0.5 | 0.5 |
| Other astrocytic tumours | 21 | 1.2 | 1.0 | 21 | 1.3 | 1.1 | 0 | 0.0 | 0.0 |
| Pilocytic astrocytoma | 19 | 1.1 | 0.9 | 19 | 1.2 | 1.0 | 0 | 0.0 | 0.0 |
| Anaplastic pleomorphic xanthoastrocytoma | 2 | 0.1 | 0.1 | 2 | 0.1 | 0.1 | 0 | 0.0 | 0.0 |
| Ependymal tumours | 34 | 1.9 | 1.6 | 19 | 1.2 | 1.0 | 15 | 7.8 | 7.6 |
| Ependymoma | 30 | 1.7 | 1.4 | 15 | 0.9 | 0.8 | 15 | 7.8 | 7.6 |
| Subependymoma | 2 | 0.1 | 0.1 | 2 | 0.1 | 0.1 | 0 | 0.0 | 0.0 |
| Myxopapillary ependymoma | 0 | 0.0 | 0.0 | 0 | 0.0 | 0.0 | 0 | 0.0 | 0.0 |
| Anaplastic ependymoma | 2 | 0.1 | 0.1 | 2 | 0.1 | 0.1 | 0 | 0.0 | 0.0 |
| Other gliomas | 2 | 0.1 | 0.1 | 2 | 0.1 | 0.1 | 0 | 0.0 | 0.0 |
| Astroblastoma | 2 | 0.1 | 0.1 | 2 | 0.1 | 0.1 | 0 | 0.0 | 0.0 |
| Choroid plexus tumours | 4 | 0.2 | 0.2 | 4 | 0.3 | 0.2 | 0 | 0.0 | 0.0 |
| Choroid plexus papilloma | 2 | 0.1 | 0.1 | 2 | 0.1 | 0.1 | 0 | 0.0 | 0.0 |
| Atypical choroid plexus papilloma | 2 | 0.1 | 0.1 | 2 | 0.1 | 0.1 | 0 | 0.0 | 0.0 |
| Neuronal and mixed neuronalglial tumours | 24 | 1.3 | 1.1 | 22 | 1.4 | 1.1 | 2 | 1.0 | 1.0 |
| Dysembryoplastic neuroepithelial tumours | 2 | 0.1 | 0.1 | 2 | 0.1 | 0.1 | 0 | 0.0 | 0.0 |
| Gangliocytoma | 5 | 0.3 | 0.2 | 5 | 0.3 | 0.3 | 0 | 0.0 | 0.0 |
| Ganglioglioma | 7 | 0.4 | 0.3 | 6 | 0.4 | 0.3 | 1 | 0.5 | 0.5 |
| Central neurocytoma | 5 | 0.3 | 0.2 | 5 | 0.3 | 0.3 | 0 | 0.0 | 0.0 |
| Papillary glioneuronal tumour | 2 | 0.1 | 0.1 | 2 | 0.1 | 0.1 | 0 | 0.0 | 0.0 |
| Paraganglioma | 3 | 0.2 | 0.1 | 2 | 0.1 | 0.1 | 1 | 0.5 | 0.5 |
| Embryonal tumour | 30 | 1.7 | 1.4 | 27 | 1.7 | 1.4 | 3 | 1.6 | 1.5 |
| Medulloblastoma | 15 | 0.8 | 0.7 | 14 | 0.9 | 0.7 | 1 | 0.5 | 0.5 |
| PNET | 12 | 0.7 | 0.6 | 10 | 0.6 | 0.5 | 2 | 1.0 | 1.0 |
| Atypical teratoid/rhaboid tumour | 3 | 0.2 | 0.1 | 3 | 0.2 | 0.2 | 0 | 0.0 | 0.0 |
| Tumours of the cranial and paraspinal nerves | 295 | 16.5 | 13.8 | 197 | 12.3 | 10.2 | 98 | 51.0 | 49.5 |
| Schwannoma | 291 | 16.2 | 13.6 | 195 | 12.2 | 10.1 | 96 | 50.0 | 48.5 |
| Neurofibroma | 4 | 0.2 | 0.2 | 2 | 0.1 | 0.1 | 2 | 1.0 | 1.0 |
| Meningiomas | 610 | 34.0 | 28.6 | 560 | 35.0 | 28.9 | 50 | 26.0 | 25.3 |
| Meningioma | 568 | 31.7 | 26.6 | 522 | 32.6 | 27.0 | 46 | 24.0 | 23.2 |
| Fibrous meningioma | 7 | 0.4 | 0.3 | 4 | 0.3 | 0.2 | 3 | 1.6 | 1.5 |
| Psammomatous meningioma | 2 | 0.1 | 0.1 | 1 | 0.1 | 0.1 | 1 | 0.5 | 0.5 |
| Angiomatous meningioma | 2 | 0.1 | 0.1 | 2 | 0.1 | 0.1 | 0 | 0.0 | 0.0 |
| Microcystic meningioma | 1 | 0.1 | 0.0 | 1 | 0.1 | 0.1 | 0 | 0.0 | 0.0 |
| Metaplastic meningioma | 1 | 0.1 | 0.0 | 1 | 0.1 | 0.1 | 0 | 0.0 | 0.0 |
| Chordoid meningioma | 1 | 0.1 | 0.0 | 1 | 0.1 | 0.1 | 0 | 0.0 | 0.0 |
| Atypical meningioma | 27 | 1.5 | 1.3 | 27 | 1.7 | 1.4 | 0 | 0.0 | 0.0 |
| Papillary meningioma | 0 | 0.0 | 0.0 | 0 | 0.0 | 0.0 | 0 | 0.0 | 0.0 |
| Anaplastic meningioma | 1 | 0.1 | 0.0 | 1 | 0.1 | 0.1 | 0 | 0.0 | 0.0 |
| Lymphoma | 31 | 1.7 | 1.5 | 31 | 1.9 | 1.6 | 0 | 0.0 | 0.0 |
| Germ cell tumours | 39 | 2.2 | 1.8 | 39 | 2.4 | 2.0 | 0 | 0.0 | 0.0 |
| Germinoma | 24 | 1.3 | 1.1 | 24 | 1.5 | 1.2 | 0 | 0.0 | 0.0 |
| Embryonal carcinoma | 3 | 0.2 | 0.1 | 3 | 0.2 | 0.2 | 0 | 0.0 | 0.0 |
| Yolk sac tumour | 2 | 0.1 | 0.1 | 2 | 0.1 | 0.1 | 0 | 0.0 | 0.0 |
| Choriocarcinoma | 2 | 0.1 | 0.1 | 2 | 0.1 | 0.1 | 0 | 0.0 | 0.0 |
| Teratoma | 8 | 0.4 | 0.4 | 0.0 | 0.0 | 0 | 0.0 | 0.0 | |
| Immature | 0.0 | 0.0 | 5 | 0.3 | 0.3 | 0 | 0.0 | 0.0 | |
| Mature | 0.0 | 0.0 | 3 | 0.2 | 0.2 | 0 | 0.0 | 0.0 | |
| Teratoma with malignant transformation | 1 | 0.1 | 0.0 | 1 | 0.1 | 0.1 | 0 | 0.0 | 0.0 |
| Mixed germ cell tumour | 1 | 0.1 | 0.0 | 1 | 0.1 | 0.1 | 0 | 0.0 | 0.0 |
| Tumours of sellar region | 315 | 17.6 | 14.8 | 315 | 19.7 | 16.3 | 0 | 0.0 | 0.0 |
| Craniopharyngioma | 30 | 1.7 | 1.4 | 30 | 1.9 | 1.5 | 0 | 0.0 | 0.0 |
| Pituitary adenoma | 285 | 15.9 | 13.4 | 285 | 17.8 | 14.7 | 0 | 0.0 | 0.0 |
| Metastasis | 342 | 16.0 | 336 | 17.4 | 6 | 3.0 | |||
| Primary* | 1792 | 1600 | 192 | ||||||
| Total* | 2134 | 1936 | 198 | ||||||
Table 2.
Annual number of cases per 100000 population of intracranial tumours, from 1996 to 2016
| Year | Primary intracranial brain tumours* | Meningioma | All gliomas | Glioblastoma | Schwannoma | Pituitary adenoma | Germ cell tumour | Lymphoma | Craniopharyngioma |
|---|---|---|---|---|---|---|---|---|---|
| 2016 | 10.15 | 4.26 | 2.17 | 1.27 | 1.36 | 1.00 | 0.27 | 0.09 | 0.00 |
| 2015 | 9.04 | 3.22 | 1.07 | 0.89 | 1.61 | 1.61 | 0.27 | 0.36 | 0.18 |
| 2014 | 8.83 | 2.73 | 1.46 | 0.91 | 0.82 | 1.37 | 0.36 | 0.09 | 0.36 |
| 2013 | 8.27 | 2.66 | 1.84 | 1.10 | 1.47 | 1.10 | 0.09 | 0.18 | 0.09 |
| 2012 | 7.78 | 2.13 | 1.20 | 0.74 | 1.76 | 1.76 | 0.09 | 0.19 | 0.19 |
| 2011 | 8.91 | 3.47 | 1.97 | 1.03 | 0.84 | 1.97 | 0.28 | 0.19 | 0.00 |
| 2010 | 9.03 | 4.28 | 1.24 | 0.57 | 0.95 | 1.24 | 0.10 | 0.48 | 0.10 |
| 2009 | 8.05 | 2.68 | 1.73 | 1.05 | 0.58 | 1.44 | 0.10 | 0.29 | 0.19 |
| 2008 | 7.07 | 1.91 | 1.43 | 0.57 | 1.05 | 2.01 | 0.00 | 0.19 | 0.19 |
| 2007 | 8.96 | 2.31 | 2.31 | 0.87 | 0.77 | 2.02 | 0.39 | 0.19 | 0.29 |
| 2006 | 6.76 | 2.22 | 1.64 | 0.68 | 0.77 | 1.16 | 0.19 | 0.10 | 0.10 |
| 2005 | 6.59 | 2.71 | 0.78 | 0.19 | 0.58 | 1.65 | 0.10 | 0.19 | 0.00 |
| 2004 | 6.45 | 2.25 | 1.86 | 0.39 | 0.88 | 0.88 | 0.10 | 0.10 | 0.00 |
| 2003 | 4.80 | 0.98 | 0.88 | 0.20 | 0.69 | 1.37 | 0.20 | 0.10 | 0.10 |
| 2002 | 8.10 | 3.20 | 1.50 | 0.50 | 1.40 | 1.10 | 0.30 | 0.00 | 0.40 |
| 2001 | 6.15 | 2.32 | 1.36 | 0.64 | 0.64 | 1.04 | 0.16 | 0.00 | 0.00 |
| 2000 | 6.08 | 2.58 | 1.58 | 0.75 | 0.33 | 1.08 | 0.25 | 0.00 | 0.08 |
| 1999 | 5.29 | 1.56 | 1.82 | 0.95 | 0.52 | 0.87 | 0.09 | 0.00 | 0.09 |
| 1998 | 4.62 | 1.39 | 0.96 | 0.35 | 0.44 | 0.96 | 0.00 | 0.17 | 0.17 |
| 1997 | 3.65 | 1.25 | 0.89 | 0.36 | 0.27 | 0.27 | 0.27 | 0.00 | 0.18 |
| 1996 | 3.24 | 1.57 | 0.56 | 0.09 | 0.37 | 0.46 | 0.00 | 0.00 | 0.09 |
Table 3.
Annual number of cases per 100000 population of CNS tumours, from 1996 to 2016
Table 4.
Comparison of common primary CNS tumours in different geographic regions
| Study | Geographic region | Total number of primary CNS tumours* | % of histological diagnosis | % of imaging diagnosis |
Incidence rates†/annual number of cases (unit per 100000 population) |
|||||||
|---|---|---|---|---|---|---|---|---|---|---|---|---|
| Primary CNS tumours | Meningioma | All gliomas | Glioblastoma | Pituitary adenoma | Nerve sheath tumours | Lymphoma | Germ cell | |||||
| 2009–2013 | ||||||||||||
| CBTRUS | U.S. | 368117 | 59.6 | 40.4 | 22.36 | 8.03 | 6.27 | 3.20 | 3.66 | 1.82 | 0.43 | 0.1 |
| Korea 2017 | Korea | 11827 | 47.8 | 52.2 | 23.39 | 8.72 | 3.18 | 1.24 | 4.2 | 2.88 | 0.44 | 0.25 |
| Present study | Hong Kong | 2134 | 100.0 | 0.0 | 9.57 | 3.36 | 2.05 | 0.92 | 1.50 | 1.66 | 0.26 | 0.13 |
| 2004–2006 | ||||||||||||
| Korea 2010 | Korea | 5692 | 58.1 | 41.9 | 11.69 | 3.46 | 1.87 | 1 | 0.62 | 1.30 | 0.21 | 0.21 |
| Present study | Hong Kong | 264 | 100 | 0.0 | 7.22 | 2.49 | 2.01 | 0.42 | 1.30 | 1.10 | 0.13 | 0.13 |
| 2008–2009 | ||||||||||||
| HK 2009 | Hong Kong | 1031 | N/A‡ | N/A‡ | 10.8 | 2.58 | 1.30 | 0.74 | 1.79 | 0.97 | 0.14 | 0.16 |
| Present study | Hong Kong | 219 | 100.0 | 0.0 | 8.76 | 2.30 | 1.96 | 0.72 | 1.72 | 0.81 | 0.24 | 0.05 |


 PDF
PDF Citation
 Print
Print


 XML Download