Journal List > J Korean Neurosurg Soc > v.62(2) > 1160701

Eom and KNTDB Investigators: Epidemiology and Outcomes of Traumatic Brain Injury in Elderly Population : A Multicenter Analysis Using Korean Neuro-Trauma Data Bank System 2010–2014

Abstract

Objective

Although traumatic brain injury (TBI) occurs in people of all age groups, the elderly population is at a particular risk. The proportion of elderly population in the society is markedly increasing and Korea is one of the most rapidly aging societies. Here, we analyzed the data from 904 patients older over 65 years who were registered in the Korean Neuro-Trauma Data Bank System (KNTDBS).

Methods

The Korean Society of Neurotraumatology recorded data from 20 institutions between September 2010 and March 2014. This retrospective study examined the clinical epidemiology, sex difference, outcome epidemiology, sociodemographic variables, and outcomes in the geriatric population related to TBI based on data from the KNTDBS.

Results

The study included 540 men and 364 women. The age distributions in the male and female groups were statistically significantly different. The most common cause of trauma was a fall and diagnosis was acute subdural hematoma. The incidence was the highest in men aged 80–84 years and in women aged 75–79 years. The most common time of arrival to hospital after TBI was within 1 hour and 119 rescue team provided first aid earliest to patients with TBI. The mortality rate stratified according to the cause of trauma was significantly different, with mortality rates of 3.77% in fall and 11.65% in traffic accident. The mortality rates according the severity of brain injury, Glasgow Coma Scale score, and treatment were statistically significant.

Conclusion

To our knowledge, this study is the first to focus on elderly patients with TBI in Korea and particularly investigate mortality and characteristics related to TBI-related death based on data from the KNTDBS. Although the study has some limitations, our results may be used to obtain useful information to study targeted prevention and more effective treatment options for older TBI patients and establish novel treatment guidelines and health polish for the geriatric population.

INTRODUCTION

Life expectancy has increased because of advancements in modern medical science and medical and welfare system; therefore, the proportion of elderly population in the society is markedly increasing. Korea is one of the most rapidly aging societies, in which people older than 65 years accounted for 12.4% in 2014, 13.2% in 2015, and 13.8% in 2017 of the overall population according to data released by the statistics of the Korea National Statistical Office (KNSO). This proportion is expected to increase to 47.7% in 2045 [9].
Although traumatic brain injury (TBI) occurs in people of all age groups, the geriatric population is at a particular risk [6,11]. Age could be the most significant factor in the prediction of outcomes according to most studies on TBI [7,13,15]. To the best of our knowledge, there is no published geriatric data from Korean studies, although many international studies have reported aspects of the epidemiology and outcomes in elderly patients with TBI. The Korean Society of Neurotraumatology established Korean guidelines for the treatment of severe brain injury in 2003, and the need for patient data treated according to these guidelines is increasing. The Korean Neuro-Trauma Data Bank System (KNTDBS) aims to evaluate and improve treatment outcomes for brain trauma, prevent trauma, and provide data for research [14]. Epidemiological studies of TBI are essential to record data on targeted prevention and effective treatment of patients with brain injury. This retrospective study examined the clinical epidemiology and outcomes with mortality rates of TBI in the geriatric population. We also investigated the sex difference, sociodemographic variables, mortality, and characteristics related to TBI-related death based on data from the KNTDBS.

MATERIALS AND METHODS

The Korean Society of Neurotraumatology recorded data from 2617 patients from 20 institutions between September 2010 and March 2014. The authors report no IBR approval because an individual was considered unable to give informed consent on this data bank system. We analyzed the data from 904 patients older over 65 years who were registered in the KNTDBS. Data were retrospectively reviewed from the medical records of patients admitted for TBI from 2009 to 2014. The aforementioned society established a KNTDBS website and provided identifications and passwords to the individuals at each institution assigned to input the data of trauma patients [13]. All patients admitted to the hospital with TBI were included. Exclusion criteria were severe extracranial injury, cerebral concussion, and chronic subdural hematoma. The demographic characteristics of patients, namely age distribution; cause, diagnosis, and severity of brain injury; Glasgow coma scale (GCS) score; treatment; and outcomes according to sex were investigated. The cause of trauma included fall, traffic accident (TA), assault, others, and unknown. Diagnoses included acute epidural hematoma (A-EDH), acute subdural hematoma (A-SDH), traumatic subarachnoid hemorrhage (T-SAH), contused intracranial hemorrhage (C-ICH), diffuse axonal injury (DAI), and others. We investigated the distributions of incidence, diagnosis, GCS score, outcomes, and treatment of TBI according to sex and age. Furthermore, we investigated the time interval from TBI to hospital admission and the people who provided the first aid treatment earliest to patients with TBI. We categorized patients into two groups (non-survivors and survivors) and compared and analyzed clinical variables related to death.

Statistical analyses

SPSS version 22.0 (IBM SPSS Inc., Armonk, NY, USA) was used for statistical analyses. The categorical variables were assessed using Pearson’s χ2 and fisher’s exact tests. The Mann-Whitney U test was used for continuous variables. p<0.05 was considered statistically significant.

RESULTS

Demographic characteristics of elderly patients with TBI according to sex

A total of 904 elderly patients with TBI were included in this study. The demographic characteristics of patients based on sex are summarized in Table 1. The study included 540 men (59.7%) and 364 women (40.3%). The age distributions in the male and female groups were statistically significantly different (p<0.001). The most common cause of trauma was a fall or negligent accident (44.0%; n=398), followed by TA (27.5%; n=249), unavailable causes (10.7%; n=97), unknown causes (9.6%; n=87), others (6.4%; n=58), and assault (1.7%; n=15). The difference in the causes of trauma according sex was not statistically significant (p=0.194). The diagnosis of the admitted patients was determined by the most prominent injury that led to admission. The most common diagnosis was ASDH (50%; n=452), followed by others (including skull fractures, massive scalp flap wound, and mild head injury with GCS score ≥14; 18.3%; n=165), T-SAH (15.3%; n=138), A-EDH (6.5%; n=59), C-ICH (9.6%; n=87), and DAI (0.3%; n=3). The difference in the diagnoses according to the sex was not statistically significant (p=0.075). The severity of brain injury was categorized into three grades : mild, moderate, and severe. Overall, 559 patients (61.8%) showed mild, 210 (23.2%) showed moderate, and 135 (14.9%) showed severe brain injury. The severity of brain injury in the male verse female groups was not significantly different (p=0.764). A total of 660 patients (73.0%) received non-surgical treatment, and 244 (27.0%) received surgical treatment; this difference according to sex was not statistically significant (p=0.731). The GCS score at admission verse discharge showed that 72.7% verse 77.5% of patients had a GCS score of 13–15, 11.7% verse 7.3% had a GCS score of 9–12, and 15.6% verse 8.7% had a GCS score of 3–8. Among 904 patients, 846 (93.6%) survived and 58 (6.4%) died. The GCS score at admission and discharge and death was not significantly different (p=0.939 and 0.882, respectively).

Incidence of elderly patients with TBI according to age and sex

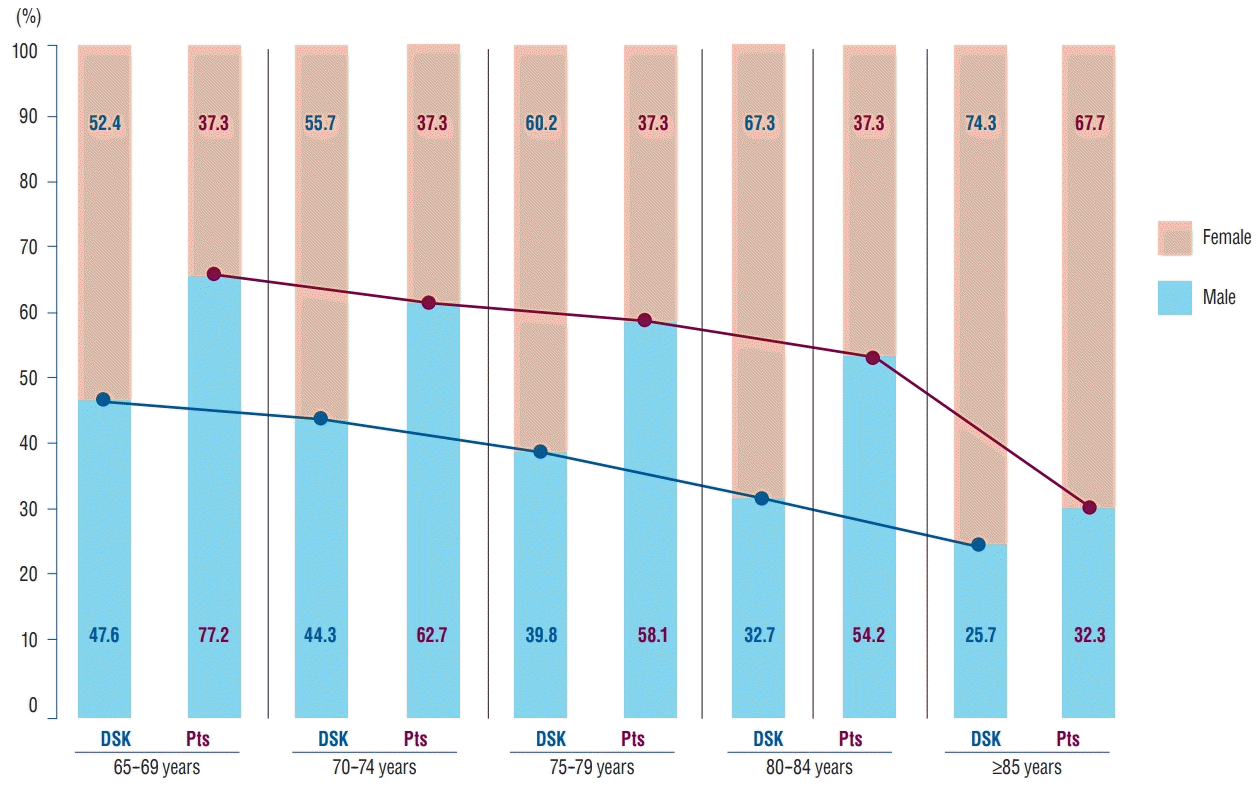
The incidence of TBI in elderly patients according to age and sex is shown in Table 2 and Fig. 1. On the basis of demographic statistics of the KNSO, in March 2014, the trauma incidence was the highest in men aged 80–84 years (0.027%; n=64) and in women aged 75–79 years (0.012%; n=91) [9]. However, the incidence according the age group are roughly similar and not significantly different (Table 2). According to the demographic statistics of the KNSO, in March 2014, more women than men were older than 65 years (male : female=1.0 : 1.1). With an increasing age of elderly patients, the population of women increased more than that of men; the male:female ratio in the older than 85 years age group was 1 : 1.4. Nonetheless, the frequency of TBI was higher in elderly men than in elderly women in all age groups (Fig. 1).

Diagnosis of elderly patients with TBI according to age

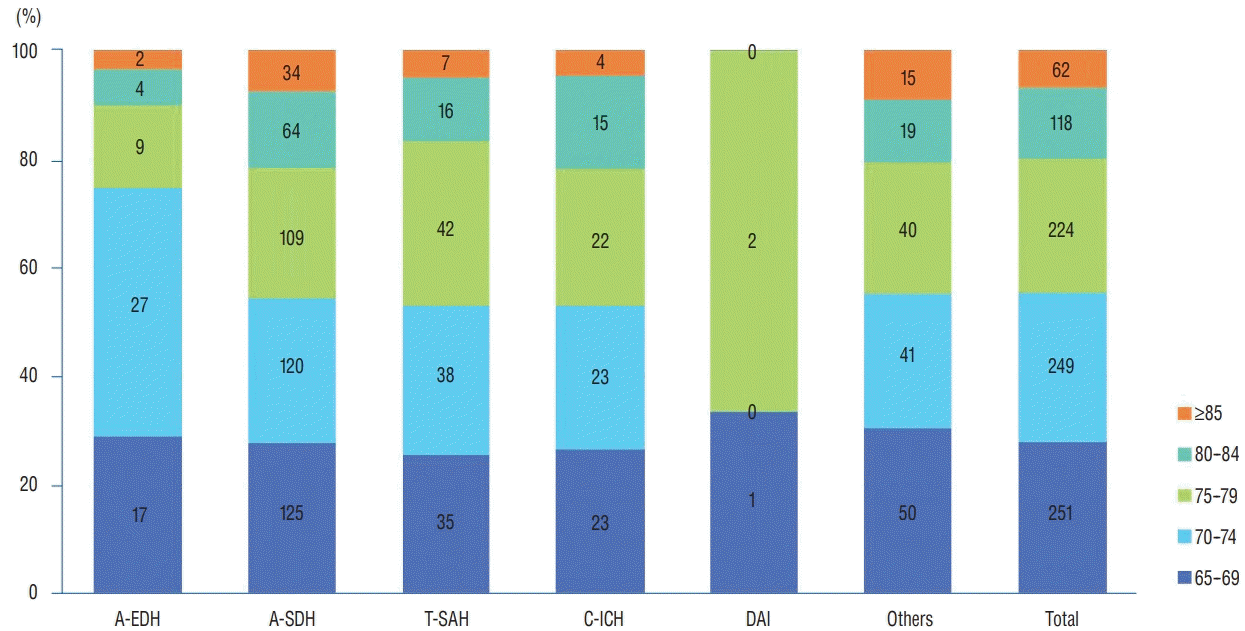
The diagnosis of the admitted patients was determined by the most prominent injury that led to admission. For all age groups, the most common main diagnosis of TBI was A-SDH (n=452). Most main diagnoses of TBI were the highest in patients aged 65–69 years (n=251). The incidence of A-EDH was the highest in patients aged 70–74 years (45.8%) and that of T-SAH was the highest in those aged 75–79 years (30.4%; Fig. 2).

Time interval from TBI to hospital admission

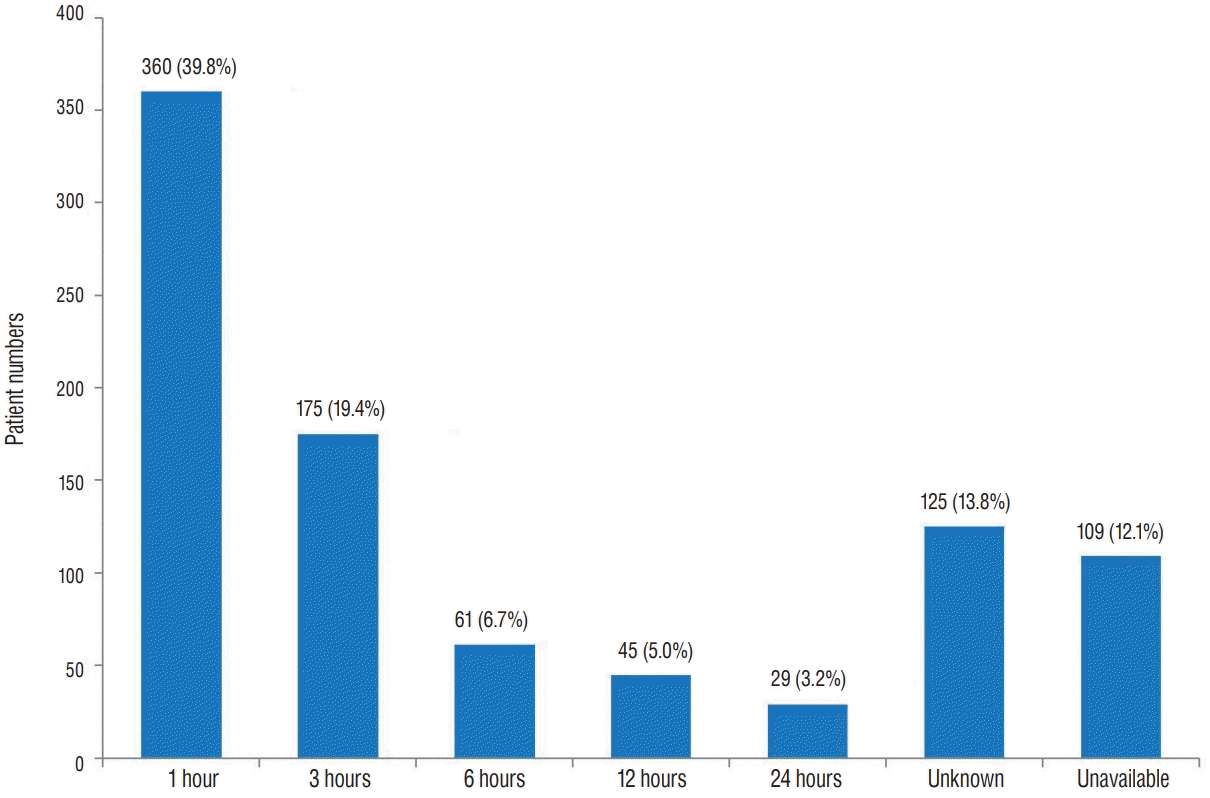
Fig. 3 shows the time interval from TBI to emergency room admission. With respect to the time of arrival to hospital after TBI, within 1 hour was the most common among 380 patients (39.8%). As the time interval (1–3, 3–6, 6–12, and 12–24 hours) increased, the number of patients decreased (n=175, 61, 45, and 29 and 19.4%, 6.7%, 5.0%, and 3.2%, respectively), except for those with unknown (n=125; 13.8%) and unavailable (n=109; 12.1%) data.

People who provided first aid earliest to elderly patients with TBI

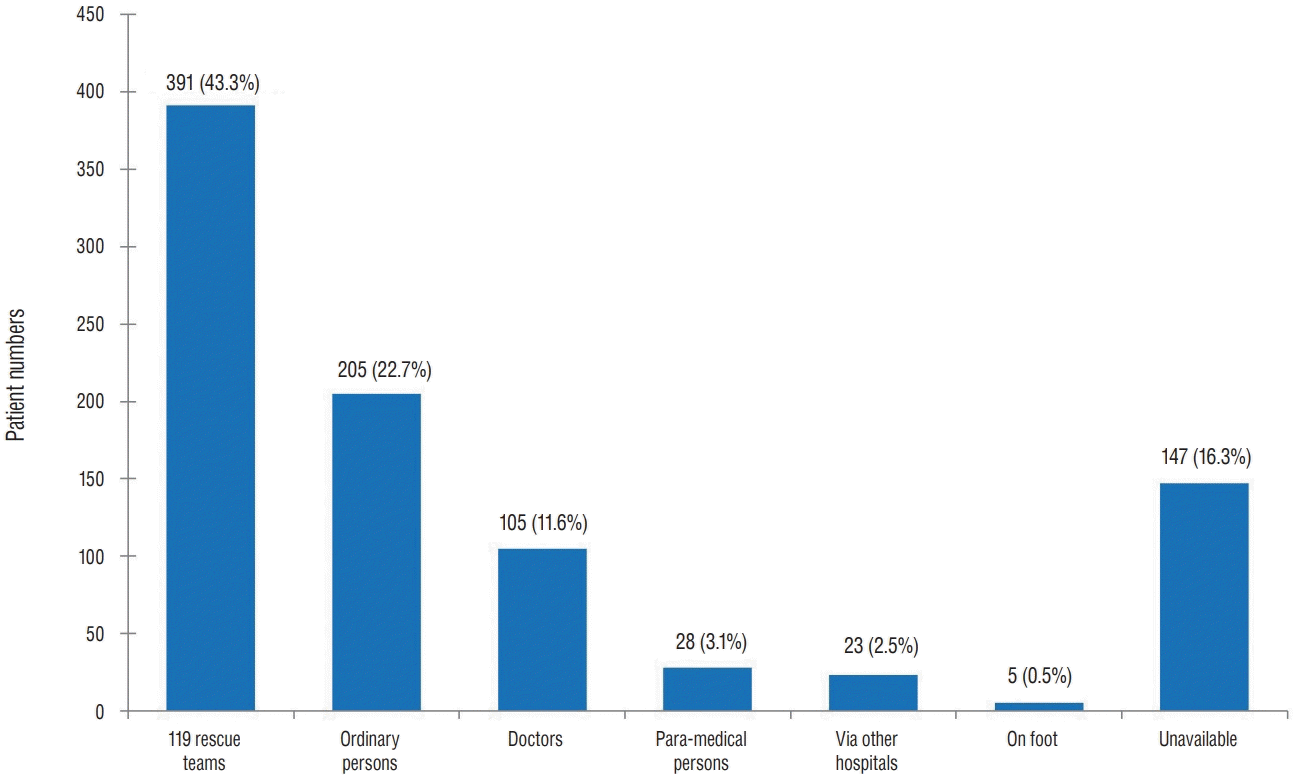
As shown in Fig. 4, people who provided first aid earliest to patients with TBI were 119 rescue team members (n=391; 43.3%) followed by ordinary people (n=205; 22.7%), unavailable data (n=147; 16.3%), doctors (n=106; 11.7%), paramedical personnel (n=28; 3.1%), via other hospital (n=23; 2.5%), and on foot (n=5; 0.6%).

Treatment of elderly patients with TBI according to age and sex

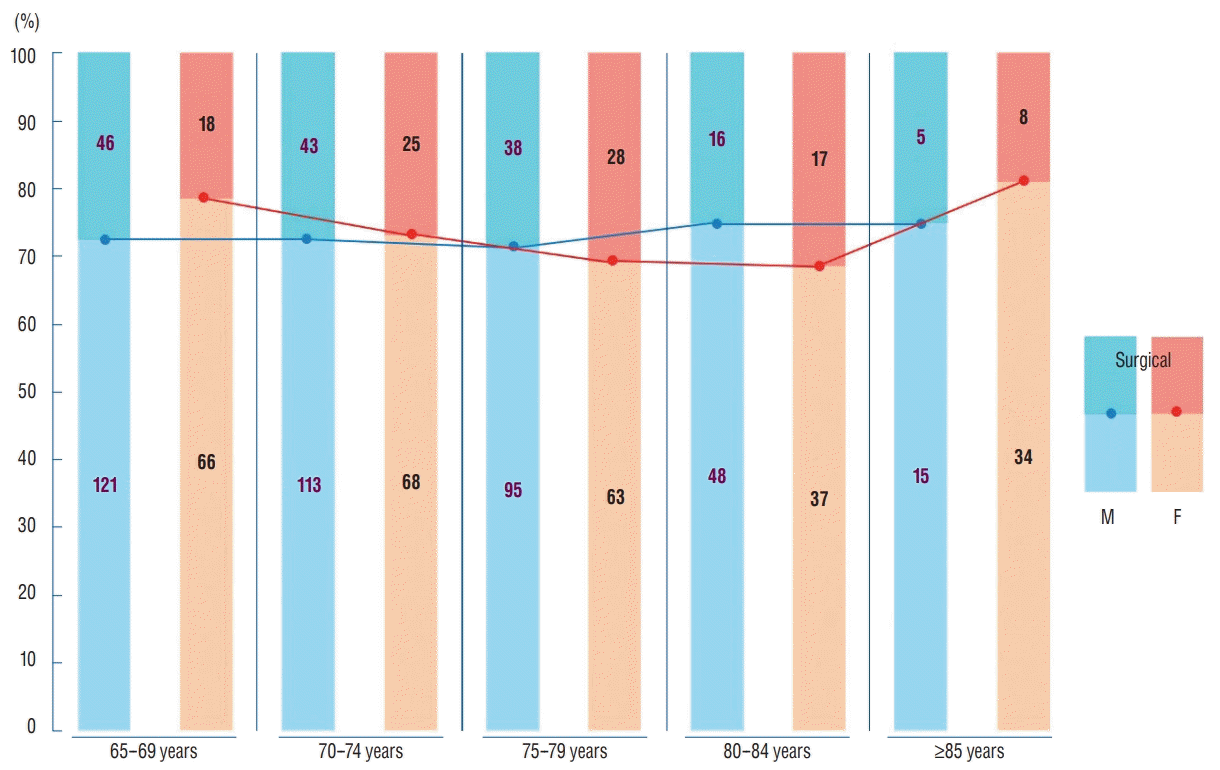
For all age groups (65–69, 70–74, 75–79, 80–74, and ≥85 years), the proportions of surgical treatment were roughly similar (38%, 38%, 40%, 33%, and 33%) in elderly men in the TBI group. While among elderly women in the TBI group, as the age increased, the proportion of surgical treatment increased to 80–84 years of age (27%, 37%, 44%, and 46%). The proportion markedly decreased in the ≥85-year age group (23%; Fig. 5).

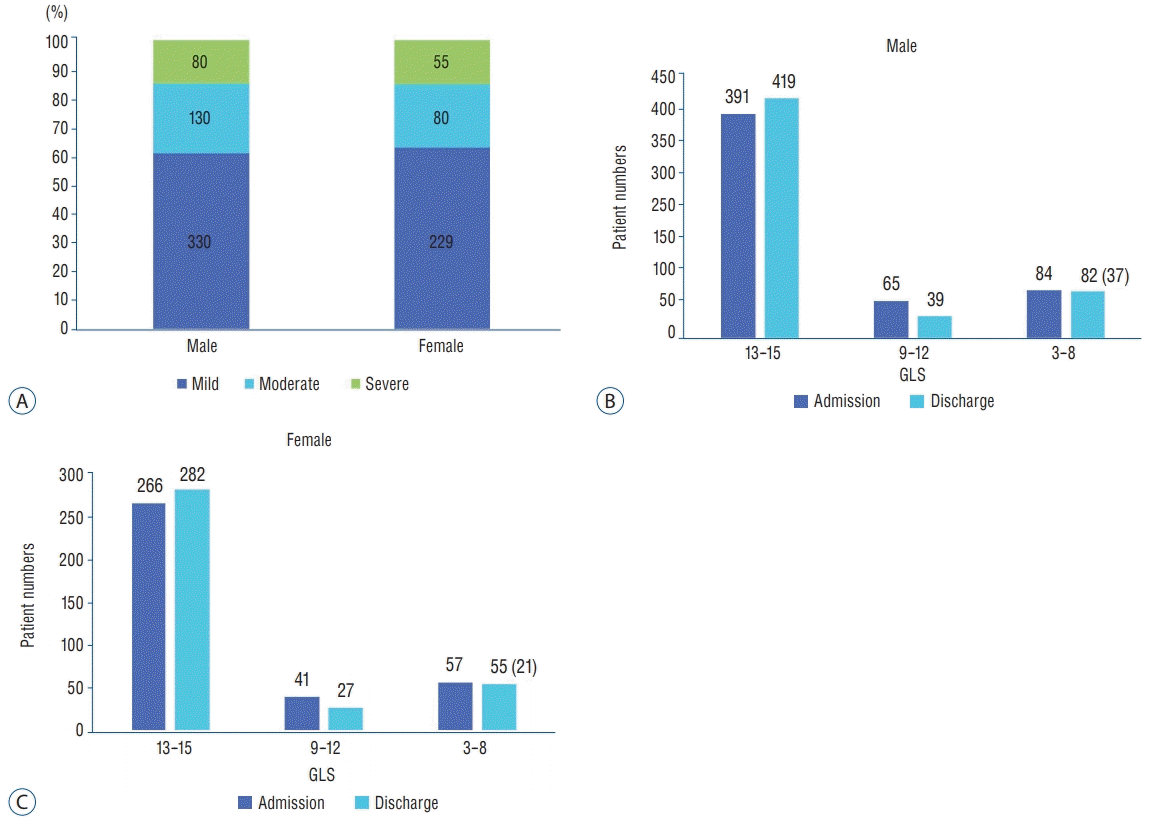
Severity of brain injury and GCS score at admission and discharge according to sex

The severity of brain injury (mild, moderate, and severe) showed similar ratios in both men (61%, 24%, and 15%, respectively) and women (63%, 22%, and 15%, respectively) group (Fig. 6A). The GCS score at admission and discharge were also similar in both men and women. The number of patients at admission (391 men and 266 women) in the 13–15-score group at admission increased at discharge (419 men and 282 women). The number of patients at admission (65 men and 41 women) in the 9–12-score group at admission decreased at discharge (39 men and 27 women) because many patients in the 9–12-score group moved to the 13–15-score group. The number of patients at admission (84 men and 57 women) in the 3–8-score group at admission, including the number of deaths (37 men and 21 women) appeared to be similar to that at discharge (82 men and 55 women; Fig. 6B and C).

Clinical characteristics and mortalities of 58 nonsurvivors

The clinical characteristics of survivors and non-survivors are summarized in Table 3. The overall mortality rate was 6.42%. The age distributions of the non-survivors vesrse survivor groups were not significantly different (p=0.508), with mortality rates of 5.98% in those aged 65–69 years (non-survivors vs. survivors : 25.9% vs. 27.9%), 6.02% in those aged 70–74 years (25.9% vs. 27.7%), 5.36% in those aged 75–79 years (20.7% vs. 25.1%), 7.63% in those aged 80–84 years (15.5% vs. 12.9%), and 11.29% in those aged ≥85 years (12.1% vs. 6.5%). The mortality rate has increased rapidly since the age of 85 years. The mortality of men (6.85%) was slightly higher than that of women (5.77%); however, this difference was not statistically significant (p=0.515; odds ratio [OR], 0.832). The mortality rate stratified according to the cause of trauma was significantly different (p=0.001), with mortality rates of 3.77% in fall (non-survivors vs. survivors : 25.9% vs. 45.3%), 11.65% in TA (50.0% vs. 26.0%), 13.33% in assault (3.4% vs. 1.5%), 5.17% in others (5.2% vs. 6.5%), 8.05% in unknown causes (12.1% vs. 9.5%), and 2.06% in unavailable causes (3.4% vs. 11.2%). The mortality rate stratified according to diagnosis was not significantly different (p=0.079), with mortality rates of 6.78% in A-EDH (non-survivors vs. survivors : 6.9% vs. 6.5%), 8.19% in A-SDH (63.8% vs. 49.1%), 6.52% in T-SAH (15.5% vs. 15.2%), 5.75% in C-ICH (8.6% vs. 9.7%), 0.00% in DAI (0.0% vs. 0.4%), and 1.82% in others (5.2% vs. 19.1%). The mortality rates according the severity of brain injury show that as the severity increased, the mortality rate increased, and the difference was statistically significant (p<0.001), with mortality rates of 0.35% in the mild group (non-survivors vs. survivors : 3.4% vs. 65.8%), 3.33% in the moderate group (12.1% vs. 24.0%), and 36.30% in the severe group (84.5% vs. 10.2%). The mortality rates according the GCS score at admission show that as the GCS score decreased, the mortality rate increased, and the difference was statistically significant (p<0.001), with mortality rates of 1.07% in the 13–15-score group (non-survivors vs. survivors : 12.1% vs. 76.8%), 7.55% in the 9–12-score group (13.8% vs. 11.6%), and 30.50% in the 3–8-score group (74.1% vs. 10.2%). The difference in mortality rates between surgical (4.24%) and non-surgical (12.30%) treatment was statistically significant (p=0.001; OR, 3.164).

Cause of death and time interval from TBI to death in non-survivors

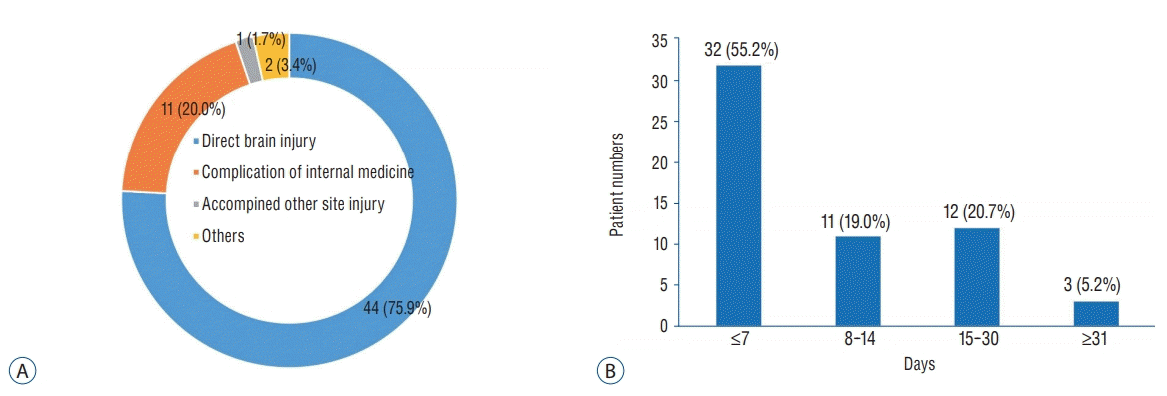
Among 125 hospitalized non-survivors, direct brain damage was the most common cause of death (75.9%, n=44), followed by complications of internal medicine (20.0%, n=11), others (3.4%; n=2), and accompanied other site injury (1.7%; n=1) (Fig. 7A). Thirty-two patients (55.2%) died within 7 days, 11 (19.0%) died within 8–14 days, 12 (20.7%) died within 15–30 days, and three (5.2%) died after 1 month (Fig. 7B).

DISCUSSION

In the past few decades, the incidence of TBI has declined among young adults, potentially because of greater public awareness and improved preventative measures; in contrast, elderly patients continue to experience the highest and fastest growing TBI rates compared with patients in other age groups [3,5,6]. In general, age is closely associated with increased poor outcomes and mortality after TBI [7,13,15]. Outcomes and poor prognostic factors in geriatric TBI are increased age, low GCS score, pupillary dilatation, intracranial mass lesion, motor vehicle accidents, falls, jumps, intracranial pressure ≥20 mmHg, early hypoxia, associated systemic injury, and systemic complications [7,12,13,15,17]. In addition, elderly patients are known to experience worse outcomes and require prolonged recovery compared with patients in other age groups even after controlling for injury severity [6].
Table 1 shows that the demographic clinical characteristics of elderly patients with TBI, as stratified by sex. As the age increased, a decreasing trend was observed in the number of cases with TBI in 904 patients because of the decrease in the elderly population. This trend was more prominent in men. However, the incidence of TBI in female patients is the highest at an age of 70–79 years; this difference according to sex was statistically significant, possibly because of increasing women’s social activities and the average life expectancy of women being longer than that of men. No significant differences were observed in demographic clinical characteristics between male and female patients with TBI, except for the age distribution. Falls are the leading cause of TBI in older adults, and TA are second in acute care aligns with results from around the world [3,16]. Our study also revealed falls as the most common cause of TBI, followed by TA. However, elderly patients in Korea had higher ratios of TA than did those in other countries [16]. The incidence of falls was higher in the female group (46.4%) and of TAs was higher in men (28.3%) in this study. Fu et al. [6] reported that patients with a fall-related TBI tended to be women, older, and have a higher comorbidity than those with a non-fall related TBI. Chan et al. [3] insisted that the marked increase in fall-related TBI illustrates the need for an increased focus on fall prevention strategies among older adults.
Irrespective of age, the incidence of TBI has been reported to be higher in men in the literature [7,11-14]. As shown in Table 2 and Fig. 1, men experience about twice as many TBI events as do women in all age groups. Despite the increasing life expectancy and social activities of elderly women, the incidence according to the age group is roughly similar and not significantly different based on the demographic statistics of the KNSO in March 2014 [9].
In this study, the diagnoses in a decreasing order of the number of TBI patients admitted were A-SDH (50.0%), others (18.3%), T-SAH (15.3%), C-ICH (9.6%), A-EDH (6.5%), and DAI (0.3%), and this result was slightly different from that reported in previous study including 2617 patients of all age groups registered in the KNTDBS in 2016 [14]. In a previous study, although the incidence of A-SDH was the highest, its proportion was only 37.5%. Whereas A-EDH had a high percentage of 15.1, the proportion of T-SAH (14.4%) and C-ICH (9.8%) was similar in this study (Fig. 2). Epidural hematoma is typically observed in children and young adults, but is rare in elderly people, because of the firm adherence of the dura to the inner table of the skull.
Fig. 3 shows that most patients arrived to the hospital within 1 hour of TBI, except those with unknown causes and unavailable data. These data suggest an excellent emergency patient transportation system and access to the hospitals of Korea. Fig. 4 shows that people who provided first aid earliest were 119 rescue team members, followed by ordinary people. Notably, ordinary people were at the second rank in providing emergency treatment, indicating that these people possess the knowledge of first aid to some extent and actively participated in patient treatment.
The proportion of surgical treatment was similar in both men (37.8%) and women (35.8%). Fig. 5 shows that the similar proportions of surgical and non-surgical treatment of elderly patients with TBI for all age groups of both men and women. This suggests that recently, many surgeons are willing to perform surgery for elderly patients because of the advancements in modern medical science and prolonged average lifespans. Fig. 6 shows that the severity of brain injury, GCS score at admission, and discharge rate showed similar incidence and proportions in both men and women. Most registered patients had mild brain injury (61.8%) and GCS 13–15 score at admission (72.7%). These proportions explain much lower mortality (6.42%) in this study compared with that in several studies in other countries with a high proportion of severe TBI on registered elderly patients [8,12,13,15].
Table 3 shows that the clinical characteristics of non-survivors and survivors and mortality. Older adults have the highest rates of hospitalization and mortality following TBI and experience poorer outcomes than do younger adults with the same injury severity [16]. Age has been reported to be the single most predictive factor for poor prognosis, and geriatric TBI patients have been frequently shown to have greater mortality and worse outcomes than their younger counterparts [7,12,15,17]. Previous study of the KNTDBS confirmed these previously reported results of significantly higher mortality in patients older than 61 years [14]. However, the mortality rate was not significantly different with respect to the age distribution of patients older than 65 years, although the mortality rate has rapidly increased since the age of 85 years. The mortality rate of male and female patients was not significantly different in this study, although risk factors for TBI among older adults may vary by sex. Albrecht et al. [1] found no sex differences in mortality following isolated TBI among older adults, in contrast to other studies and their own analyses using all TBI cases. Leitgeb et al. [10] also did not observe a significant effect of sex on mortality after adjustment for injury severity and mechanisms. In contrast, Davis et al. [4] reported that post-menopausal women (age ≥50 years) were at a decreased risk of mortality at discharge compared with age-matched men. Berry et al. [2] reported that post-menopausal women (age ≥55 years) were at a decreased risk of mortality compared with age-matched men. Among elderly adults, falls are the most common cause of TBI, representing 50–80% of injuries in this population [3,5,6]. In this study, the mortality rate in the TA group (11.65%) was higher than that in the fall group (3.77%). The severity of brain injury (mild, moderate, and severe) showed a clear difference between fall (67.8%, 24.1%, and 8.0%, respectively) and TA (54.6%, 23.7%, and 21.7%, respectively) group suggesting that mortality was significantly higher in the TA group due to more grave conditions of patients. The author assume that the reasons for the difference in the mortality rate were comorbidities and injury severity according to the mechanisms of injury between falls and TA. Notably, injury severity is a significant predictor of mortality in elderly patients with TBI. Fu et al. [6] showed that increased age, comorbidities, and injury severity were independent predictors of mortality; these findings are consistent with those previously reported. Utomo et al. [18] found that severe TBI (GCS score, 3–8) was associated with a 24-fold increased risk of death compared with mild TBI (GCS score, 13–15). Similarly, McIntyre et al. [11] analyzed 13 studies involving 35157 patients and reported a 12.7 times increased risk of death for severe TBI versus mild TBI.
Shimoda et al. [13] reported that surgical management was associated with improved outcomes and mortality rate of elderly patients with TBI. This was particularly true among those who experienced acute subdural hematomas and those with GCS scores of 6–15, provided with intensive neurocritical care management although surgical management was not reported to be an effective treatment in elderly patients with GCS scores of 3–5. However, mortality in the non-surgery group was significantly lower than that in the surgery group. The reasons for this much differences with study of Shimoda et al. [13], the proportion of severe (GCS, 3–8) was 15.6% and surgery group was 27.0% patient in our study, while the proportion of severe (GCS, 3–8) was 76.4% and surgery group was 44.1% patient in Shimoda et al.’s [13] study. Among 125 hospitalized non-survivors, the proportions of the cause of death and the time interval from TBI onset to death was not much different with those reported in a previous study including all age groups [14]. Most patients died of direct brain damage within 7 days (Fig. 7).
The registered data provides a useful tool for quality control of the appropriate treatment plan for trauma because it can compare the medical practices of participating hospitals. In addition, trauma registration data is required to register the trauma mechanism and the environment at the time of injury, so that the data can be used well to lower the risk of similar type of trauma. However, different systems in each institute make the registered data inconsistent and unreliable. In addition, registering a trauma patient is costly and time-consuming, and requires a consistent registrant.
The study has some limitations as we noted in our previous because we used the same data bank system with the KNTDBS [14]. In summary, 1) we could not identify the number of TBI patients who were not registered in the KNTDBS. 2) There is a lack of precise criteria and definitions of multiple or combined injuries in the diagnosis categories as well as in the diagnoses classified as others. 3) There are no precise criteria for the separate category of brain injury severity. 4) Because there is no precise unified surgical indication for TBI, each of the 20 institution is likely to have different surgical indication. And 5) there is a lack of various factors that affect outcomes and mortality rate. Therefore, we need more precise and detailed classification systems with respect to the causes of TBI in nonsurvivors to investigate the cause of death.

CONCLUSION

To our knowledge, this study is the first to focus on elderly patients with TBI in Korea and particularly investigate mortality and characteristics related to TBI-related death based on data from the KNTDBS. Using the KNTDBS, we identified clinical epidemiology, sex difference, outcome epidemiology, sociodemographic variables, and outcomes in the geriatric population. Although the study has many limitations, our results may be used to obtain useful information to study targeted prevention and more effective treatment options for older TBI patients and establish novel treatment guidelines and health polish for the geriatric population. We also believe that this study contributes toward improving and compensating for the limitations of the KNTDBS in the future.

Notes

No potential conflict of interest relevant to this article was reported.

INFORMED CONSENT

This type of study does not require informed consent.

ACKNOWLEDGMENTS

This work was supported by Wonkwang University in 2017. Authors are thankful to members of the KNTDB investigators include Bo-Ra Seo (Chonnam National University Hospital), Byeong-Cheol Rim (Chungbuk National University Hospital), Byung-Moon Cho (Hallym University Kangdong Sacred Heart Hospital), Sang Koo Lee (Dankook University Hospital), Ki-Seong Eom (Wonkwang University Hospital), Hyun-Ho Jung (Wonju Severance Christian Hospital), JaeHoon Kim (Eulji University Hospital), Jeong-Ho Lee (Daegu Fatima Hospital), Jong-Hyun Kim (Korea University Guro Hospital), Min-Su Kim (Yongnam University Hospital), TaekKyun Nam (Chung-Ang University Hospital), and Young-Jin Song (Dong-A University Hospital).

References

1. Albrecht JS, McCunn M, Stein DM, Simoni-Wastila L, Smith GS. Sex differences in mortality following isolated traumatic brain injury among older adults. J Trauma Acute Care Surg. 81:486–492. 2016.
crossref
2. Berry C, Ley EJ, Tillou A, Cryer G, Margulies DR, Salim A. The effect of gender on patients with moderate to severe head injuries. J Trauma. 67:950–953. 2009.
crossref
3. Chan V, Zagorski B, Parsons D, Colantonio A. Older adults with acquired brain injury: a population based study. BMC Geriatr. 13:97. 2013.
crossref
4. Davis DP, Douglas DJ, Smith W, Sise MJ, Vilke GM, Holbrook TL, et al. Traumatic brain injury outcomes in pre- and post- menopausal females versus age-matched males. J Neurotrauma. 23:140–148. 2006.
crossref
5. Fu TS, Jing R, McFaull SR, Cusimano MD. Recent trends in hospitalization and in-hospital mortality associated with traumatic brain injury in Canada: a nationwide, population-based study. J Trauma Acute Care Surg. 79:449–454. 2015.
crossref
6. Fu WW, Fu TS, Jing R, McFaull SR, Cusimano MD. Predictors of falls and mortality among elderly adults with traumatic brain injury: a nationwide, population-based study. PLoS One. 21:12, e0175868. 2017.
crossref
7. Hukkelhoven CW, Steyerberg EW, Rampen AJ, Farace E, Habbema JD, Marshall LF, et al. Patient age and outcome following severe traumatic brain injury: an analysis of 5600 patients. J Neurosurg. 99:666–673. 2003.
crossref
8. Jamjoom A, Nelson R, Stranjalis G, Wood S, Chissell H, Kane N, et al. Outcome following surgical evacuation of traumatic intracranial haematomas in the elderly. Br J Neurosurg. 6:27–32. 1992.
crossref
9. Korean Statistical Information Service. Statistical database, Population census. Available from: http://kosis.kr/statisticsList/statisticsListIndex.do?menuId=M_01_01&vwcd=MT_ZTITLE&parmTabId=M_01_01.
10. Leitgeb J, Mauritz W, Brazinova A, Janciak I, Majdan M, Wilbacher I, et al. Effects of gender on outcomes after traumatic brain injury. J Trauma. 71:1620–1626. 2001.
crossref
11. McIntyre A, Mehta S, Aubut J, Dijkers M, Teasell RW. Mortality among older adults after a traumatic brain injury: a meta-analysis. Brain Inj. 27:31–40. 2013.
crossref
12. Nakamura N, Yamaura A, Shigemori M, Ogawa T, Tokutomi T, Ono J, et al. Final report of the Japan Neurotrauma Data Bank Project 1998-2001: 1,002 cases of traumatic brain injury. Neurol Med Chir (Tokyo). 46:567–574. 2006.
crossref
13. Shimoda K, Maeda T, Tado M, Yoshino A, Katayama Y, Bullock MR. Outcome and surgical management for geriatric traumatic brain injury: analysis of 888 cases registered in the Japan Neurotrauma Data Bank. World Neurosurg. 82:1300–1306. 2014.
crossref
14. Song SY, Lee SK, Eom KS, KNTDB Investigators. Analysis of Mortality and Epidemiology in 2617 Cases of Traumatic Brain Injury : Korean Neuro-Trauma Data Bank System 2010-2014. J Korean Neurosurg Soc. 59:485–491. 2016.
crossref
15. Susman M, DiRusso SM, Sullivan T, Risucci D, Nealon P, Cuff S, et al. Traumatic brain injury in the elderly: increased mortality and worse functional outcome at discharge despite lower injury severity. J Trauma. 53:219–223. 2002.
crossref
16. Thompson HJ, McCormick WC, Kagan SH. Traumatic brain injury in older adults: epidemiology, outcomes, and future implications. J Am Geriatr Soc. 54:1590–1595. 2006.
crossref
17. Tokutomi T, Miyagi T, Ogawa T, Ono J, Kawamata T, Sakamoto T, et al. Age-associated increases in poor outcomes after traumatic brain injury: a report from the Japan Neurotrauma Data Bank. J Neurotrauma. 25:1407–1414. 2008.
crossref
18. Utomo WK, Gabbe BJ, Simpson PM, Cameron PA. Predictors of inhospital mortality and 6-month functional outcomes in older adults after moderate to severe traumatic brain injury. Injury. 40:973–977. 2009.
crossref

Fig. 1.
Incidence of traumatic brain injury in elderly patients according to the age distribution and sex. DSK : Demographic statistics of the Korea National Statistical Office in March 2014, Pts : patients in this study (n=904).
jkns-2018-0017f1.tif
Fig. 2.
Main diagnosis of older patients with traumatic brain injury according to age. A-EDH : acute epidural hematoma, A-SDH : acute subdural hematoma, T-SAH : traumatic subarachnoid hemorrhage, C-ICH : contused intracranial hemorrhage, DAI : diffuse axonal injury.
jkns-2018-0017f2.tif
Fig. 3.
Time interval from traumatic brain injury to arrival for emergency room of hospital.
jkns-2018-0017f3.tif
Fig. 4.
People who provided first aid earliest to patients with traumatic brain injury.
jkns-2018-0017f4.tif
Fig. 5.
Treatment of elderly patients with TBI according to age distribution. M : male, F : female, TBI : traumatic brain injury.
jkns-2018-0017f5.tif
Fig. 6.
Severity of brain injury (A) and GCS score at admission (B) and discharge (C) according to sex. GCS : Glasgow coma scale.
jkns-2018-0017f6.tif
Fig. 7.
Cause of death (A) and the time interval from traumatic brain injury to death (B) in non-survivors.
jkns-2018-0017f7.tif
Table 1.
Demographic characteristics of older patients with traumatic brain injury
Characteristic Men (n=540) Women (n=364) Total (n=904) p-value*,
Age (years)*, <0.001
 65–69 167 (30.9) 84 (23.1) 251 (27.8)
 70–74 156 (28.9) 93 (25.5) 249 (27.5)
 75–79 133 (24.6) 91 (25.0) 224 (24.8)
 80–84 64 (11.9) 54 (14.8) 118 (13.1)
 ≥85 20 (3.7) 42 (11.5) 62 (6.9)
Cause 0.194
 Fall 229 (42.4) 169 (46.4) 398 (44.0)
 Traffic accident 153 (28.3) 96 (26.4) 249 (27.5)
 Assault 6 (1.1) 9 (2.5) 15 (1.7)
 Others 37 (6.9) 21 (5.8) 58 (6.4)
 Unknown 60 (11.1) 27 (7.4) 87 (9.6)
 Unavailable 55 (10.2) 42 (11.5) 97 (10.7)
Diagnosis 0.075
 A-EDH 39 (7.2) 20 (5.5) 59 (6.5)
 A-SDH 255 (47.2) 197 (54.1) 452 (50.0)
 T-SAH 88 (16.3) 50 (13.7) 138 (15.3)
 C-ICH 62 (11.5) 25 (6.9) 87 (9.6)
 DAI 1 (0.2) 2 (0.5) 3 (0.3)
 Others 95 (17.6) 70 (19.2) 165 (18.3)
Severity of brain injury* 0.764
 Mild 330 (61.1) 229 (62.9) 559 (61.8)
 Moderate 130 (24.1) 80 (22.0) 210 (23.2)
 Severe 80 (14.8) 55 (15.1) 135 (14.9)
GCS score at admission* 0.939
 13–15 391 (72.4) 266 (73.1) 657 (72.7)
 9–12 65 (12.0) 41 (11.3) 106 (11.7)
 3–8 84 (15.6) 57 (15.7) 141 (15.6)
Treatment 0.731
 Surgical 392 (72.6) 268 (73.6) 660 (73.0)
 Non-surgical 148 (27.4) 96 (26.4) 244 (27.0)
GCS score at discharge* 0.882
 13–15 419 (77.6) 282 (77.5) 701 (77.5)
 9–12 39 (7.2) 27 (7.4) 66 (7.3)
 3–8 45 (8.3) 34 (9.3) 79 (8.7)
 Death 37 (6.9) 21 (5.8) 58 (6.4)

* Mann-Whitney U test.

Pearson’s x2 and Fisher’s exact tests.

p<0.005 indicates statistical significance.

A-EDH : acute epidural hematoma, A-SDH : acute subdural hematoma, T-SAH : traumatic subarachnoid hemorrhage, C-ICH : contused intracranial hemorrhage, DAI : diffuse axonal injury, GCS : Glasgow coma scale

Table 2.
Incidence of traumatic brain injury according to age distribution and sex
Age Men
Women
DS-KNSO Pts Incidence (%) DS-KNSO Pts Incidence (%)
65–69 958491 167 0.017 1054503 84 0.008
70–74 795151 156 0.02 1000390 93 0.009
75–79 516144 133 0.026 780302 91 0.012
80–84 237366 64 0.027 488813 54 0.011
≥85 128569 20 0.016 370868 42 0.011
Total 2635721 540 0.02 3694876 364 0.01

Pts : patients in this study (n=904), DS-KNSO : Demographic statistics of the Korea National Statistical Office in March 2014

Table 3.
Characteristics and mortalities of 58 non-survivals
Characteristic Non-survivors (n=58) Survivors (n=846) Total patients (n=904) Mortality (%) p-value
Age (years)* 0.508
 65–69 15 (25.9) 236 (27.9) 251 5.98
 70–74 15 (25.9) 234 (27.7) 249 6.02
 75–79 12 (20.7) 212 (25.1) 224 5.36
 80–84 9 (15.5) 109 (12.9) 118 7.63
 ≥85 7 (12.1) 55 (6.5) 62 11.29
Sex 0.515
 Male 37 (63.8) 503 (59.5) 540 6.85
 Female 21 (36.2) 343 (40.5) 364 5.77
Cause, 0.001
 Fall 15 (25.9) 383 (45.3) 398 3.77
 Traffic accident 29 (50.0) 220 (26.0) 249 11.65
 Assault 2 (3.4) 13 (1.5) 15 13.33
 Others 3 (5.2) 55 (6.5) 58 5.17
 Unknown 7 (12.1) 80 (9.5) 87 8.05
 Unavailable 2 (3.4) 95 (11.2) 97 2.06
Diagnosis 0.079
 A-EDH 4 (6.9) 55 (6.5) 59 6.78
 A-SDH 37 (63.8) 415 (49.1) 452 8.19
 T-SAH 9 (15.5) 129 (15.2) 138 6.52
 Contused ICH 5 (8.6) 82 (9.7) 87 5.75
 DAI 0 3 (0.4) 3 0
 Others 3 (5.2) 162 (19.1) 165 1.82
Severity of brain injury*, <0.001
 Mild 2 (3.4) 557 (65.8) 559 0.35
 Moderate 7 (12.1) 203 (24.0) 210 3.33
 Severe 49 (84.5) 86 (10.2) 135 36.3
GCS score at admission*, <0.001
 13–15 7 (12.1) 650 (76.8) 657 1.07
 9–12 8 (13.8) 98 (11.6) 106 7.55
 3–8 43 (74.1) 98 (11.6) 141 30.5
Treatment, <0.001
 Surgical 28 (48.3) 632 (74.7) 660 4.24
 Non-surgical 30 (52.7) 214 (25.3) 244 12.3

* Mann-Whitney U test.

Pearson’s x2 and Fisher’s exact tests.

p<0.005 indicates statistical significance.

A-EDH : acute epidural hematoma, A-SDH : acute subdural hematoma, T-SAH : traumatic subarachnoid hemorrhage, ICH : intracranial hemorrhage, DAI : diffuse axonal injury, GCS : Glasgow coma scale

TOOLS
Similar articles